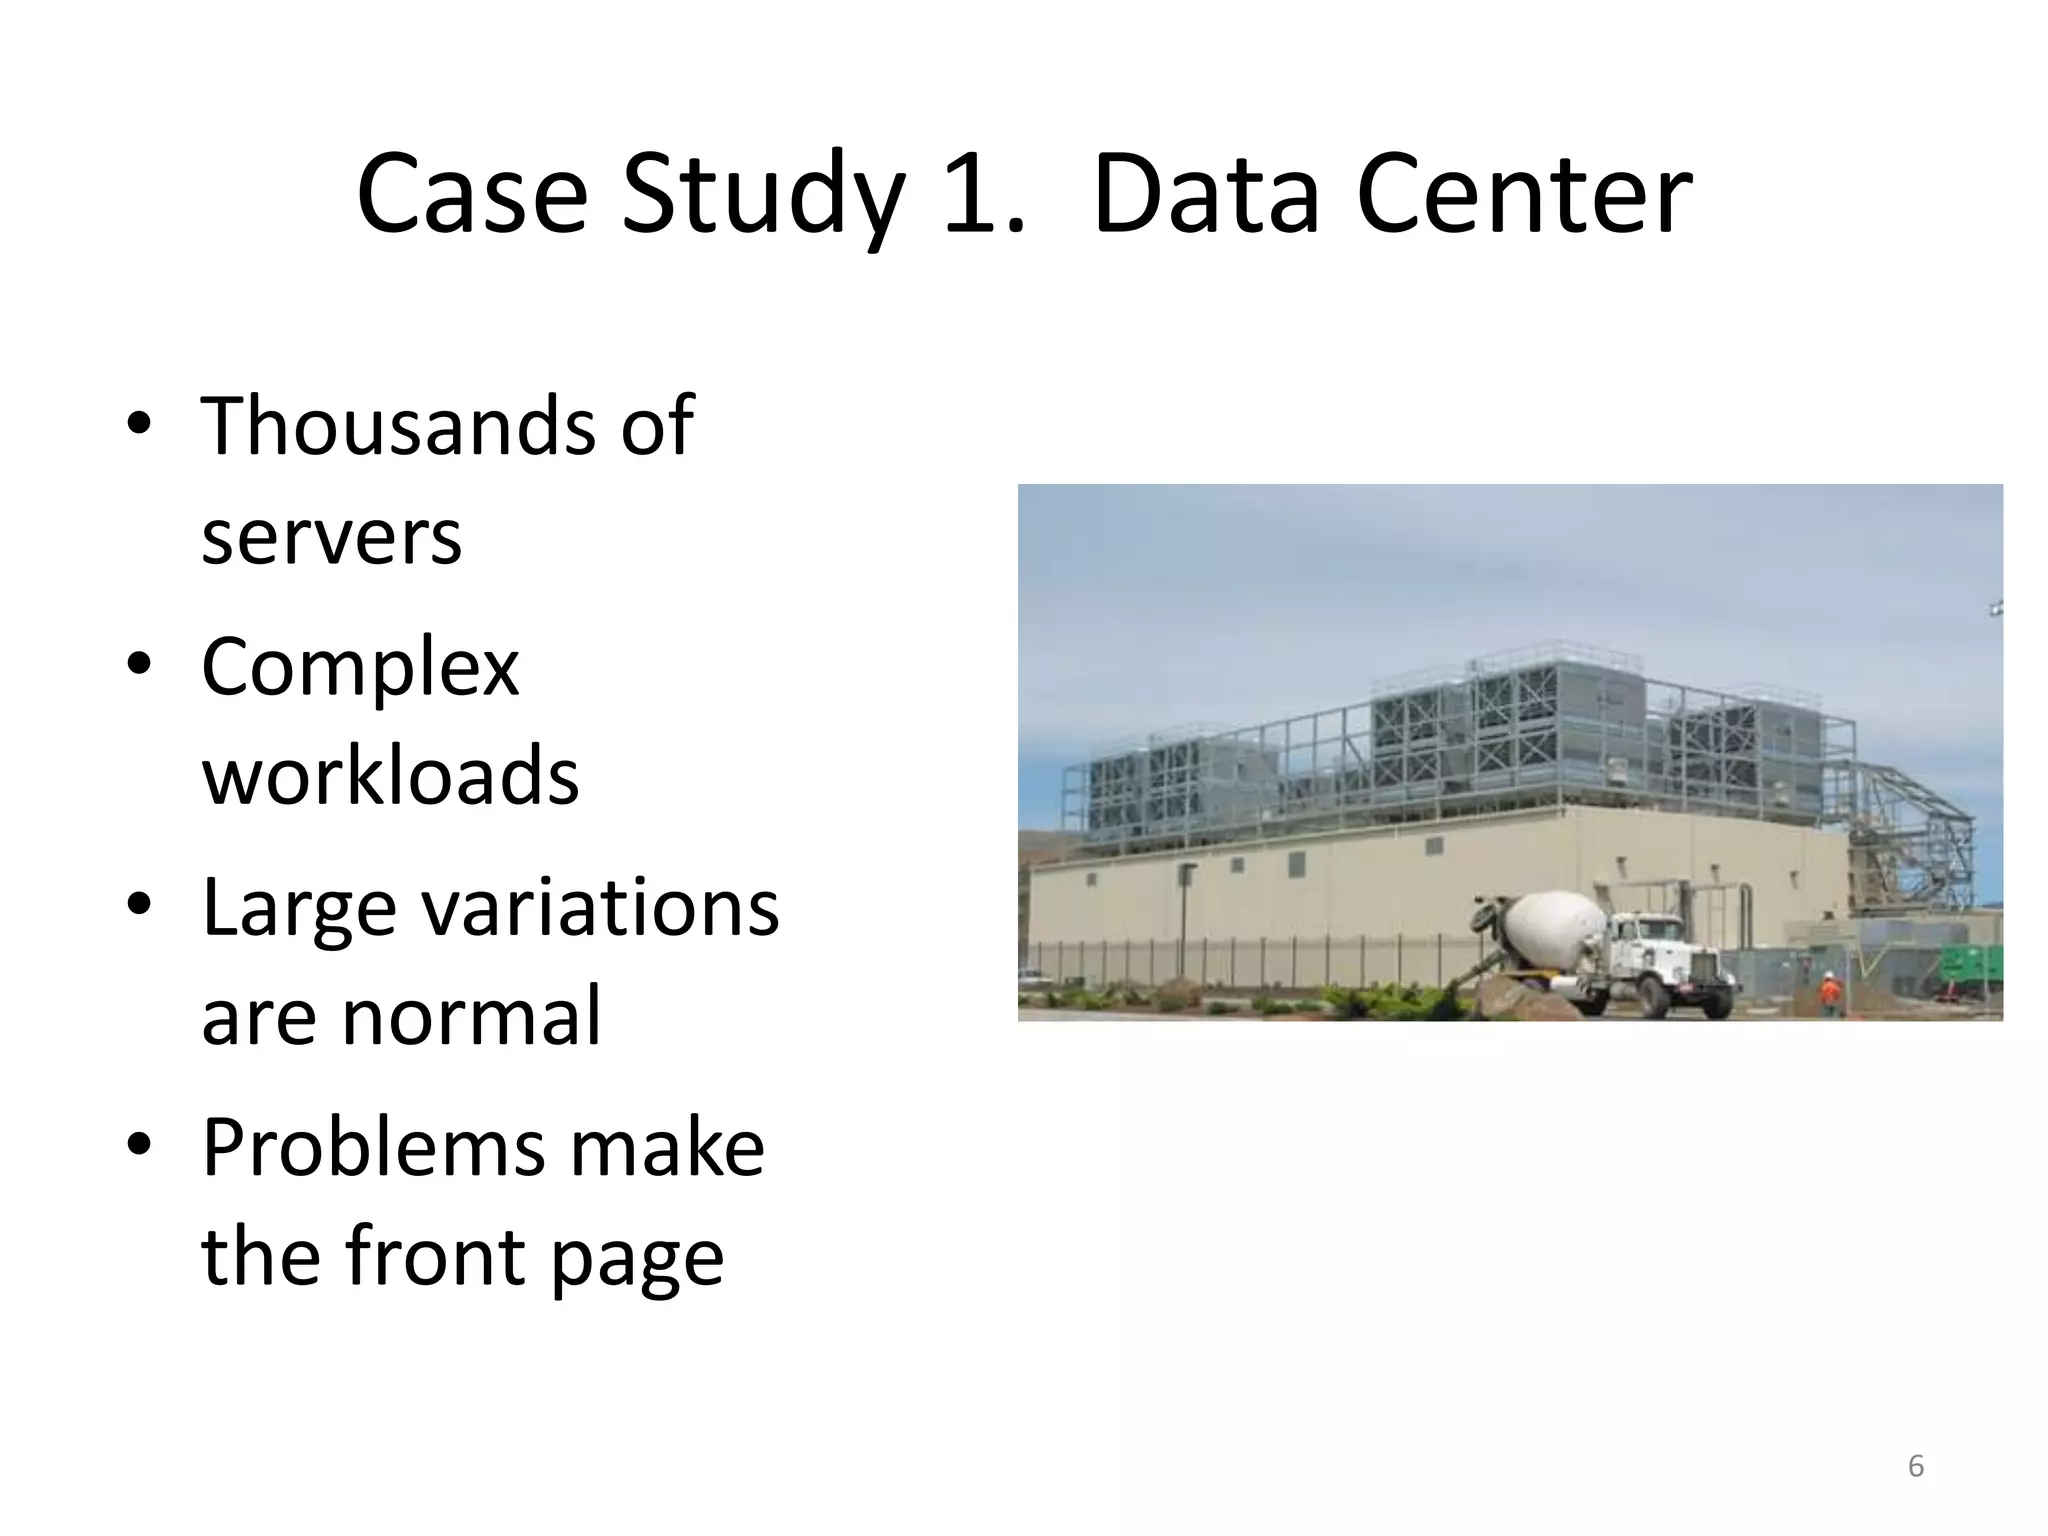
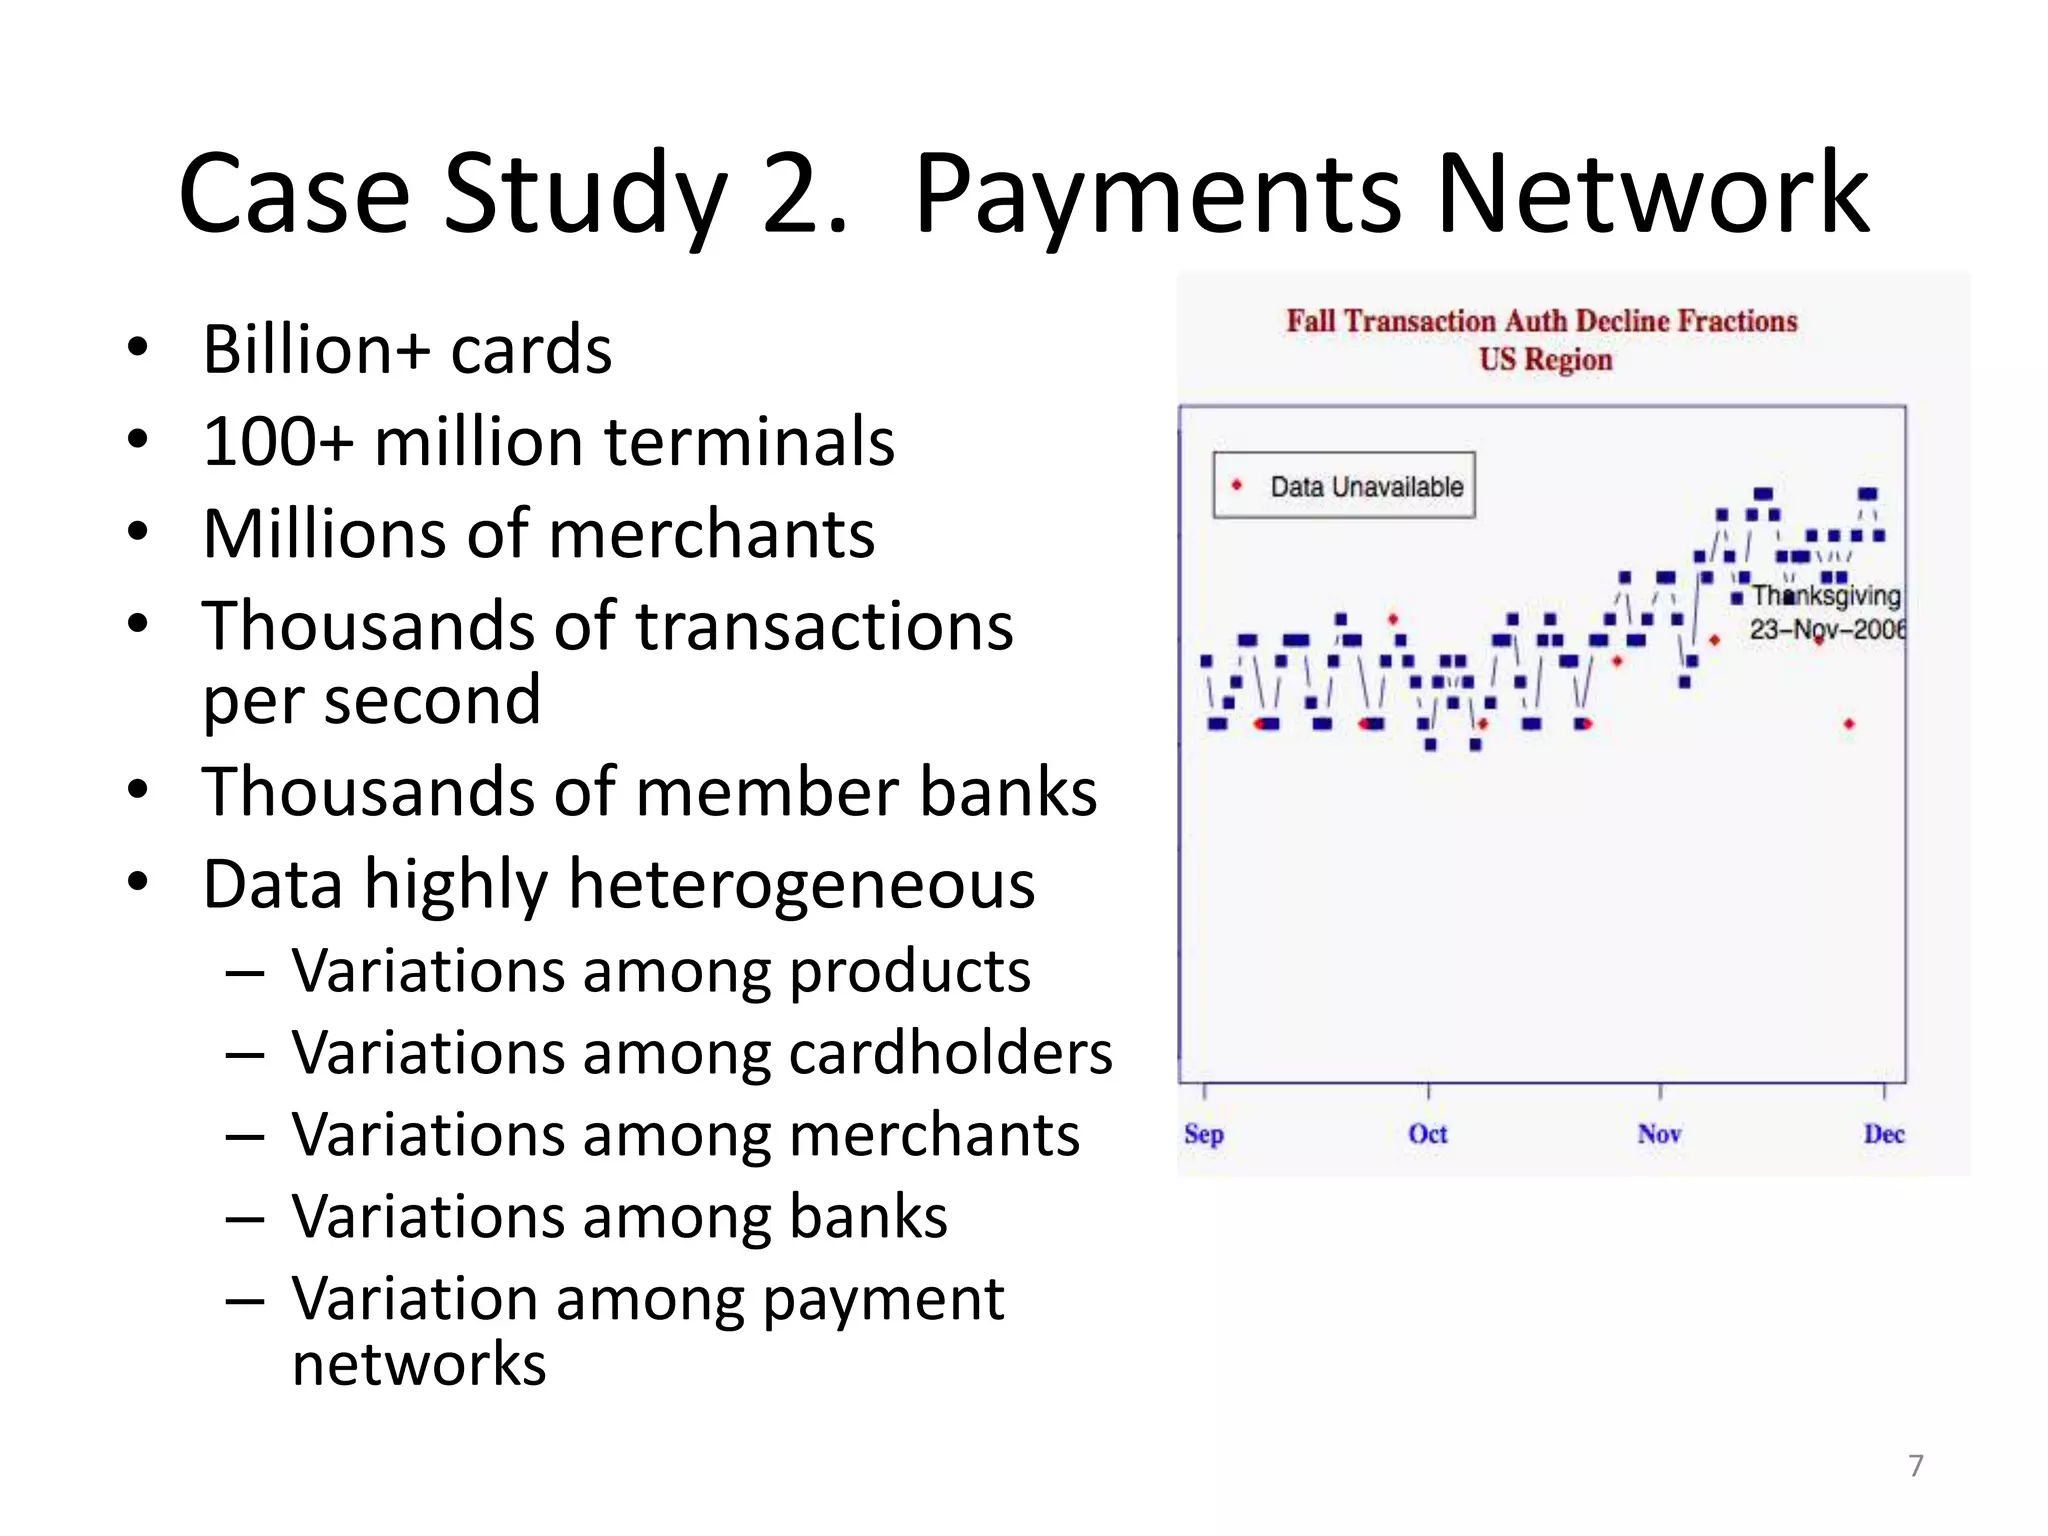
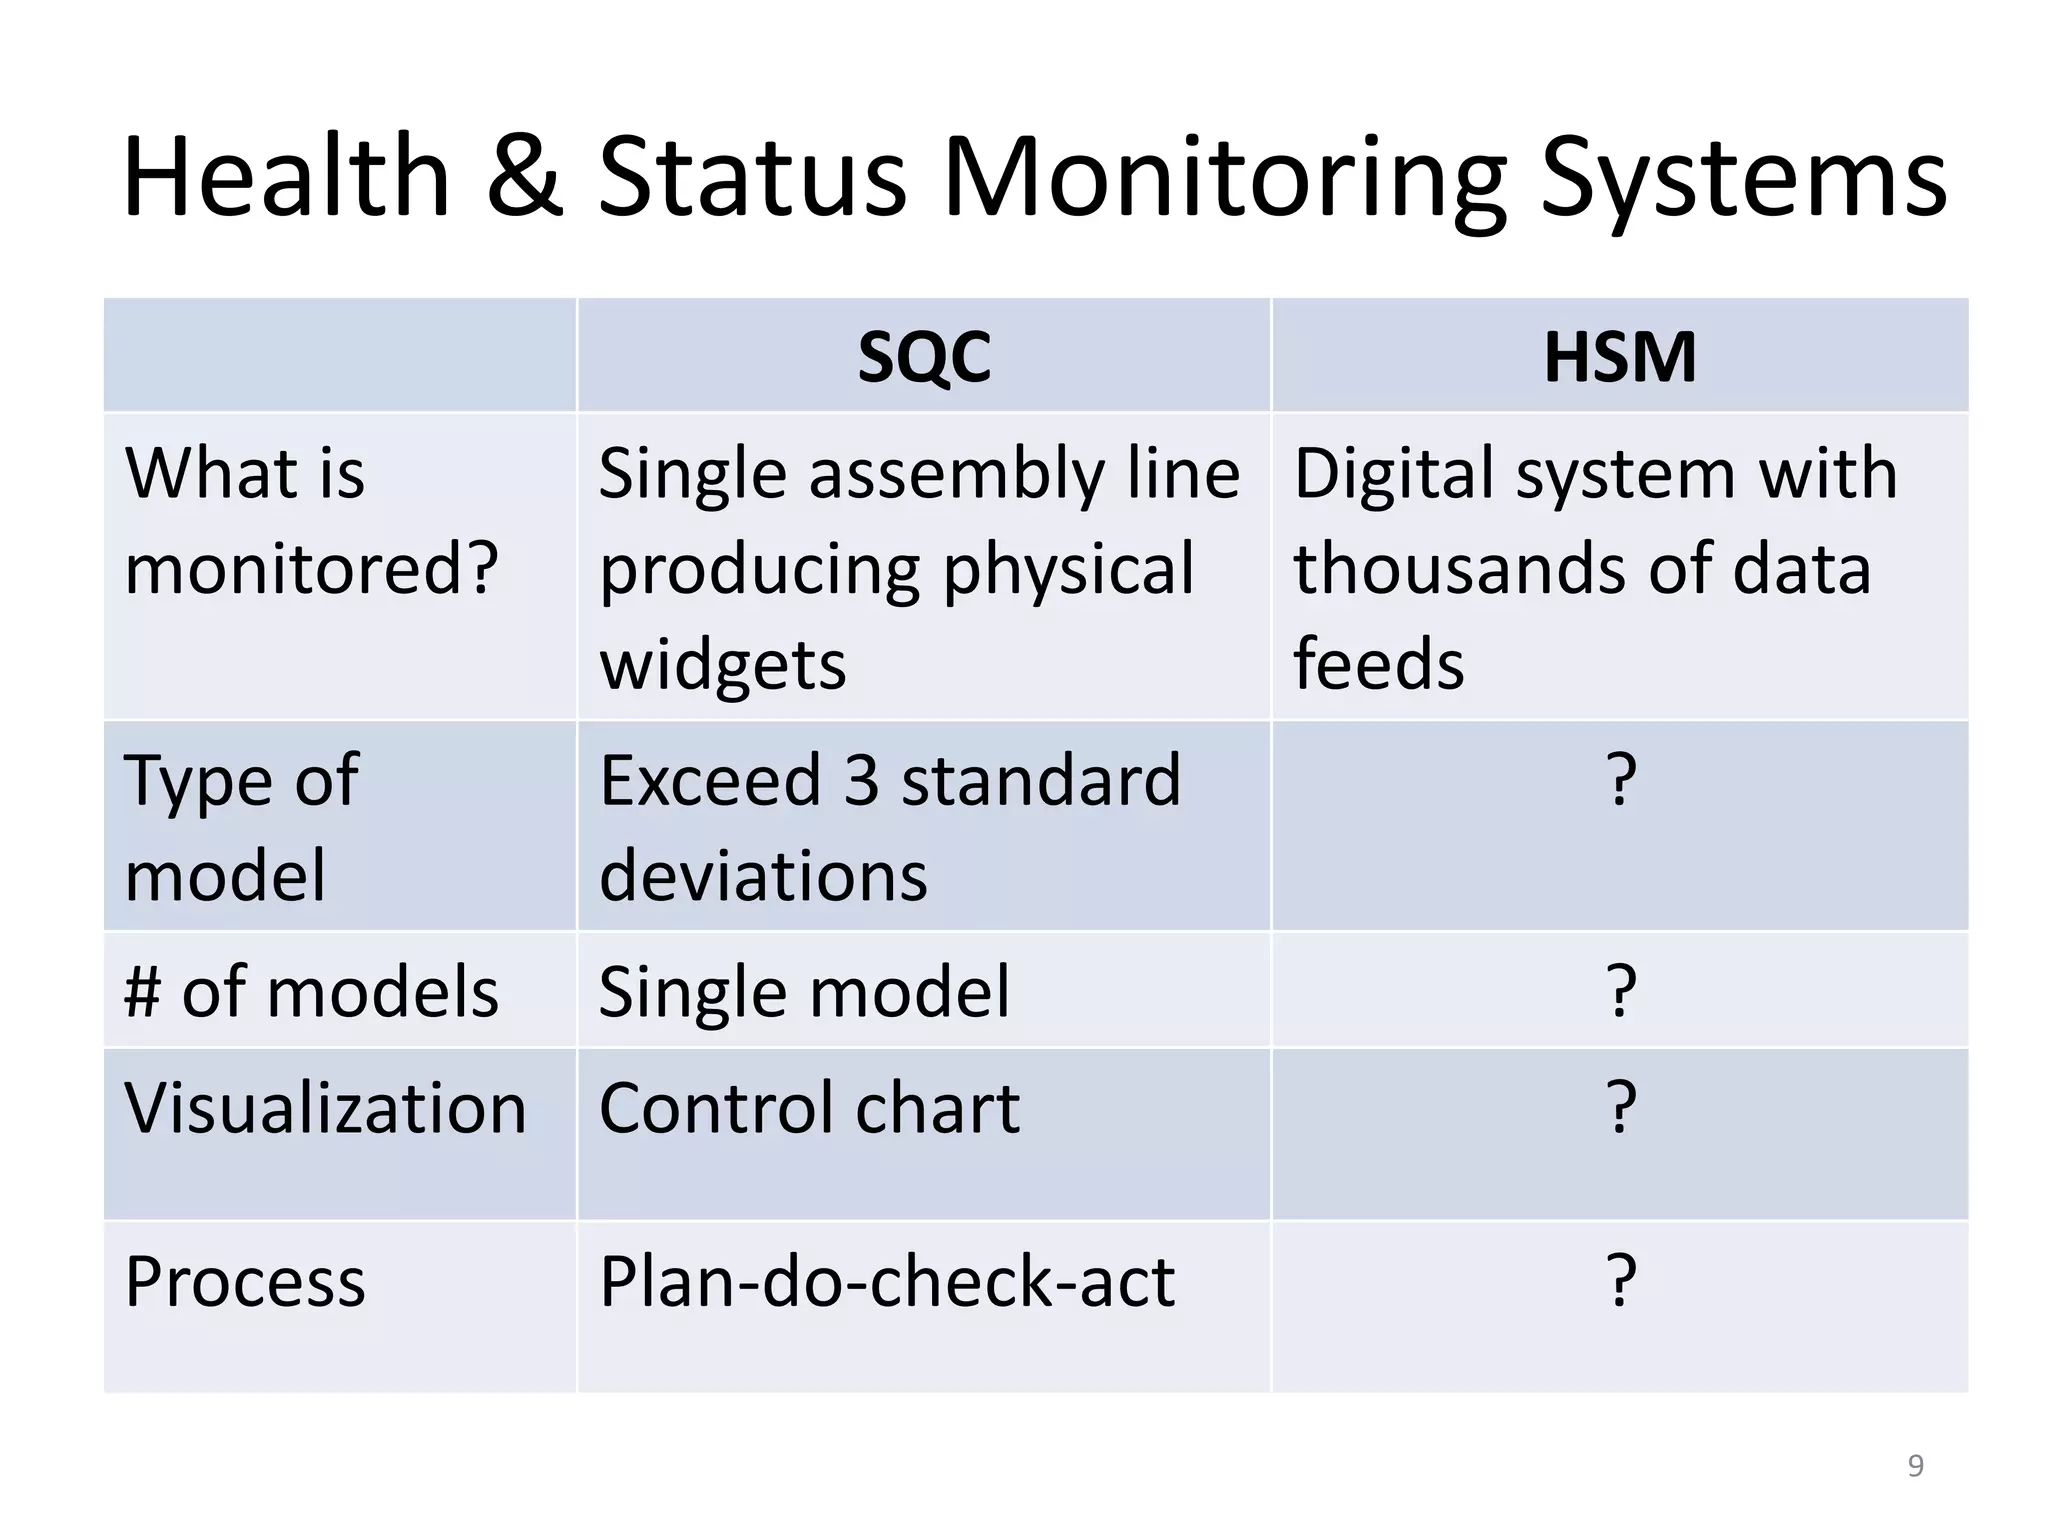
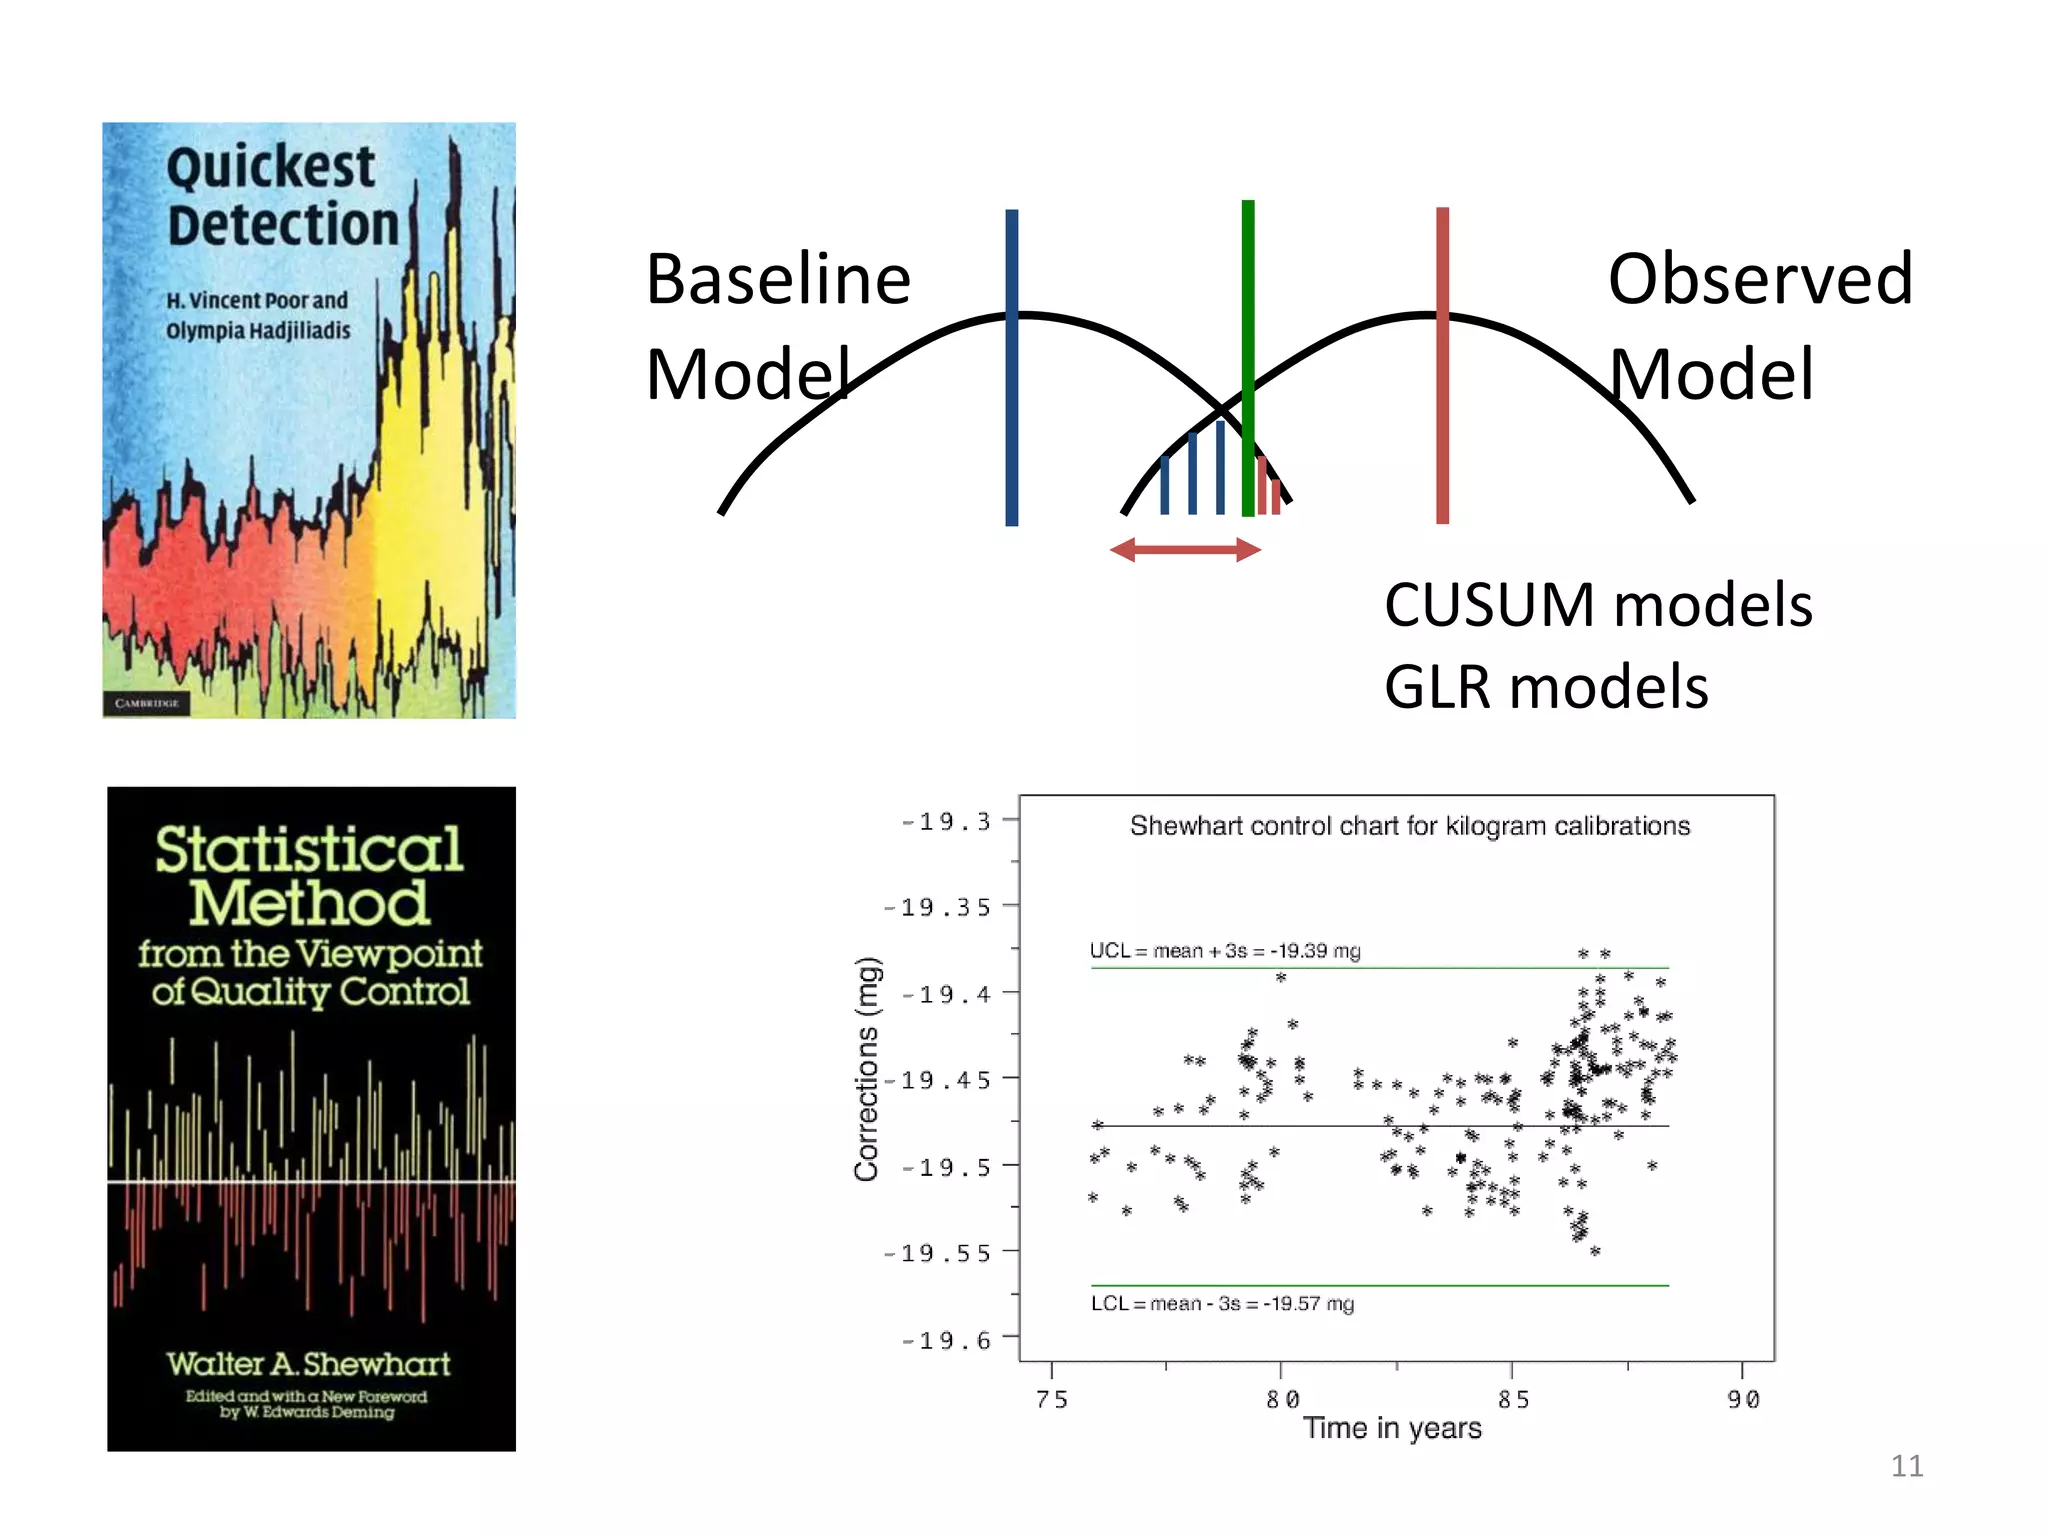
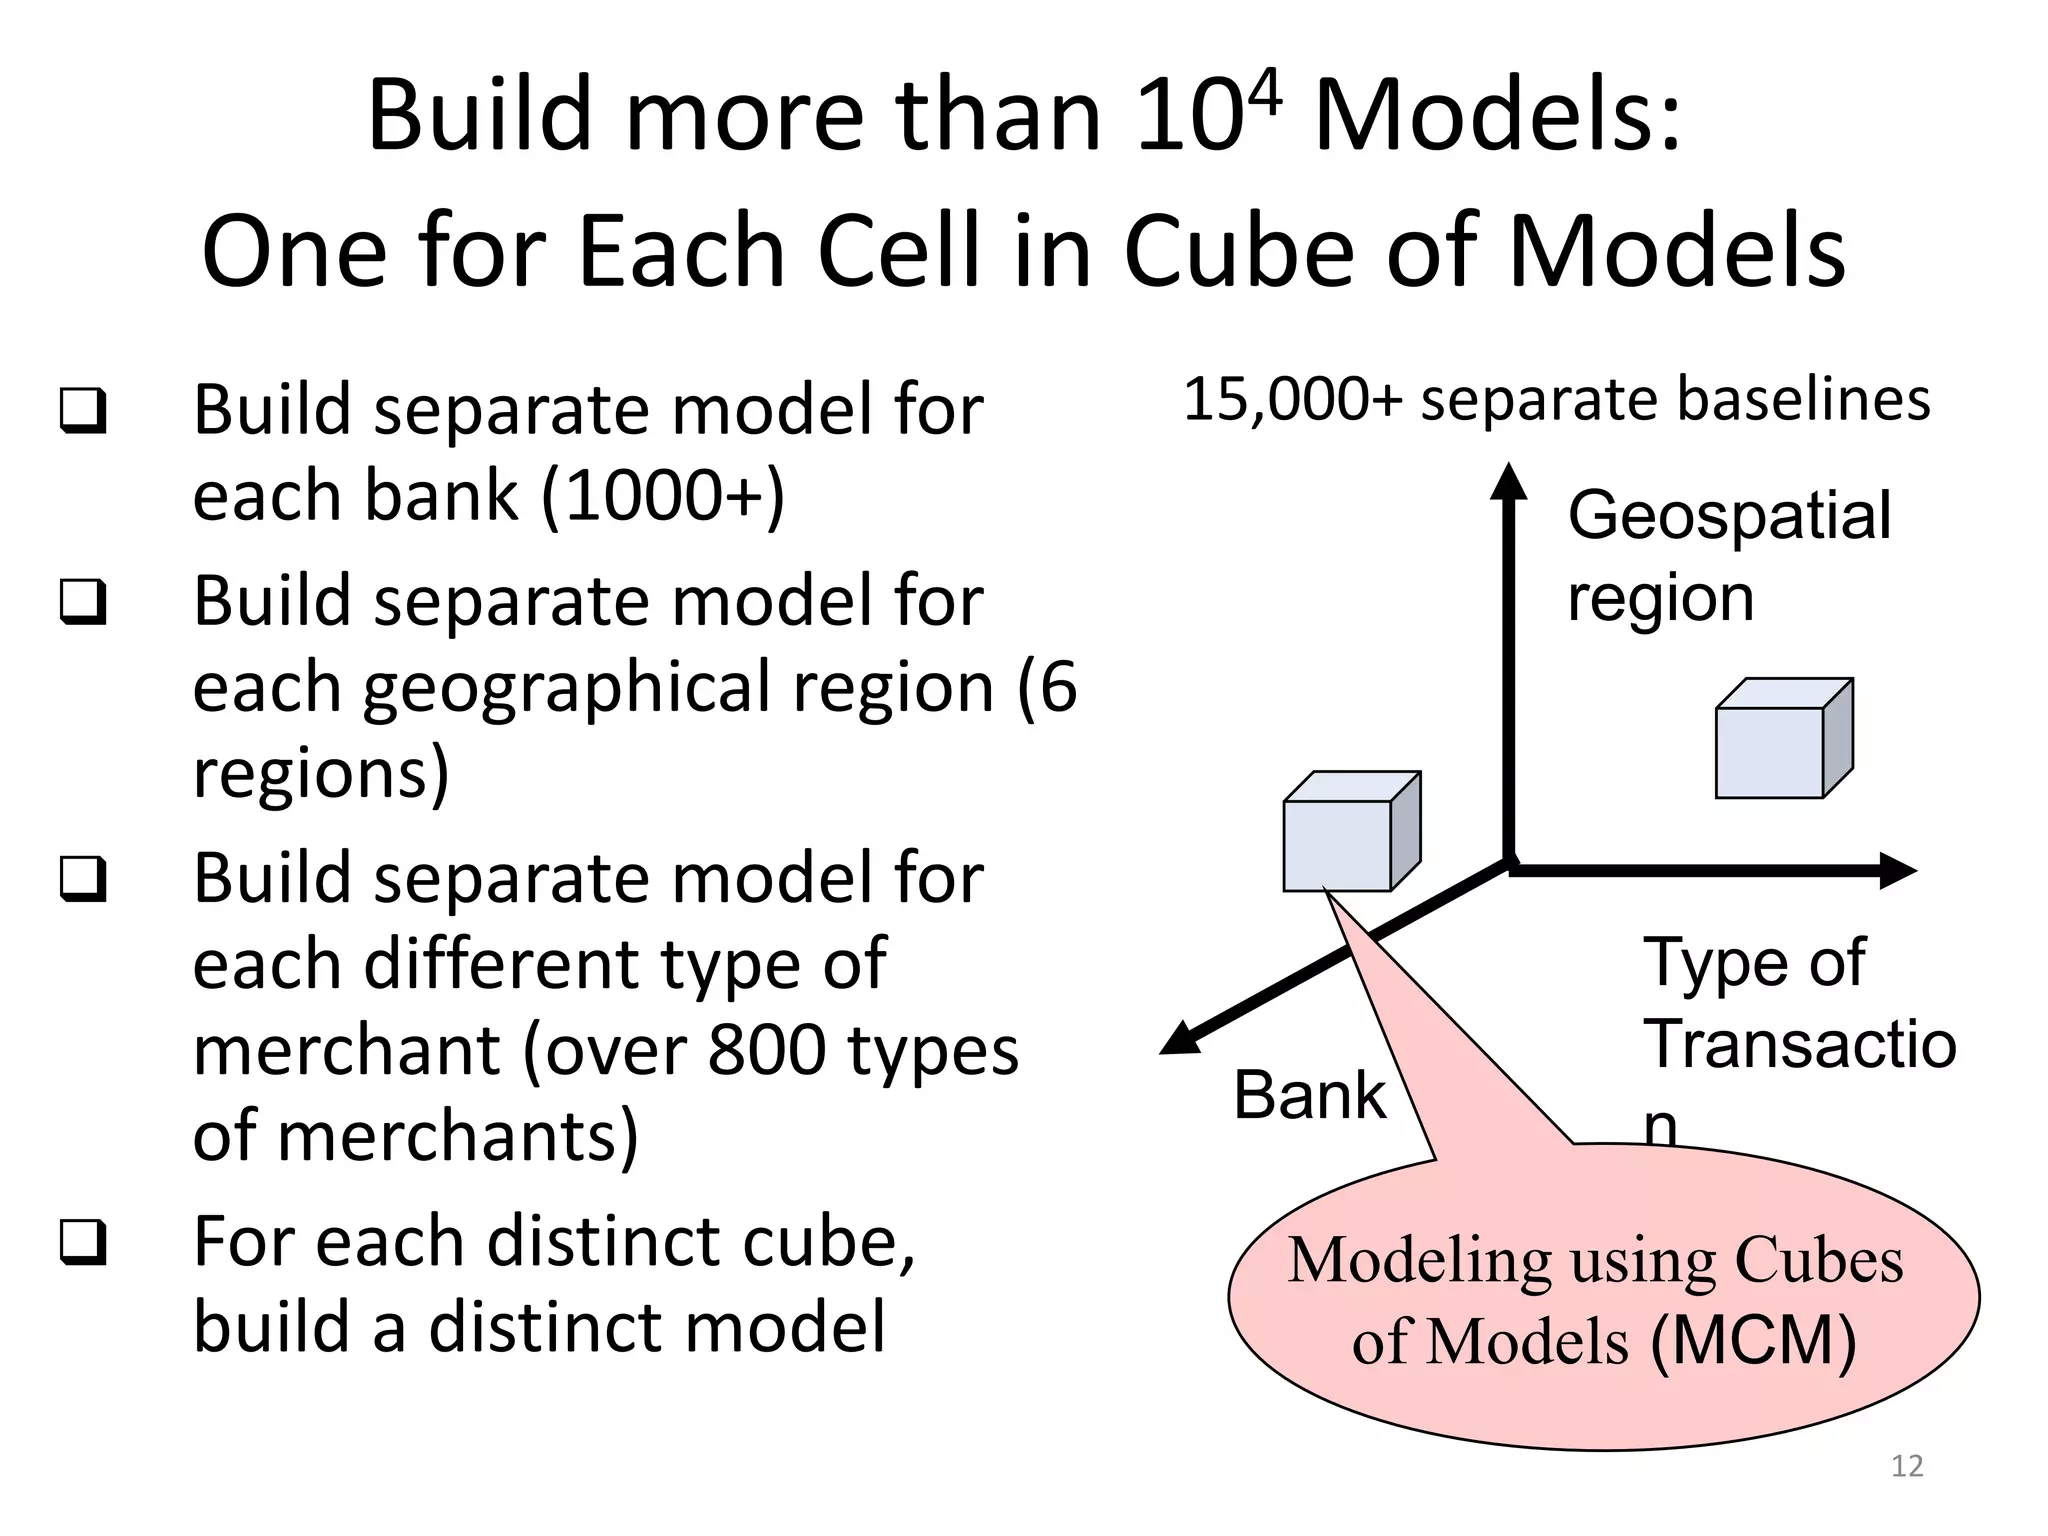
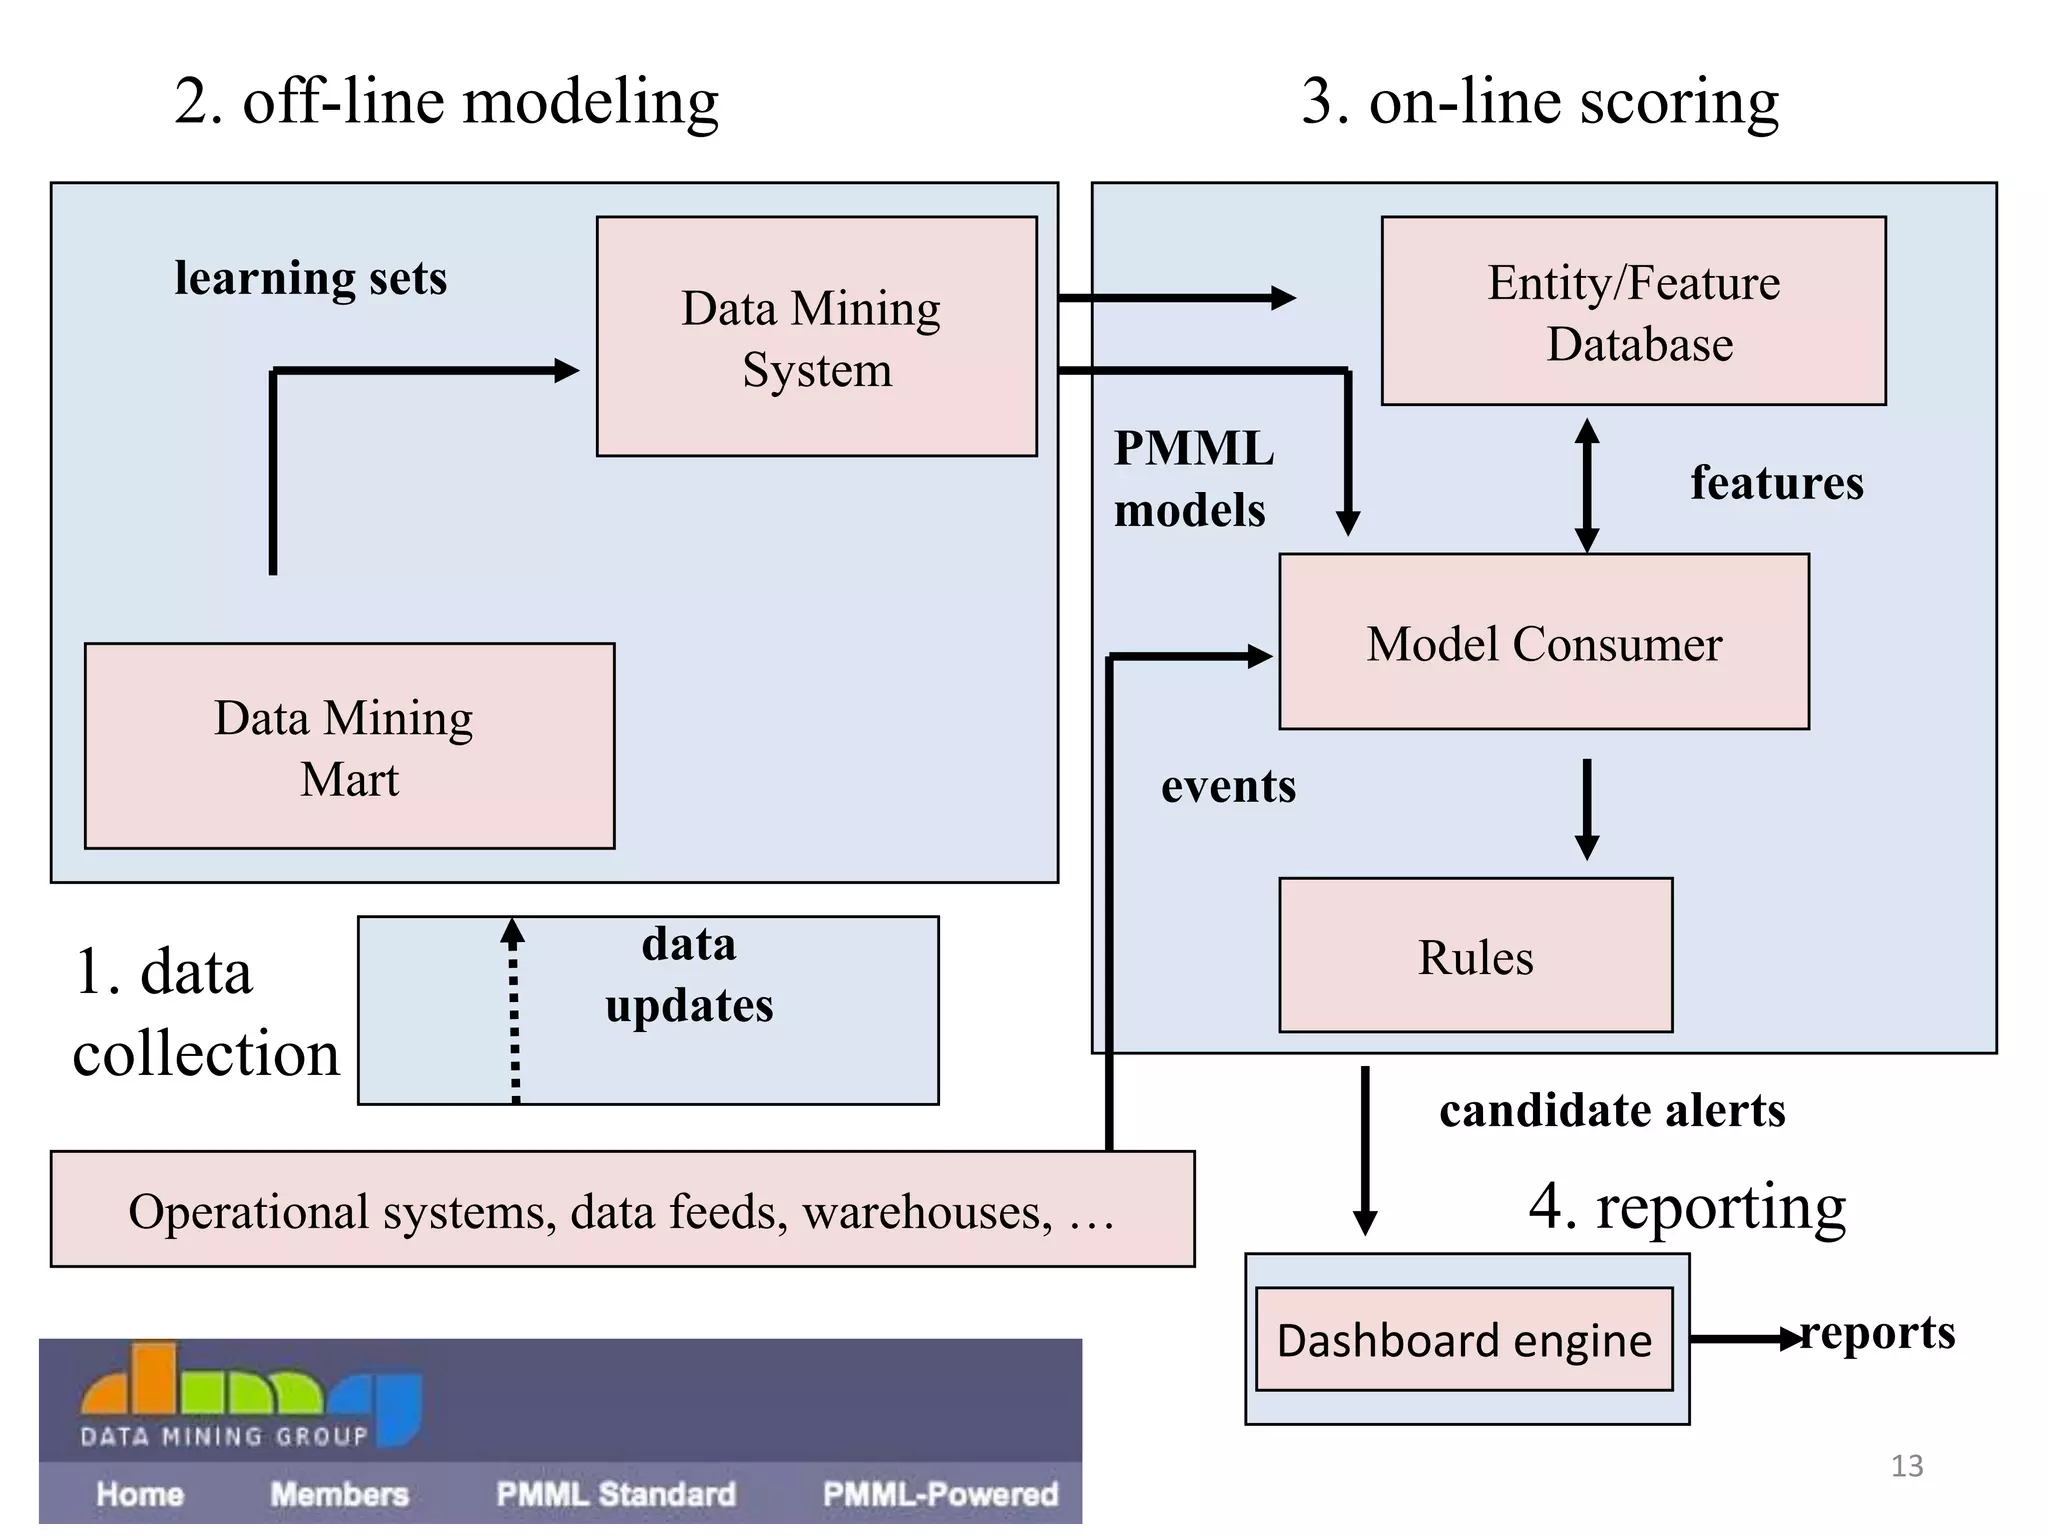
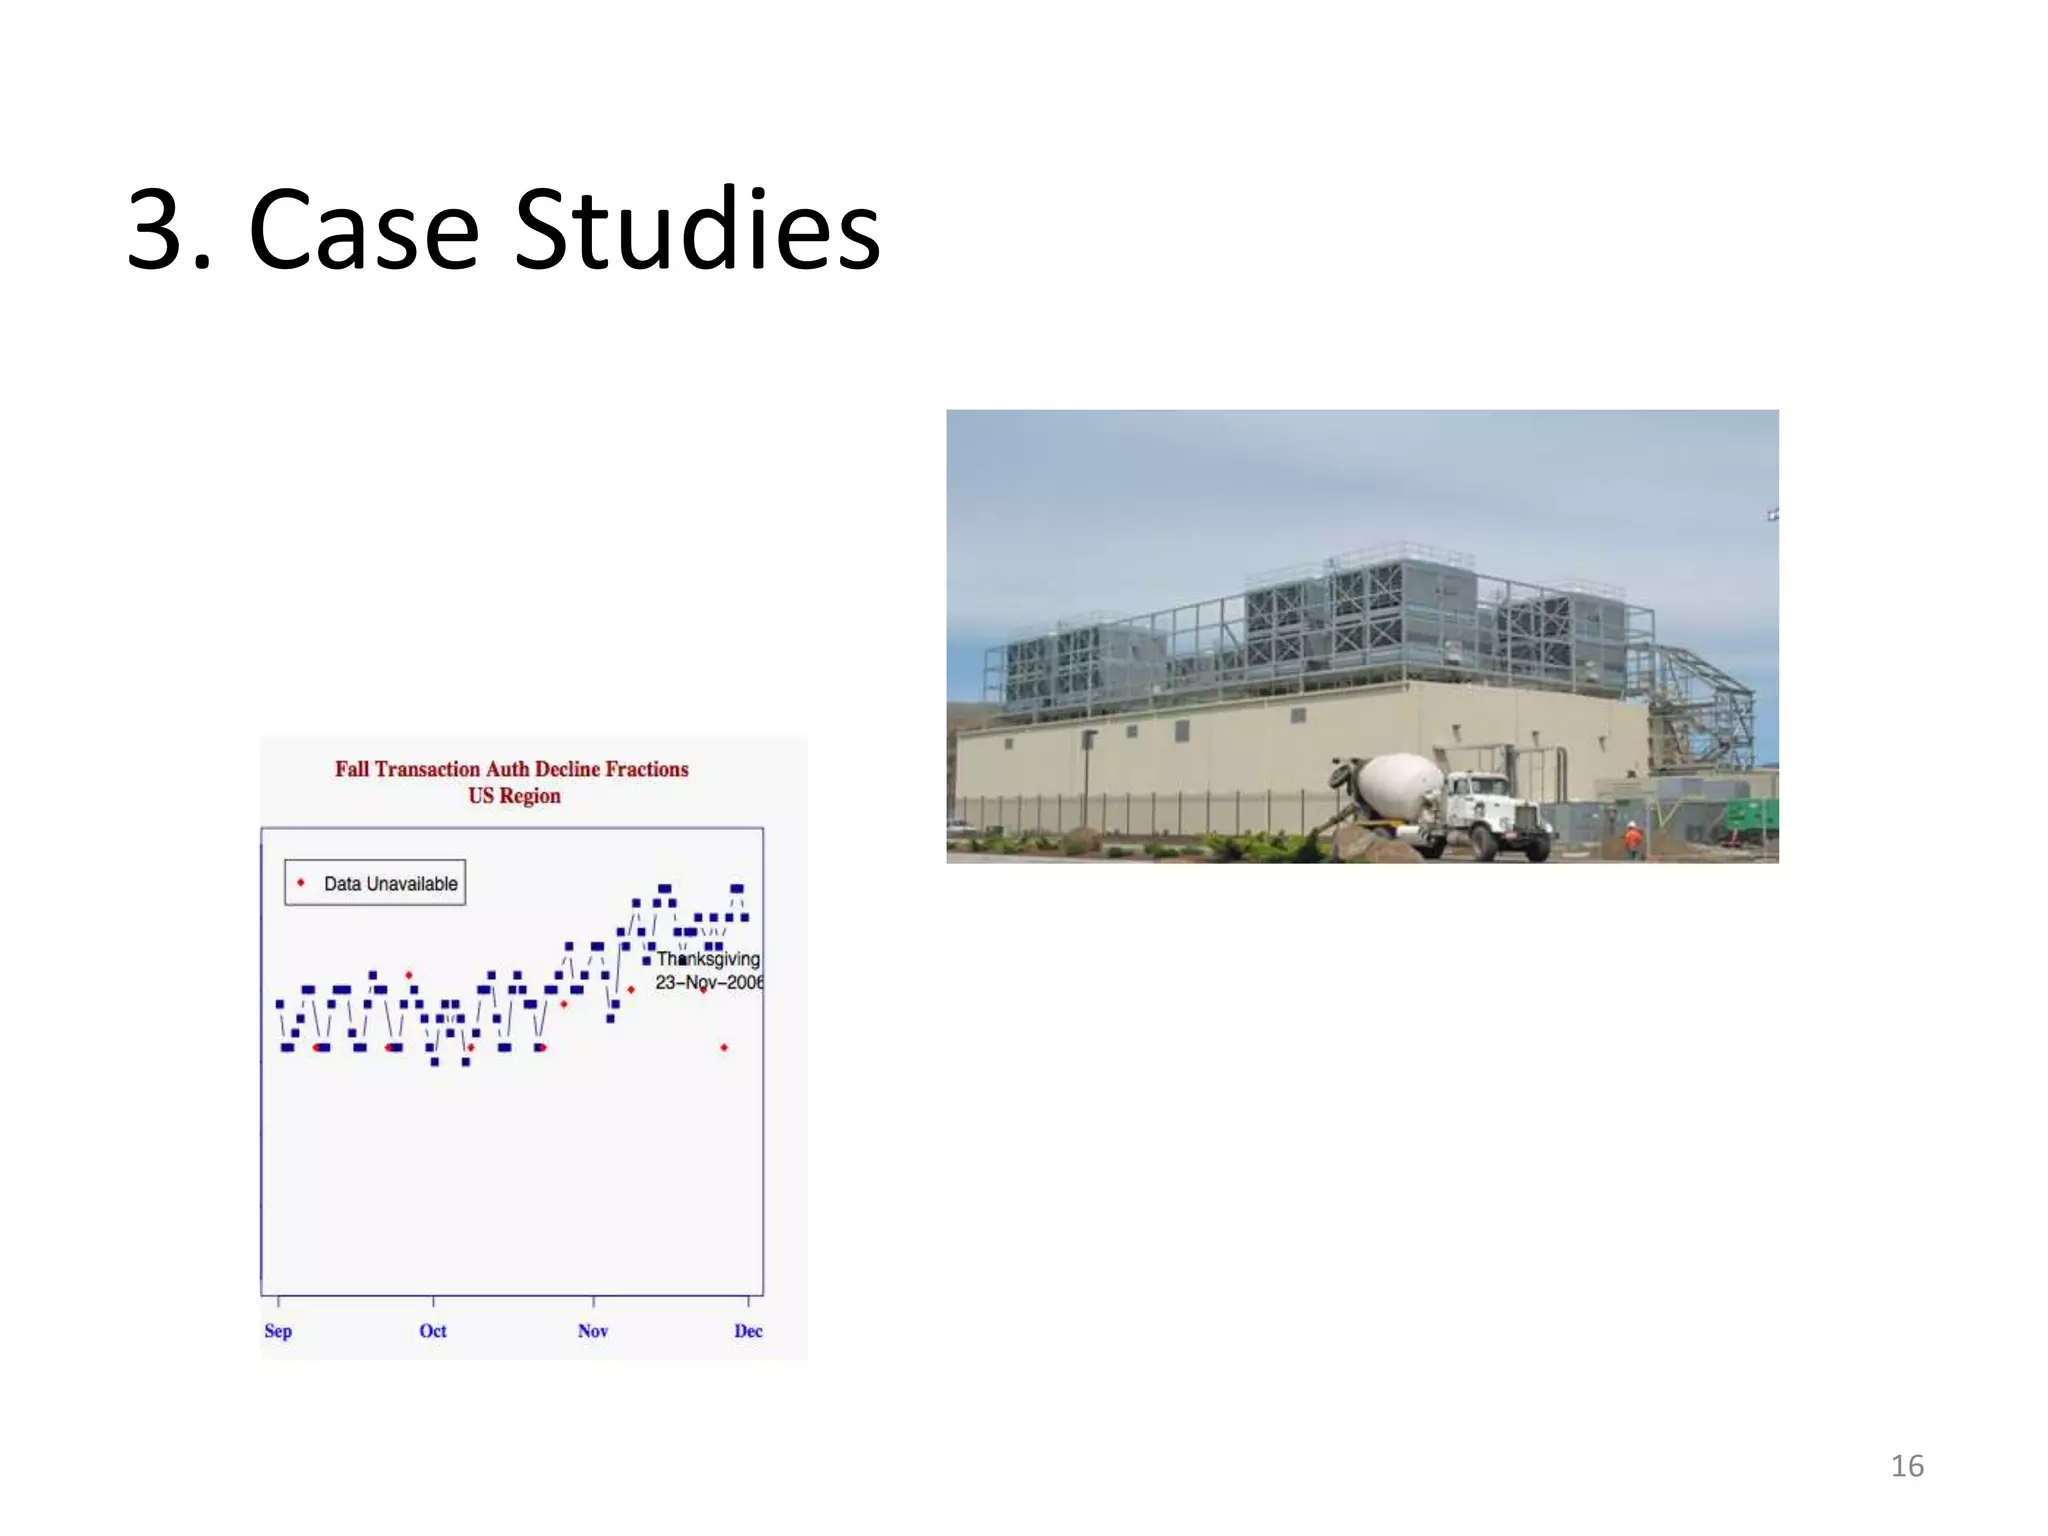
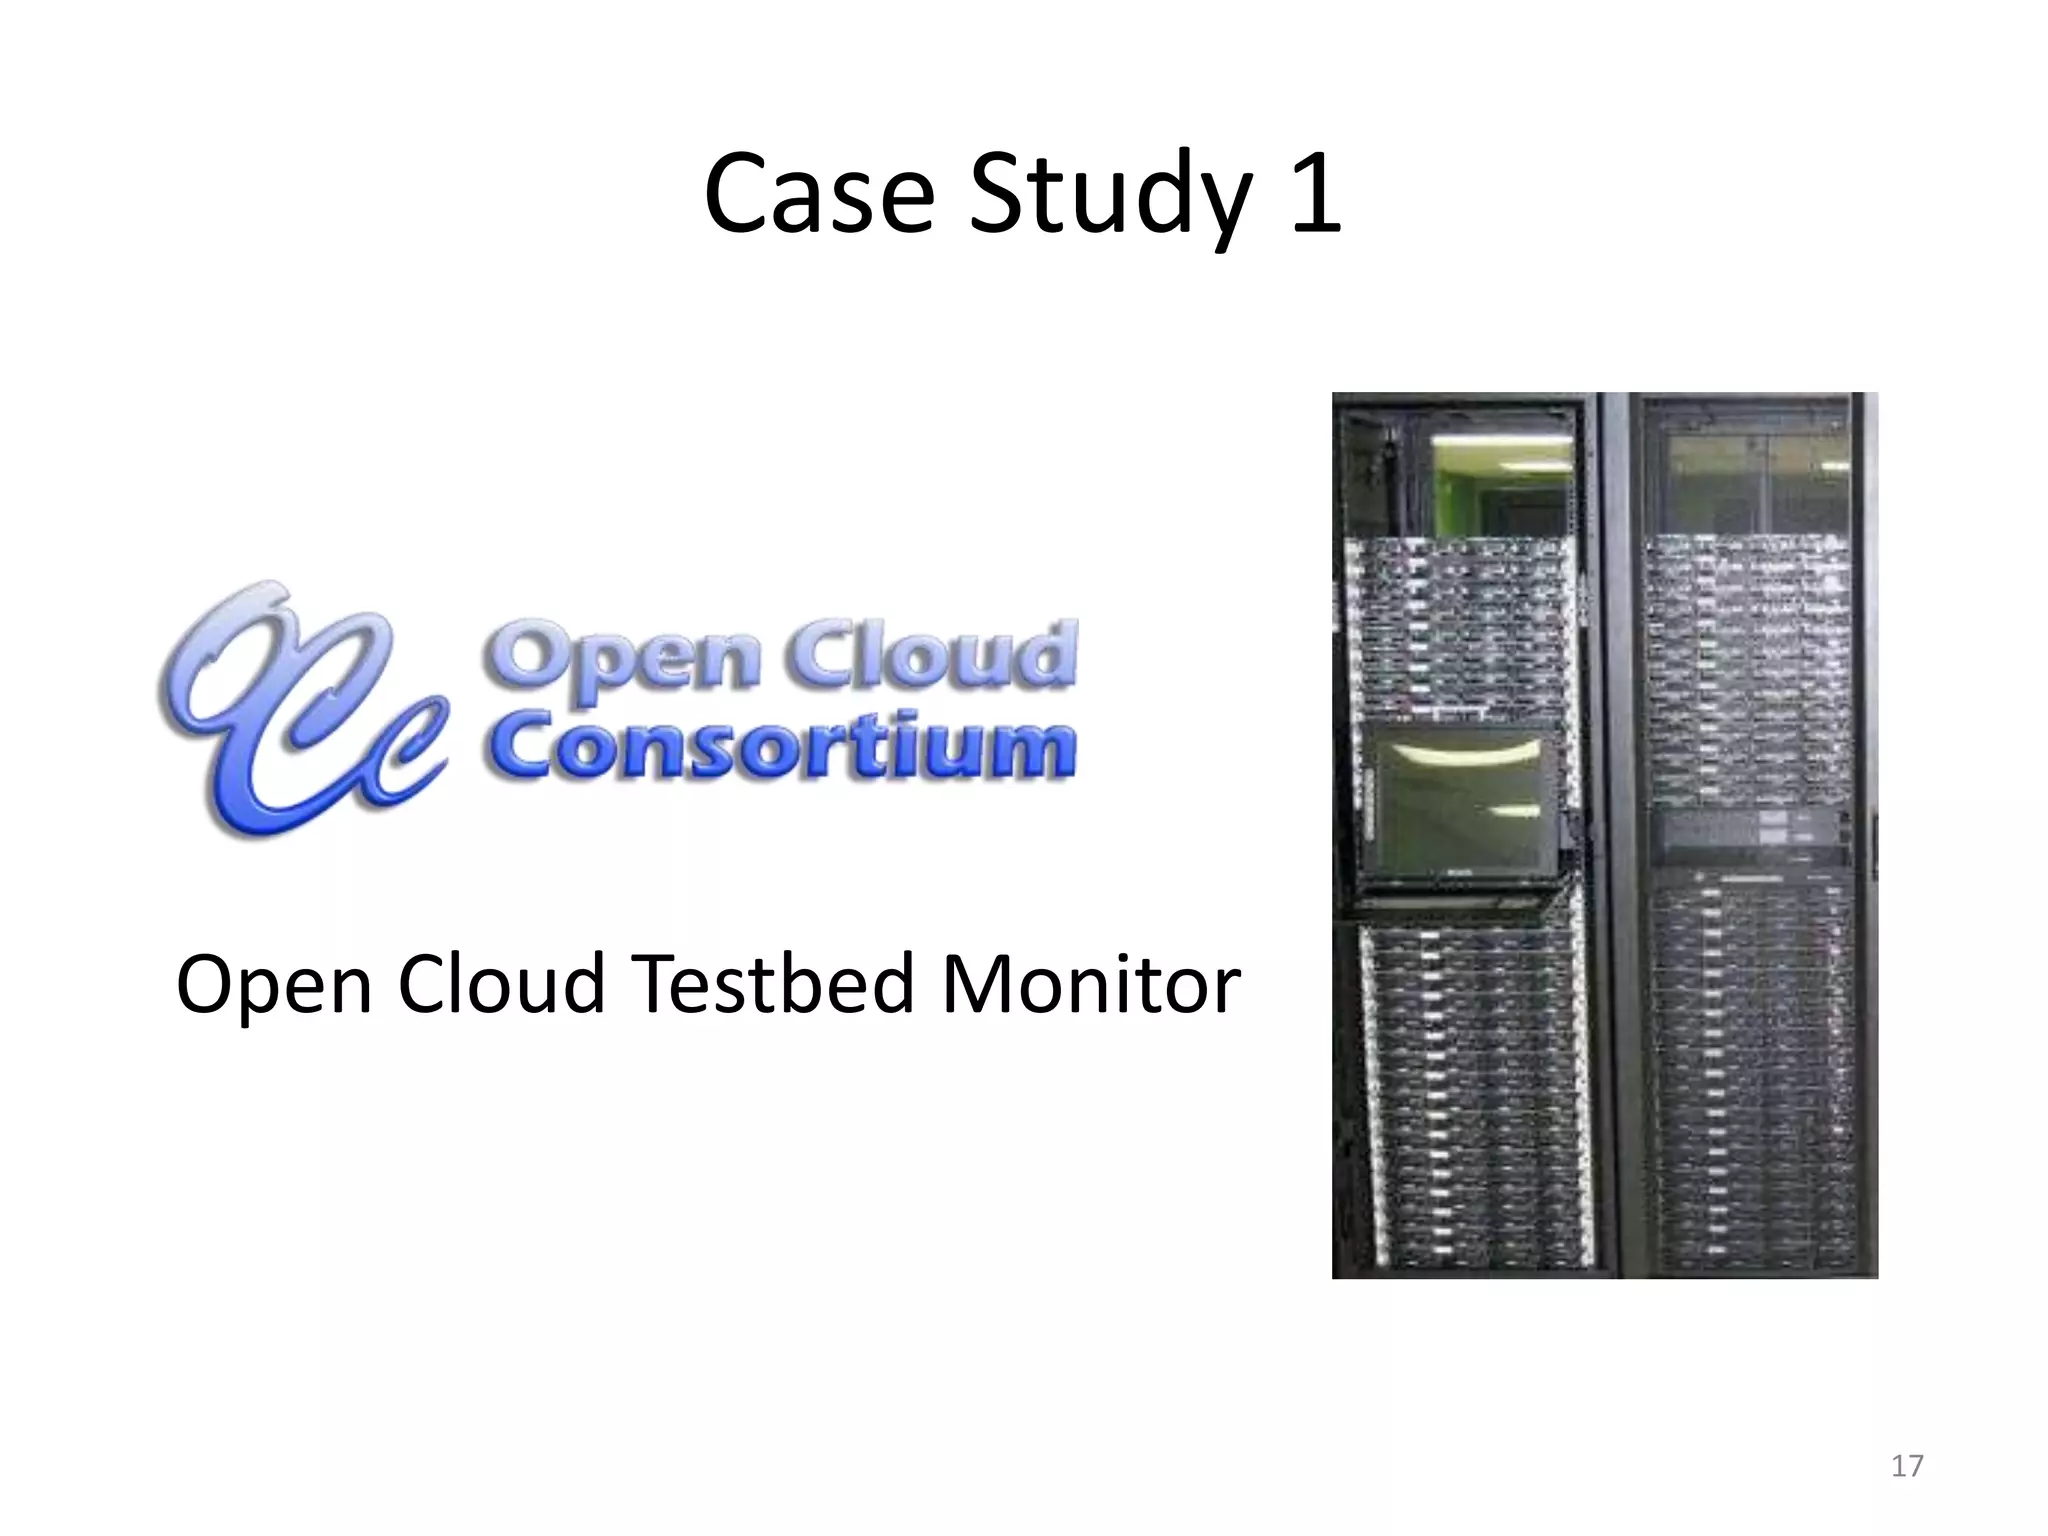
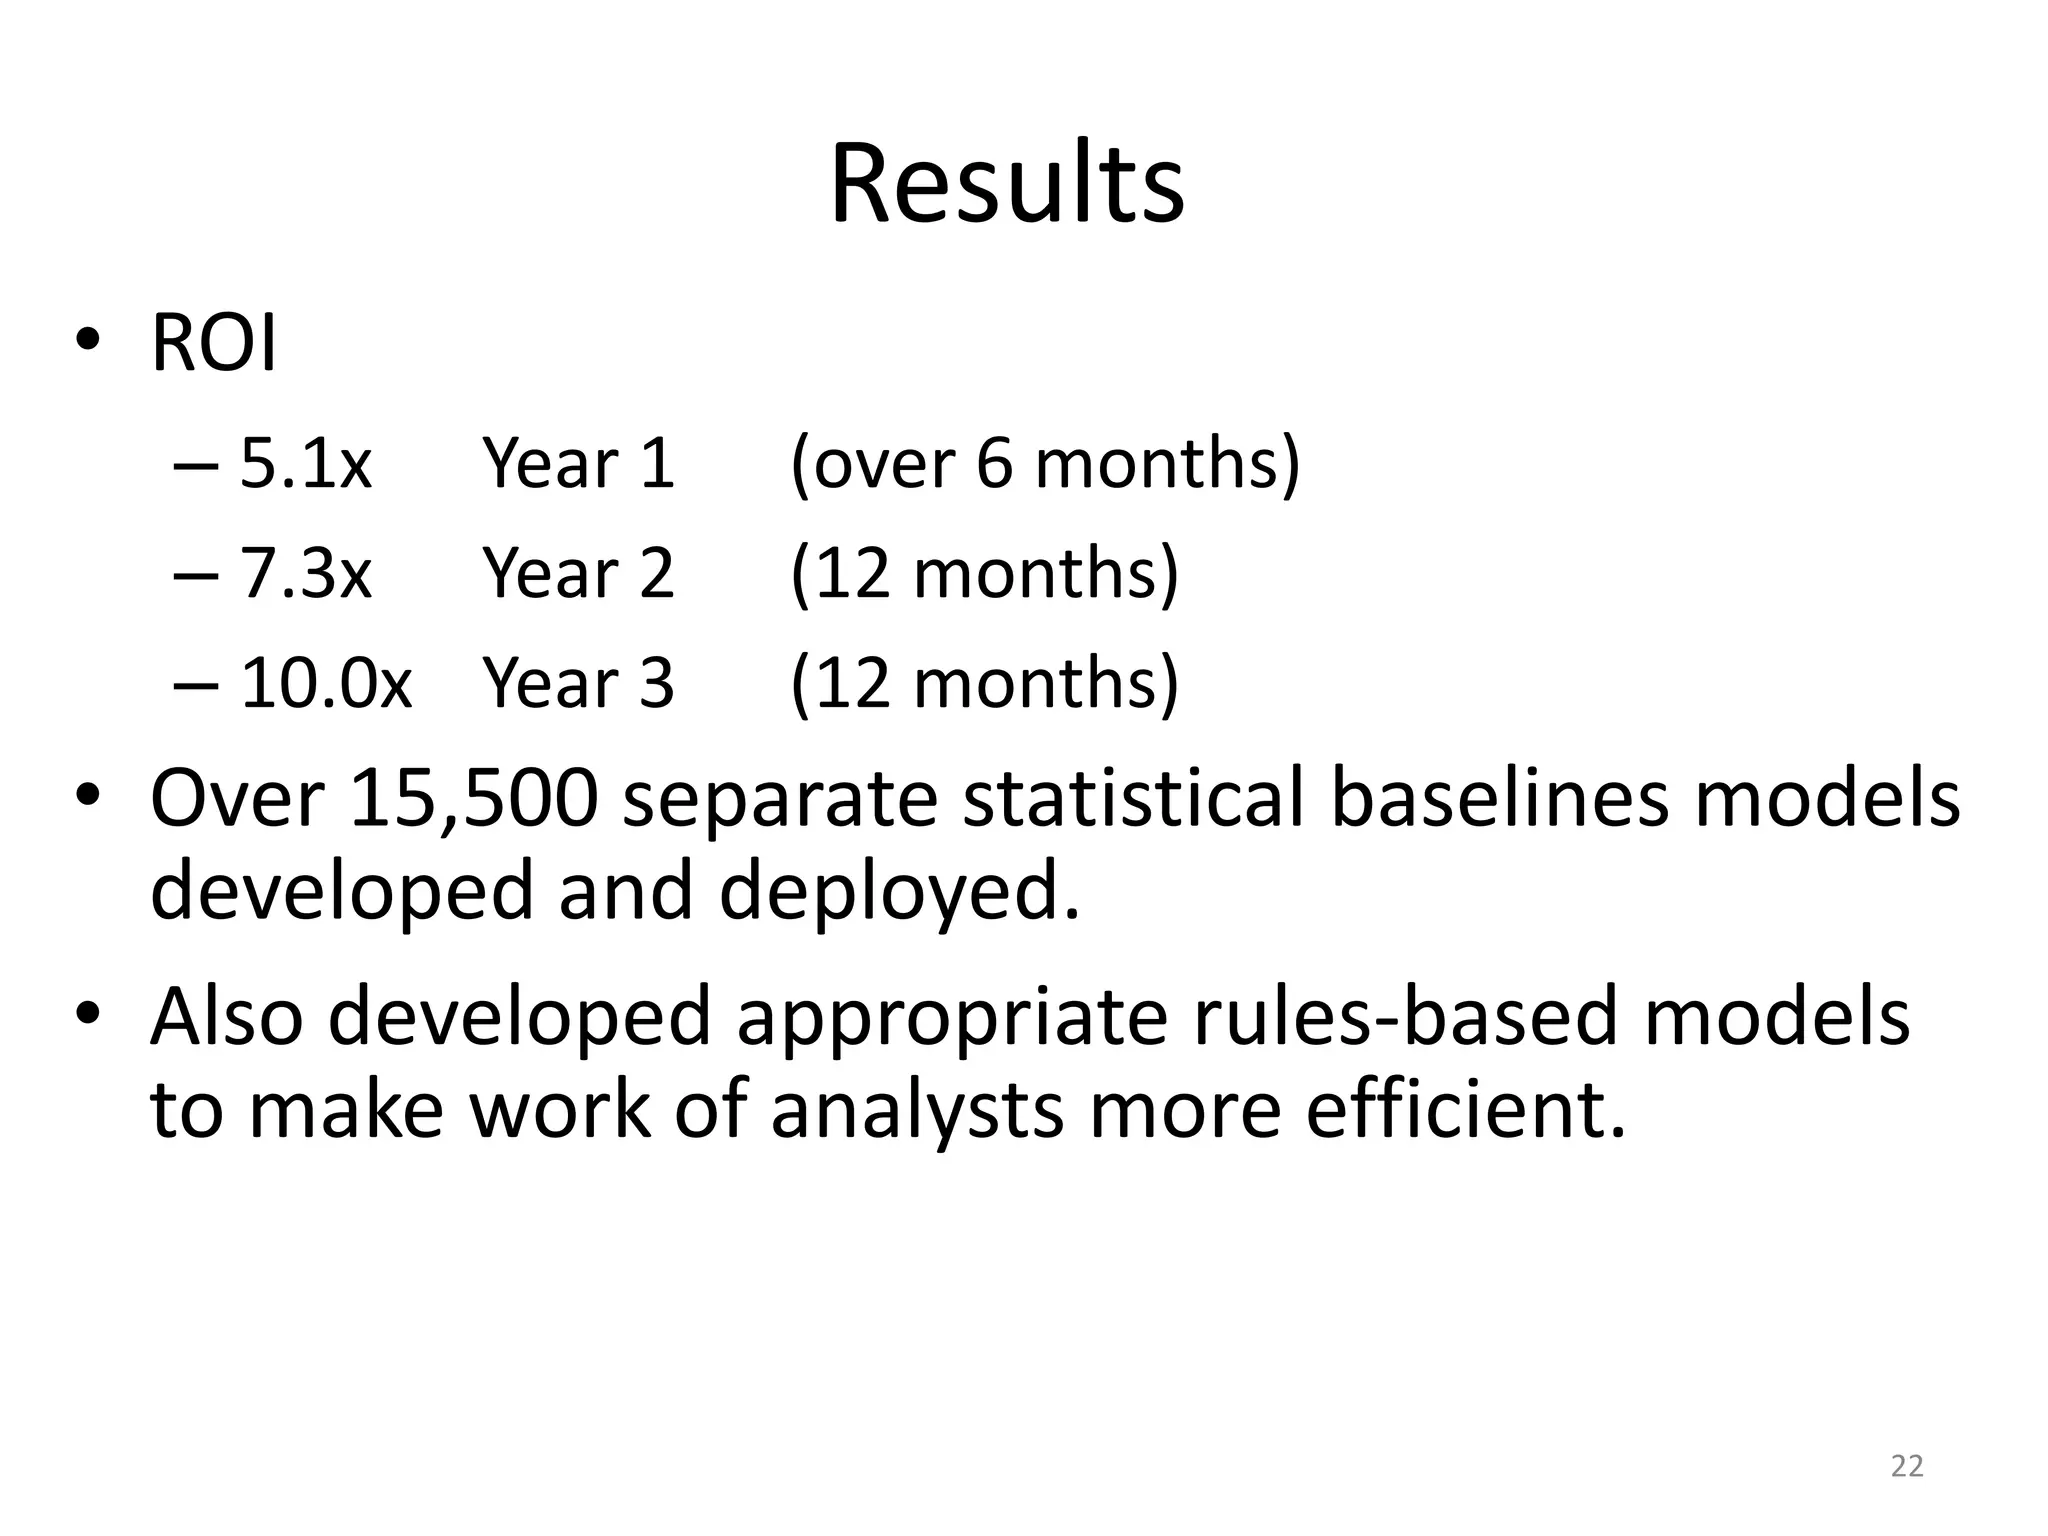
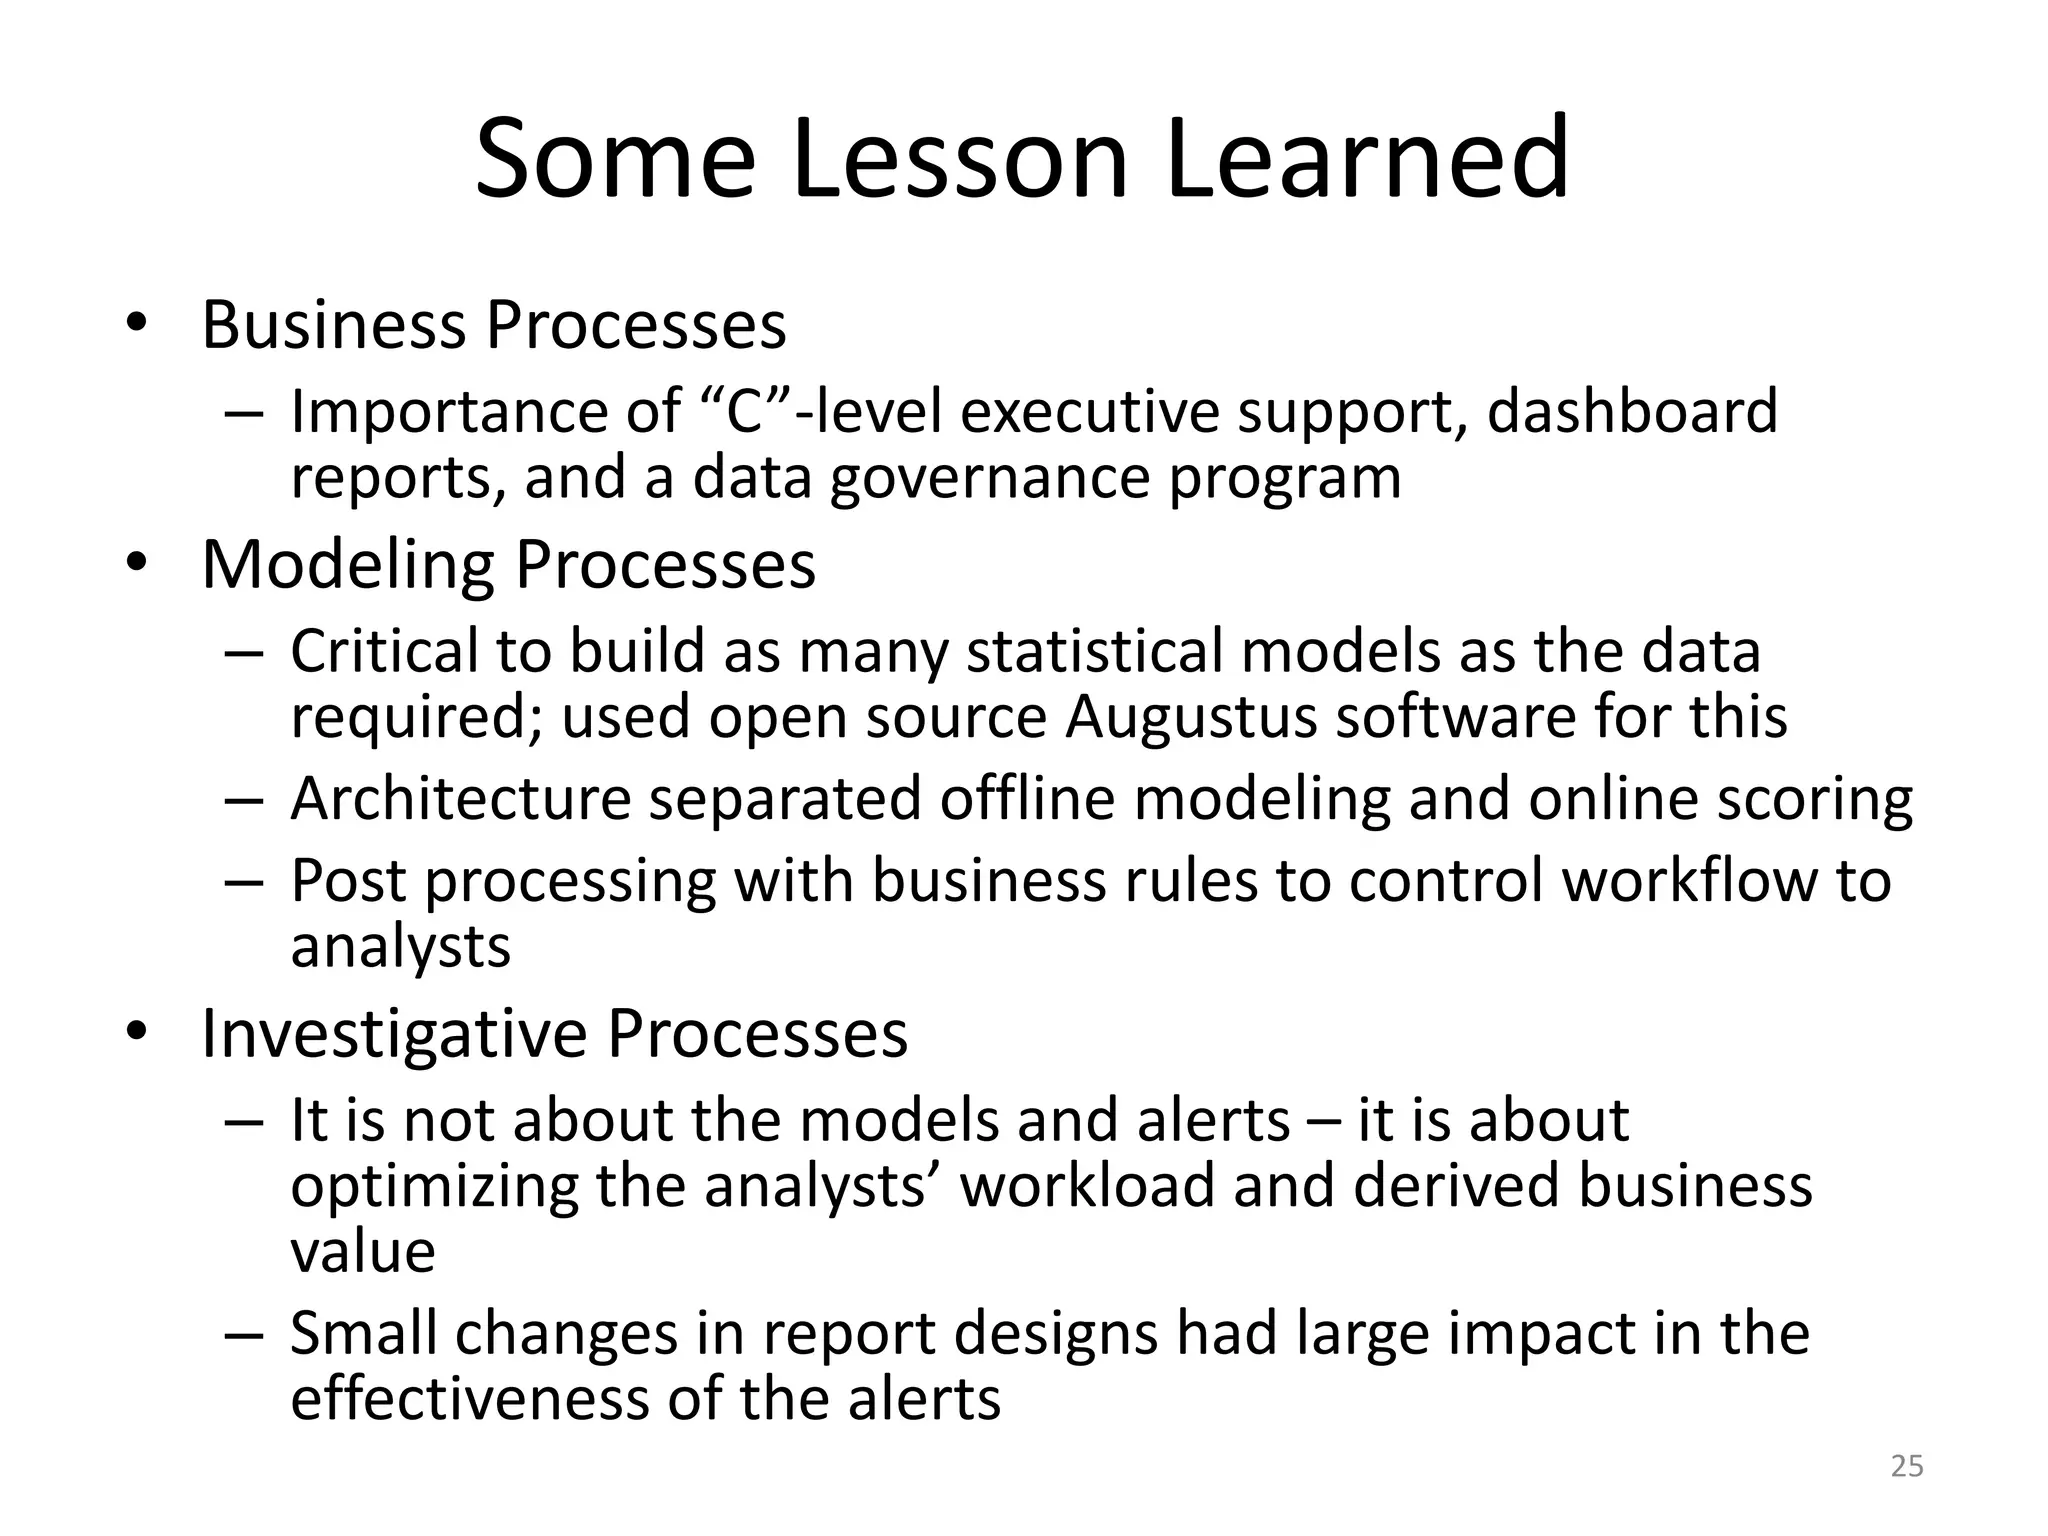
Health & Status Monitoring: Two Case StudiesRobert Grossman Open Data GroupFebruary 18, 20101
1. Introduction2
Traditional ApproachTwo types of variation:Common cause of variation (noise) occur as normal part of manufacturing processSpecial cause of variation represents a potential problem3
3 sShewhart control chart used by NIST for calibrating the standard KG.4Source: NIST
Shewhart / Deming CyclePlan – identify opportunity or problem and make a plan.Do – implement the change on a small scale and collect the data.Check – perform a statistical analysis and check if there was an impact.Act – if there was an impact, broaden the scale and continuously improve your results.5
Case Study 1.  Data CenterThousands of serversComplex workloadsLarge variations are normalProblems make the front page6
Case Study 2.  Payments NetworkBillion+ cards100+ million terminalsMillions of merchantsThousands of transactions per secondThousands of member banksData highly heterogeneousVariations among productsVariations among cardholdersVariations among merchantsVariations among banksVariation among payment networks7
The Challenge TodayMany sources and data feeds Data is complex and highly heterogeneousHigh volume, streaming data from around the worldMultiple parties involved, each of which can modify the data in subtle ways8
Health & Status Monitoring Systems9
2. The Technology10
11Observed ModelBaseline ModelCUSUM modelsGLR models
Build more than 104 Models: One for Each Cell in Cube of Models15,000+ separate baselines Build separate model for each bank (1000+)
Build separate model for each geographical region (6 regions)
Build separate model for each different type of merchant (over 800 types of merchants)
For each distinct cube, build a distinct modelGeospatialregionType of TransactionBankModeling using Cubes of Models (MCM)12
learning setsdata updates1. data collection3. on-line scoring2. off-line modelingEntity/Feature DatabaseData Mining SystemPMMLmodelsfeaturesModel ConsumerData Mining MarteventsRulescandidate alertsOperational systems, data feeds, warehouses, …4. reportingDashboard enginereports13
AugustusAugustus is an open source data mining platform:Used to estimate baselines for over 15,000 separate segmented modelsUsed to score high volume operational data and issue alerts for follow up investigations  Augustus is PMML compliant Augustus scales withVolume of dataReal time transaction streams (15,000/sec+)Number of segmented models (10,000+) 14
Greedy Meaningful/Manageable Balancing (GMMB) AlgorithmBreakpoint More alerts
 Alerts more meaningful
 To increase alerts, add breakpoint to split cubes,order by number of new alerts, &  select one or more new breakpoints
Fewer alerts
 Alerts more manageable
To decrease alerts, remove breakpoint,order by number of decreased alerts,  & select one or more breakpoints to removeOne model for each cell in data cube15
3. Case Studies16
Case Study 1Open Cloud Testbed Monitor17
ResultsDozens of separate statistical baselines models developed and deployed.Effective for discovering nodes that are hindering effective use of OCC’s large data cloud.Dead nodes are easy to identify and remove.Removing just one or two “slow” nodes from a pool of 100 nodes can improve overall performance by 15% - 20+%.18
Dashboard19
Case Study 2AccountIssuing BankPayments NetworkMerchantAcquiring Bank20

Health & Status Monitoring (2010-v8)

  • 1.
    Health & StatusMonitoring: Two Case StudiesRobert Grossman Open Data GroupFebruary 18, 20101
  • 2.
  • 3.
    Traditional ApproachTwo typesof variation:Common cause of variation (noise) occur as normal part of manufacturing processSpecial cause of variation represents a potential problem3
  • 4.
    3 sShewhart controlchart used by NIST for calibrating the standard KG.4Source: NIST
  • 5.
    Shewhart / DemingCyclePlan – identify opportunity or problem and make a plan.Do – implement the change on a small scale and collect the data.Check – perform a statistical analysis and check if there was an impact.Act – if there was an impact, broaden the scale and continuously improve your results.5
  • 6.
    Case Study 1. Data CenterThousands of serversComplex workloadsLarge variations are normalProblems make the front page6
  • 7.
    Case Study 2. Payments NetworkBillion+ cards100+ million terminalsMillions of merchantsThousands of transactions per secondThousands of member banksData highly heterogeneousVariations among productsVariations among cardholdersVariations among merchantsVariations among banksVariation among payment networks7
  • 8.
    The Challenge TodayManysources and data feeds Data is complex and highly heterogeneousHigh volume, streaming data from around the worldMultiple parties involved, each of which can modify the data in subtle ways8
  • 9.
    Health & StatusMonitoring Systems9
  • 10.
  • 11.
  • 12.
    Build more than104 Models: One for Each Cell in Cube of Models15,000+ separate baselines Build separate model for each bank (1000+)
  • 13.
    Build separate modelfor each geographical region (6 regions)
  • 14.
    Build separate modelfor each different type of merchant (over 800 types of merchants)
  • 15.
    For each distinctcube, build a distinct modelGeospatialregionType of TransactionBankModeling using Cubes of Models (MCM)12
  • 16.
    learning setsdata updates1.data collection3. on-line scoring2. off-line modelingEntity/Feature DatabaseData Mining SystemPMMLmodelsfeaturesModel ConsumerData Mining MarteventsRulescandidate alertsOperational systems, data feeds, warehouses, …4. reportingDashboard enginereports13
  • 17.
    AugustusAugustus is anopen source data mining platform:Used to estimate baselines for over 15,000 separate segmented modelsUsed to score high volume operational data and issue alerts for follow up investigations Augustus is PMML compliant Augustus scales withVolume of dataReal time transaction streams (15,000/sec+)Number of segmented models (10,000+) 14
  • 18.
    Greedy Meaningful/Manageable Balancing(GMMB) AlgorithmBreakpoint More alerts
  • 19.
    Alerts moremeaningful
  • 20.
    To increasealerts, add breakpoint to split cubes,order by number of new alerts, & select one or more new breakpoints
  • 21.
  • 22.
    Alerts moremanageable
  • 23.
    To decrease alerts,remove breakpoint,order by number of decreased alerts, & select one or more breakpoints to removeOne model for each cell in data cube15
  • 24.
  • 25.
    Case Study 1OpenCloud Testbed Monitor17
  • 26.
    ResultsDozens of separatestatistical baselines models developed and deployed.Effective for discovering nodes that are hindering effective use of OCC’s large data cloud.Dead nodes are easy to identify and remove.Removing just one or two “slow” nodes from a pool of 100 nodes can improve overall performance by 15% - 20+%.18
  • 27.
  • 28.
    Case Study 2AccountIssuingBankPayments NetworkMerchantAcquiring Bank20
  • 29.
    Program StructureStrategic objectiveidentified early: “Identify and ameliorate data interoperability issues to improve the approval rate of valid transactions and the disapproval rate of invalid transactions, ...”Report quarterly to CIOs’ council with third-party endorsed monetary benefits summarized on an executive dash boardIntroduced data governance program early in projectDeveloped payment transaction monitor that produced candidate alertsSet up investigation process to screen alerts and investigate those of interestDeveloped reference models and appropriate standards21
  • 30.
    ResultsROI5.1x Year 1 (over 6months)7.3x Year 2 (12 months)10.0x Year 3 (12 months)Over 15,500 separate statistical baselines models developed and deployed.Also developed appropriate rules-based models to make work of analysts more efficient.22
  • 31.
  • 32.
    Business ProcessStrategic ObjectiveDashboardGovernanceModelingProcessReference ModelInvestigative ProcessMonitor - produces candidate alertsInvestigativeProcesscandidate alertseventsprogram alerts24
  • 33.
    Some Lesson LearnedBusinessProcessesImportance of “C”-level executive support, dashboard reports, and a data governance programModeling ProcessesCritical to build as many statistical models as the data required; used open source Augustus software for thisArchitecture separated offline modeling and online scoringPost processing with business rules to control workflow to analystsInvestigative ProcessesIt is not about the models and alerts – it is about optimizing the analysts’ workload and derived business valueSmall changes in report designs had large impact in the effectiveness of the alerts25
  • 34.
  • 35.
    For More InformationLearnabout Health and status monitoringOpen Data Group
  • 36.
  • 37.
    ReferencesJoseph Bugajski, ChrisCurry, Robert L. Grossman, David Locke, Steve Vejcik, Detecting Changes in Large Data Sets of Payment Card Data: A Case Study, Proceedings of The Thirteenth ACM SIGKDD International Conference on Knowledge Discovery and Data Mining (KDD 2007), ACM, 2007Joseph Bugajski and Robert L. Grossman, An Alert Management Approach to Data Quality: Lessons Learned from the Visa Data Authority Program, Proceedings of the 12th International Conference on Information Quality, (ICIQ 2007).Walter A. Shewhart, Statistical Method from the Viewpoint of Quality Control, Dover, 1986.H. Vincent Poor and Olympia Hadjiliadis, Quickest Detection, Cambridge University Press, 2009.Augustus is an open source system available from augustus.googlecode.com.28