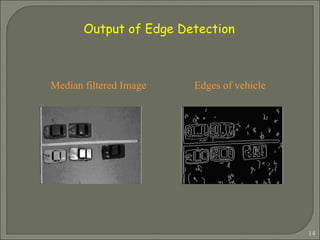
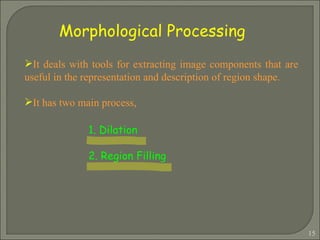
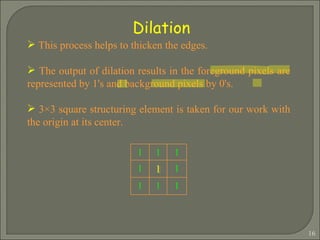
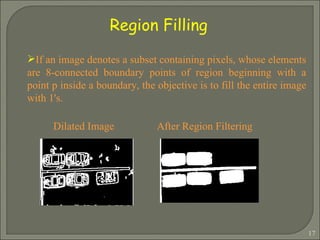
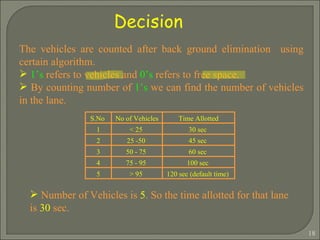
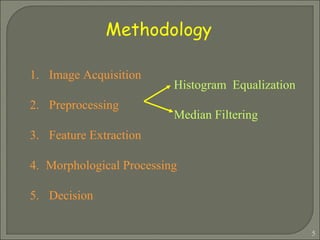
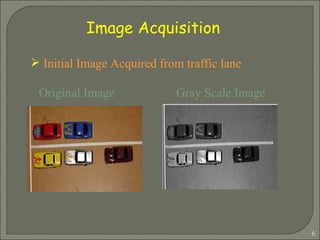
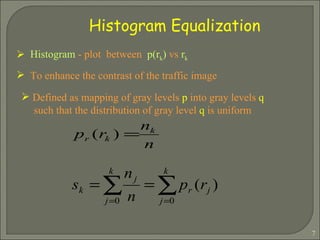
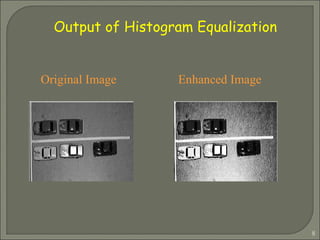
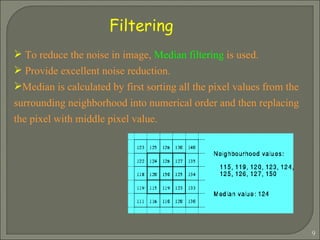
The document presents a vision-based traffic surveillance system that uses digital image processing techniques. The system works to improve image quality by enhancing contrast and removing noise and blurring. It then uses edge detection and morphological processing to segment vehicles. The number of vehicles in each lane is counted and used to determine the time allotted for that lane, with accuracy of 90% compared to existing systems.
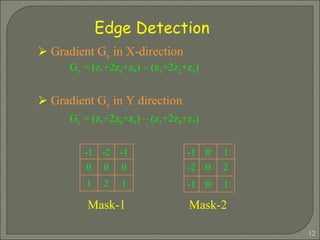
![Gradient of an image f(x,y) at location (x,y) is defined as the vector M = [G 2 x + G 2 y] ½ The direction of the gradient vector of an image f(x, y) at location (x,y) is given as α (x,y) = tan -1 [Gy / Gx] Cont..](https://image.slidesharecdn.com/visionppt-1271468344003-phpapp02/85/Vision-Based-Traffic-Surveillance-System-13-320.jpg)