Downloaded 910 times


The document analyzes the business and financial performance of Panasonic and Sony over the period of 2008 to 2011. It includes sections on information gathering, accounting techniques used, and an analysis of the companies' financial performance based on ratios calculated from income statements, balance sheets, and cash flow statements. Key metrics examined include profitability, asset utilization, working capital, debt levels, and changes in owners' equity. The analysis provides a comparison of the financial positions and performance trends of the two electronics companies over the three-year period.
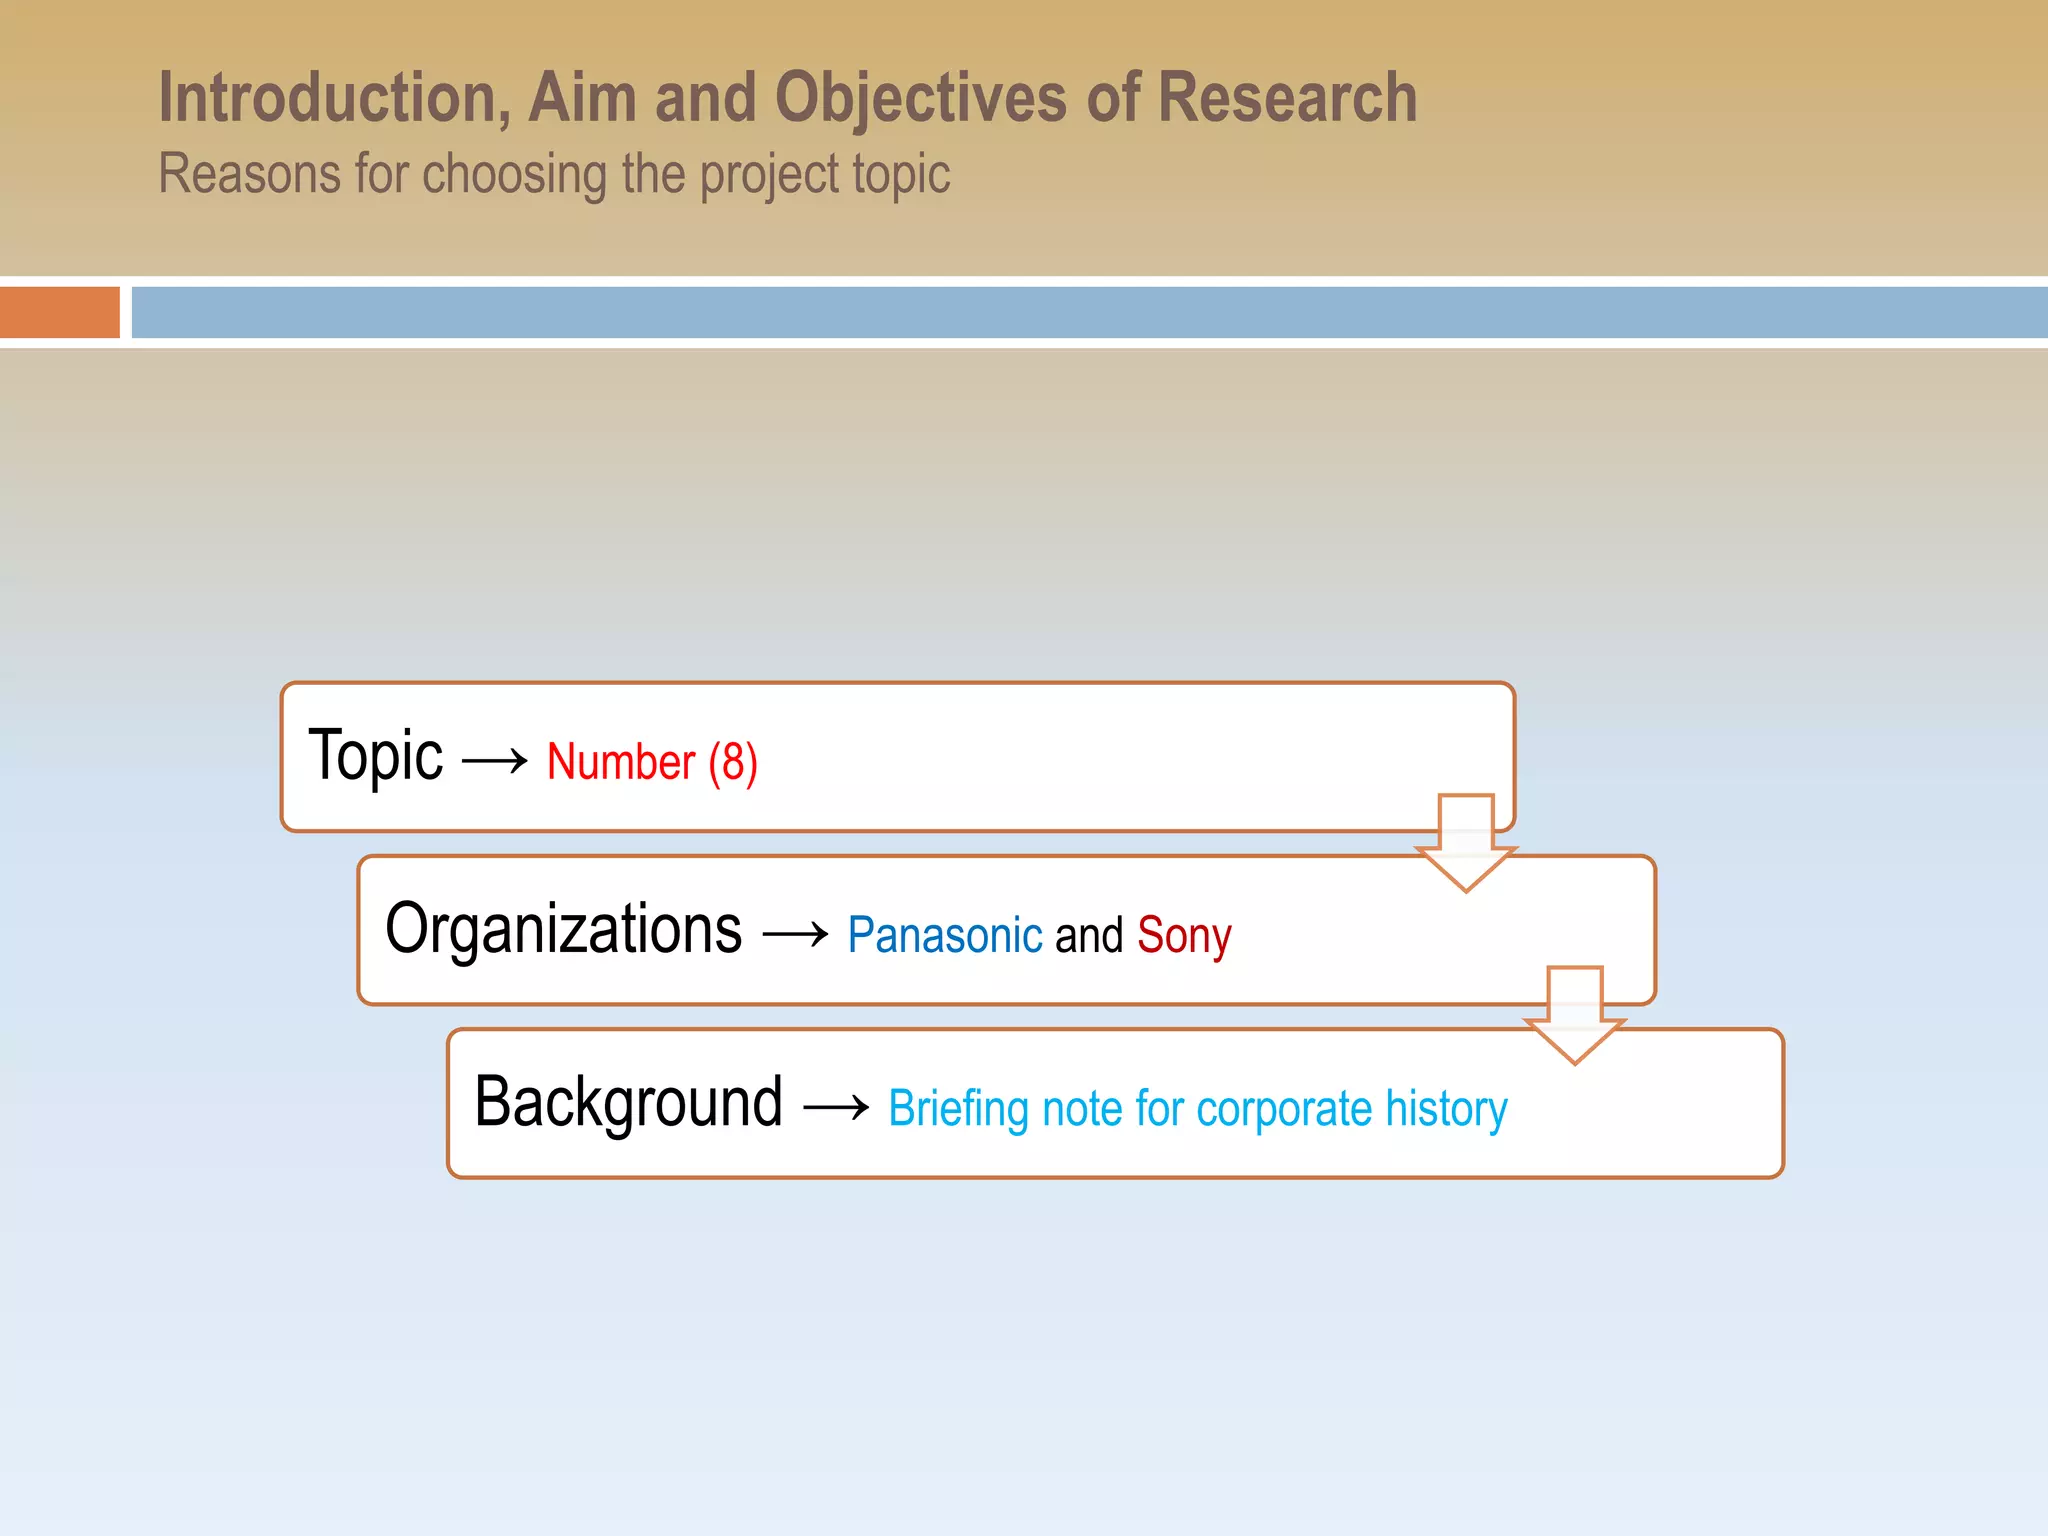
Introduction to the business and financial performance focusing on Panasonic and Sony for the given period.
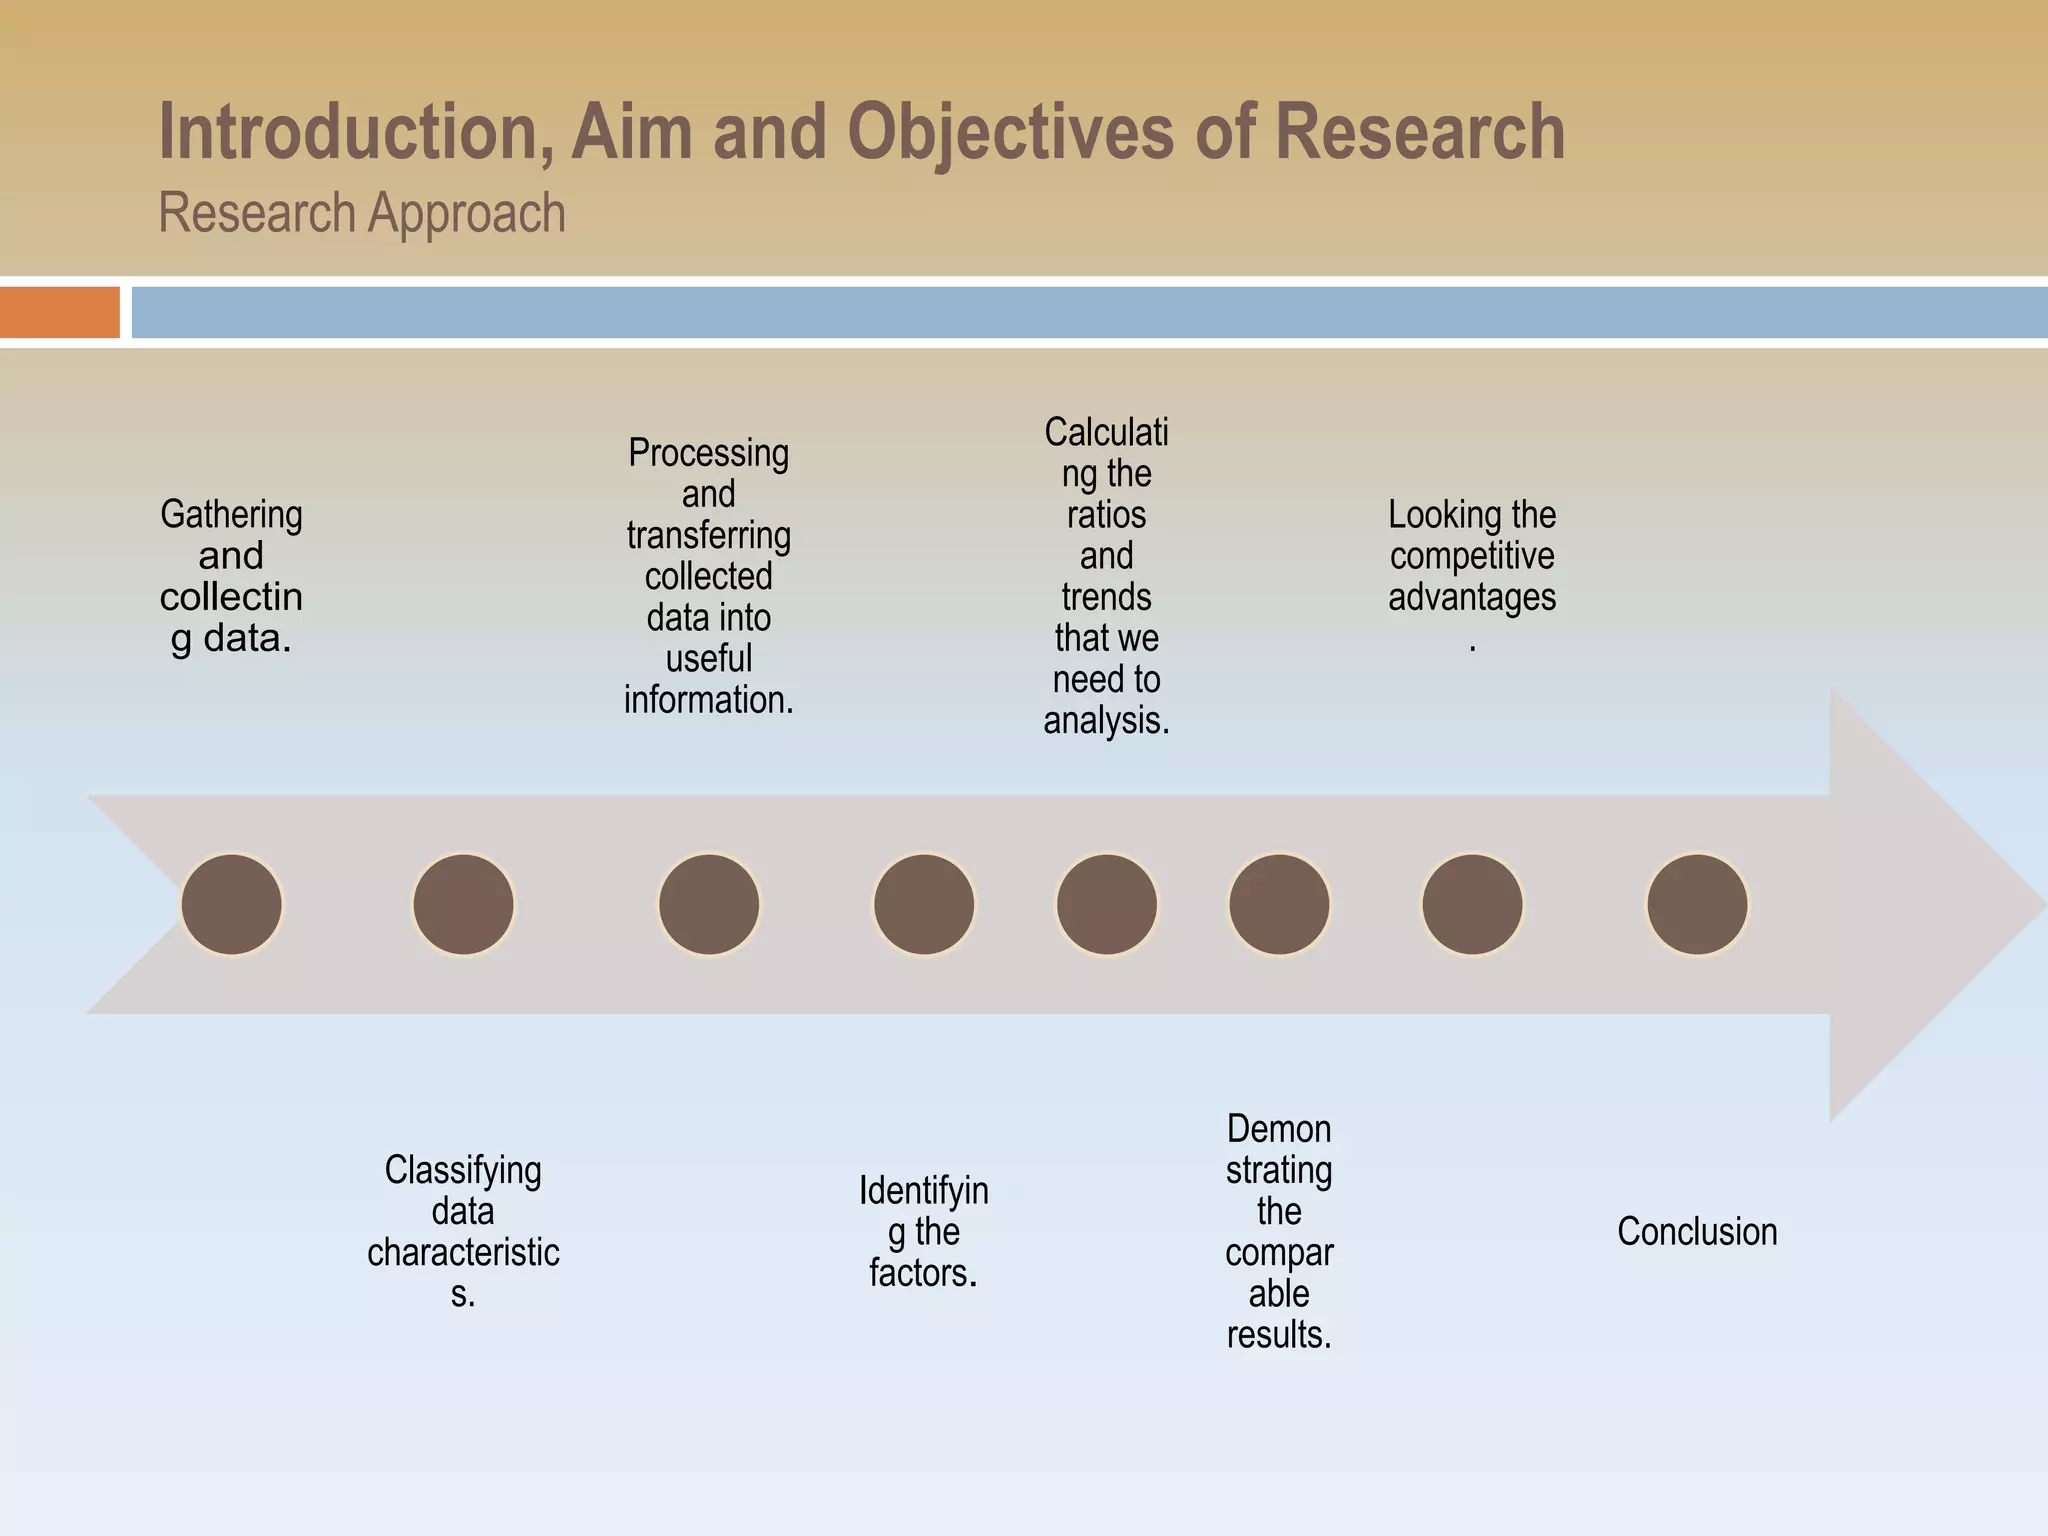
Outline of the research including introduction, objectives, methodologies, and analysis categories.
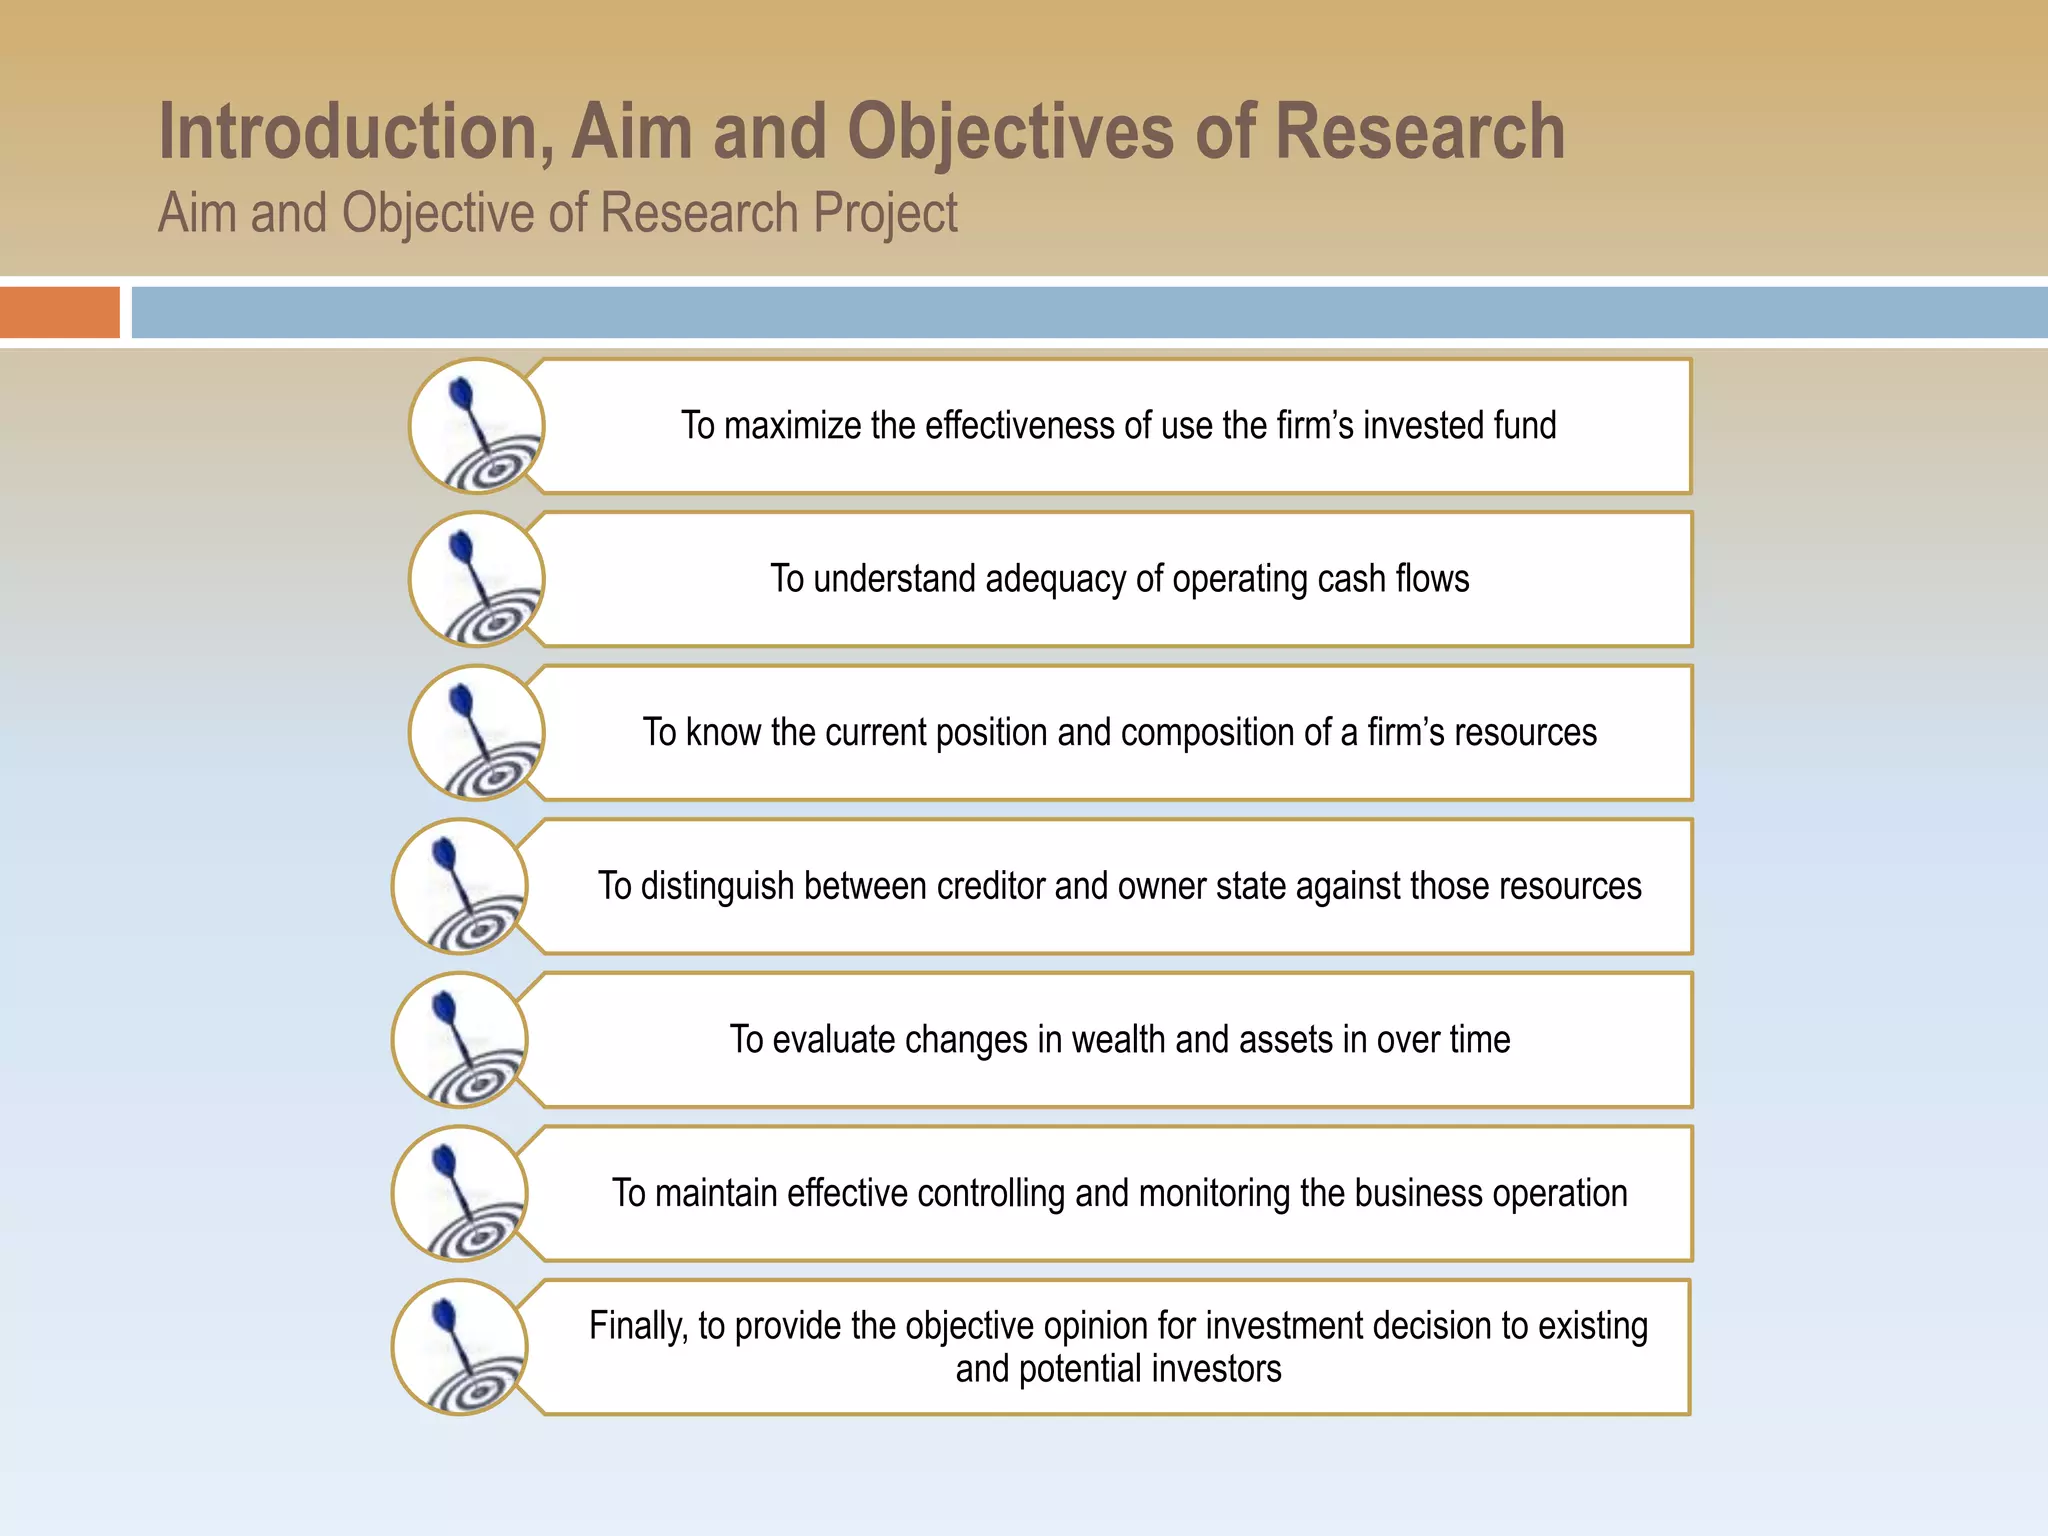
Overview of the research aim including topics like maximizing investment effectiveness and understanding firm resources.
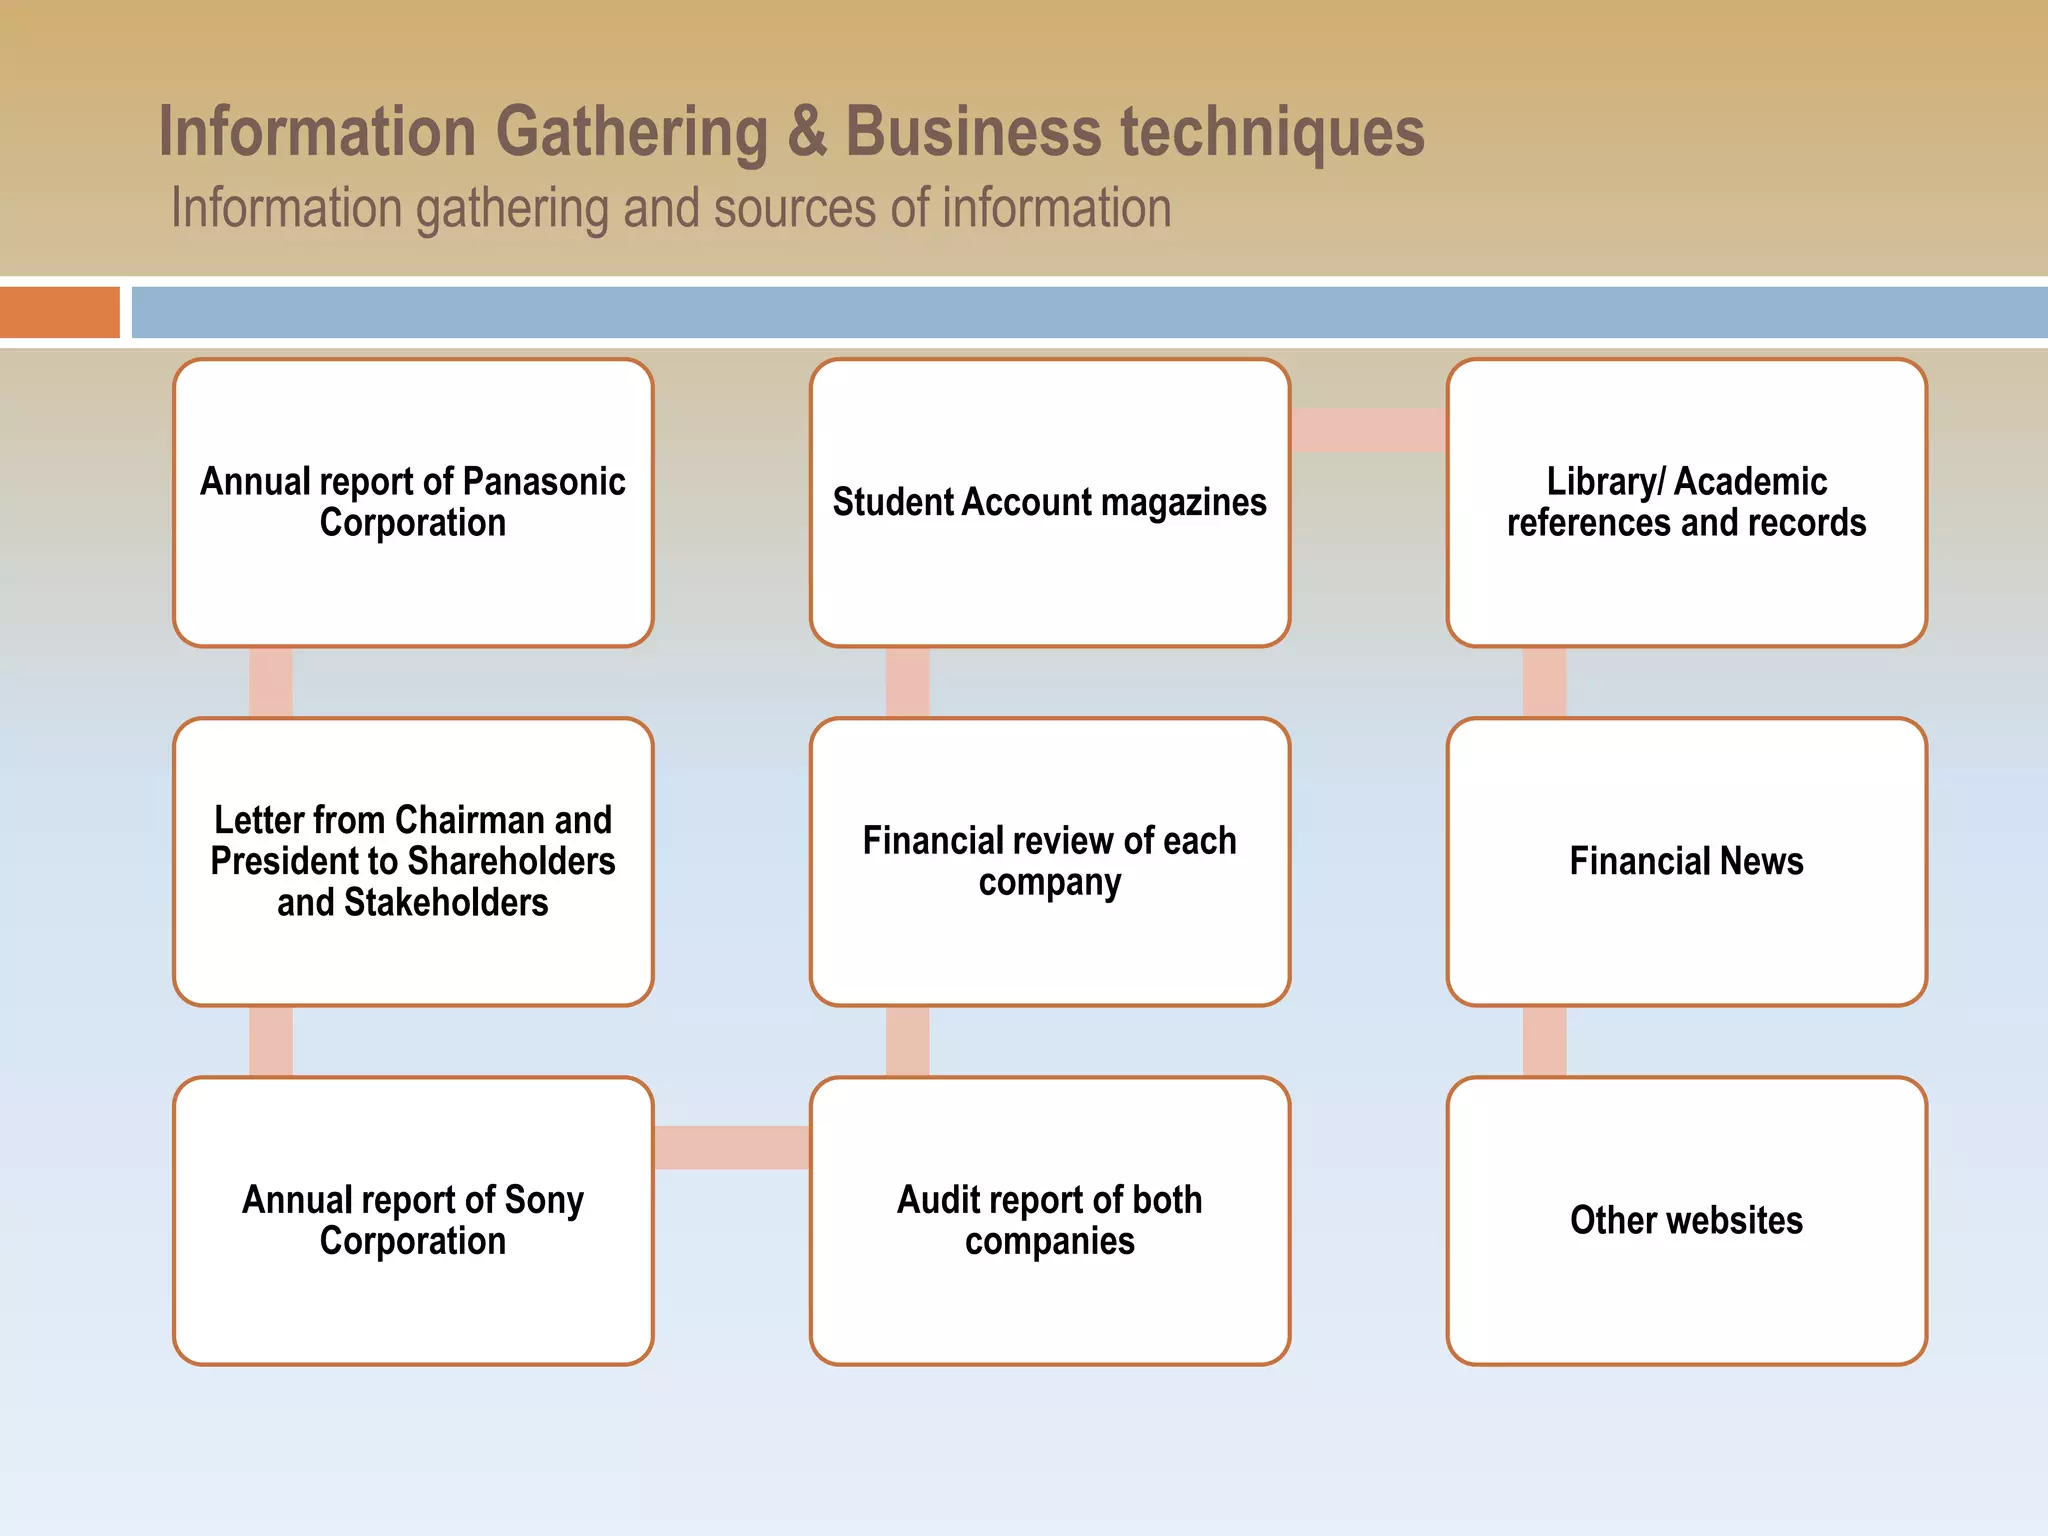
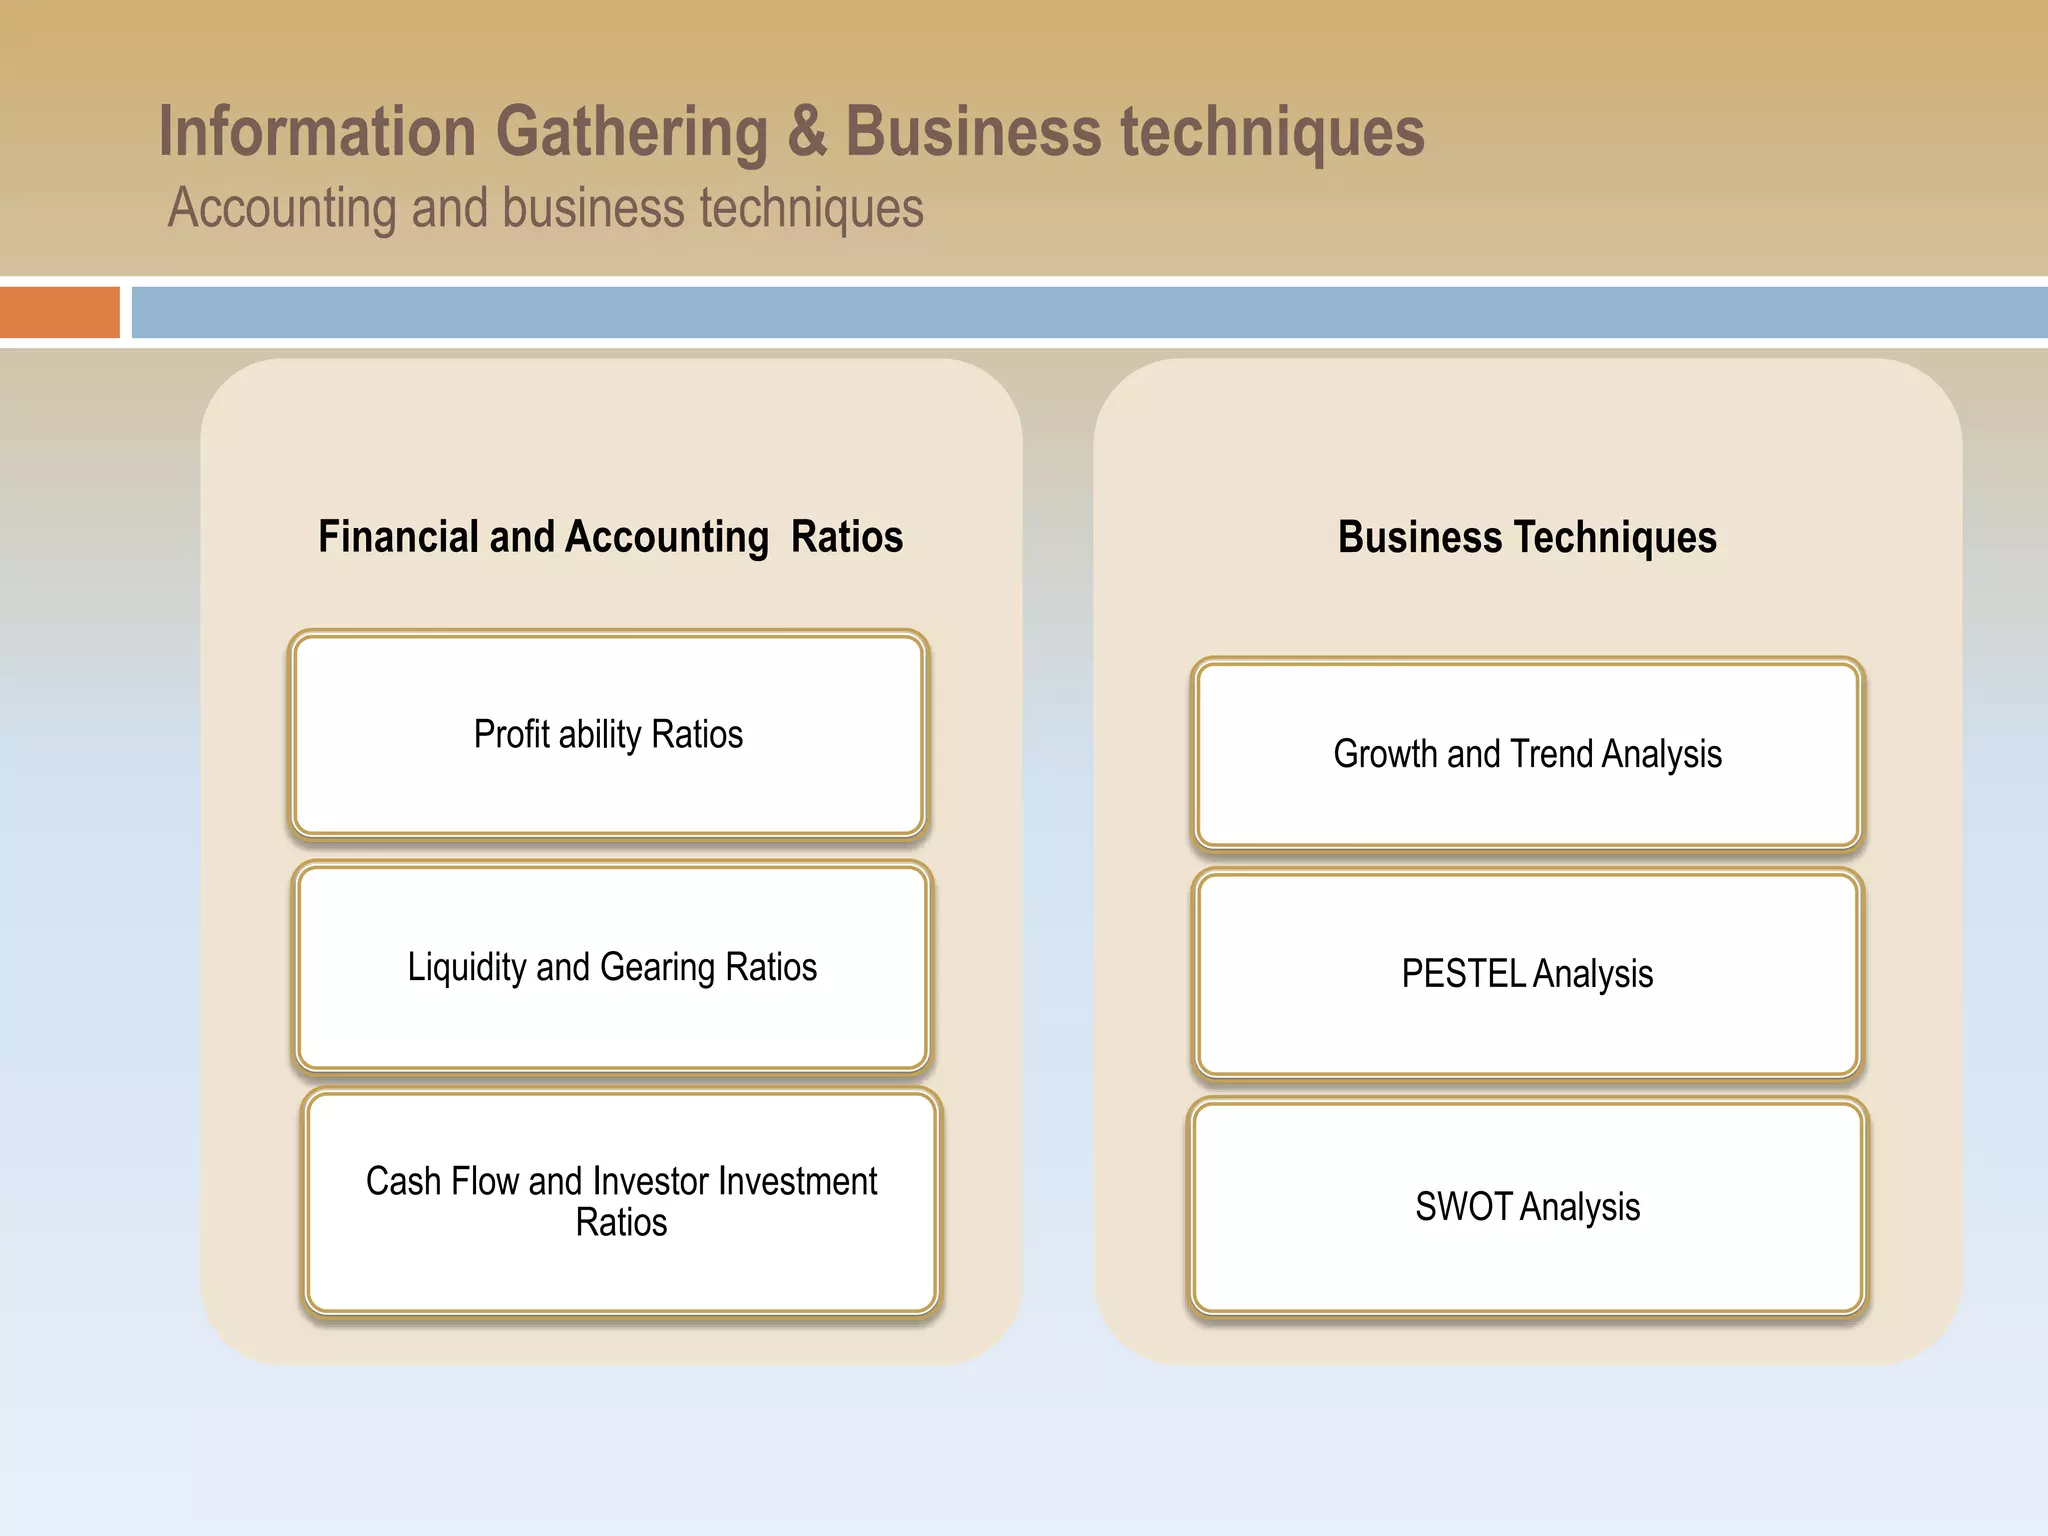
Summary of information collection sources such as annual reports and financial reviews, along with accounting techniques employed.
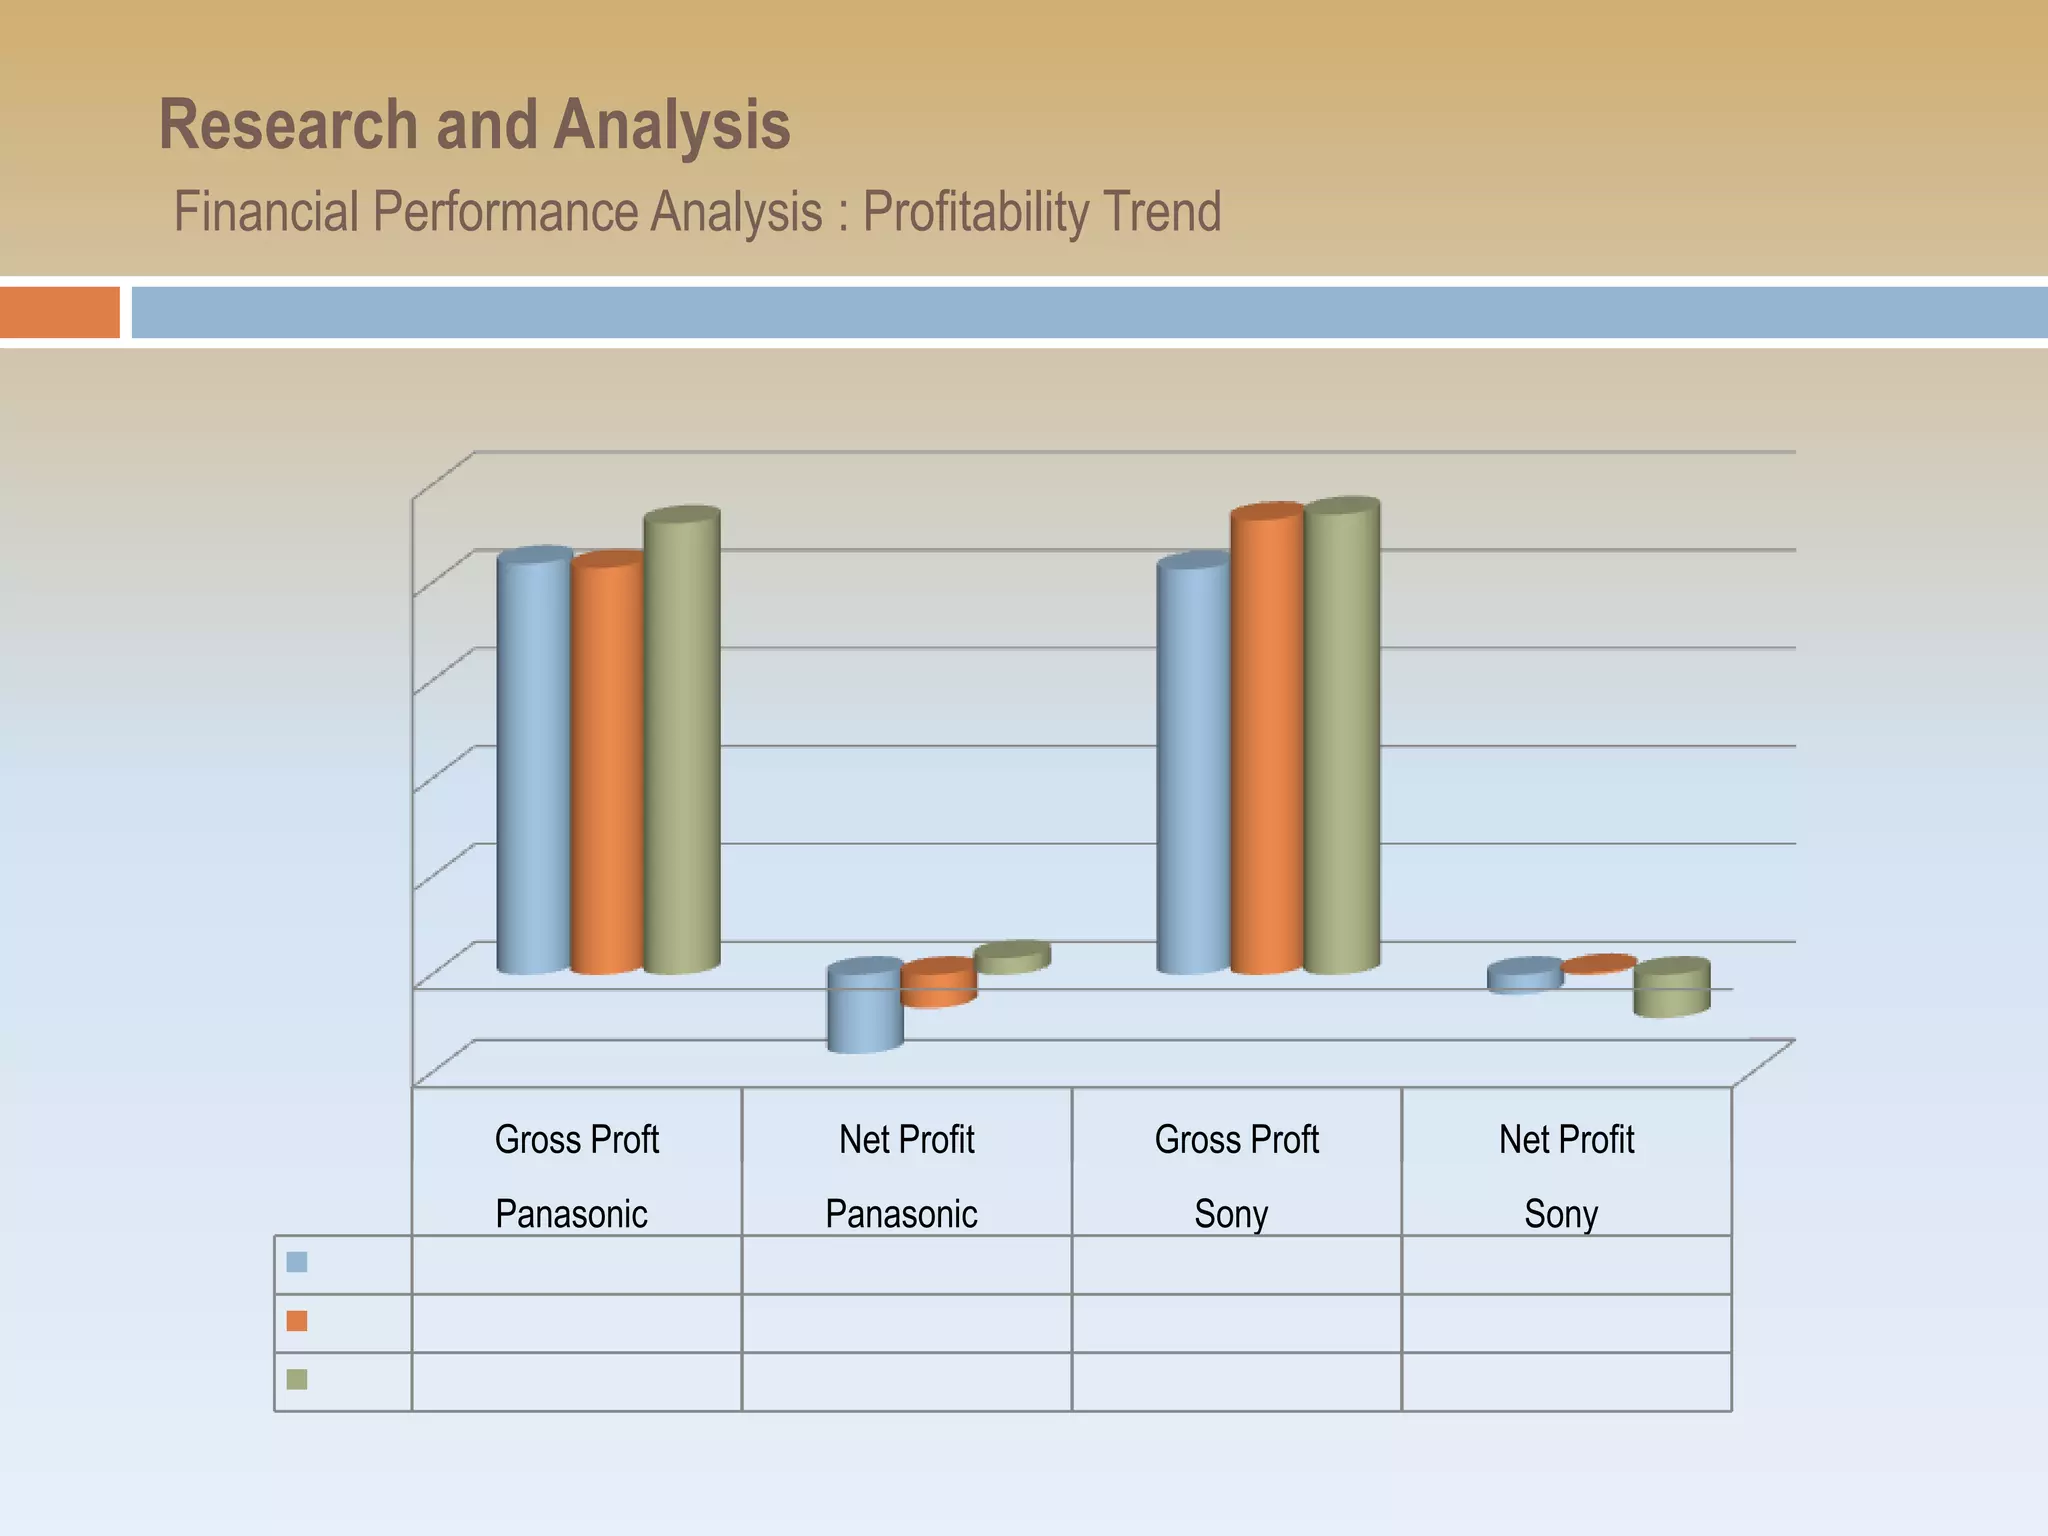
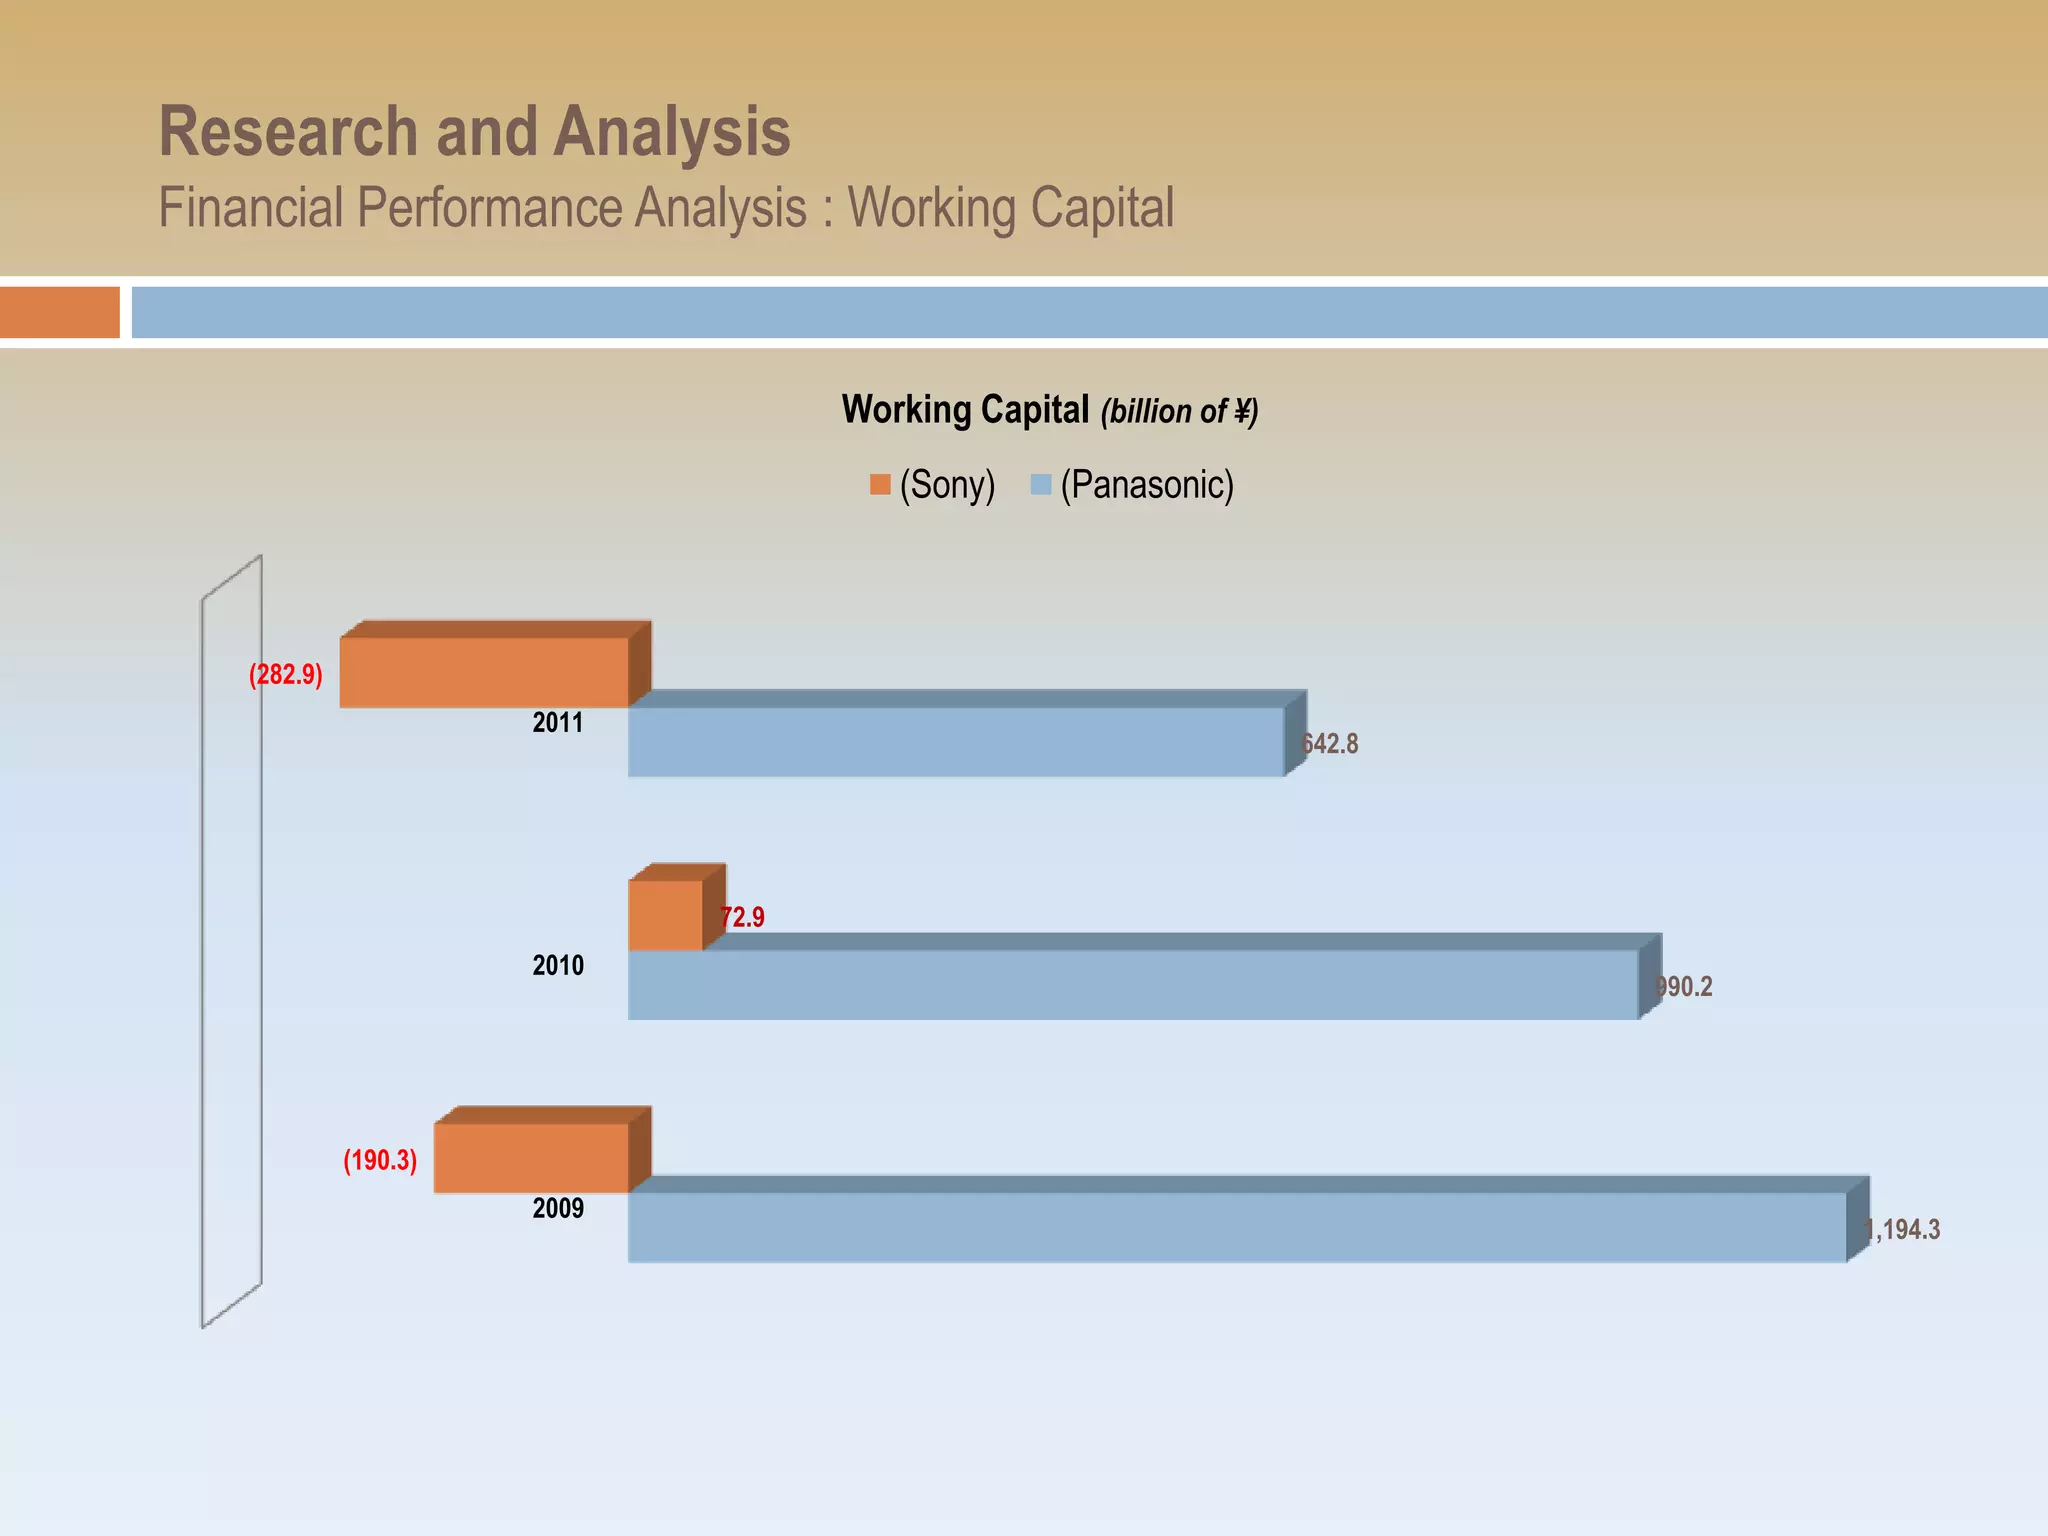
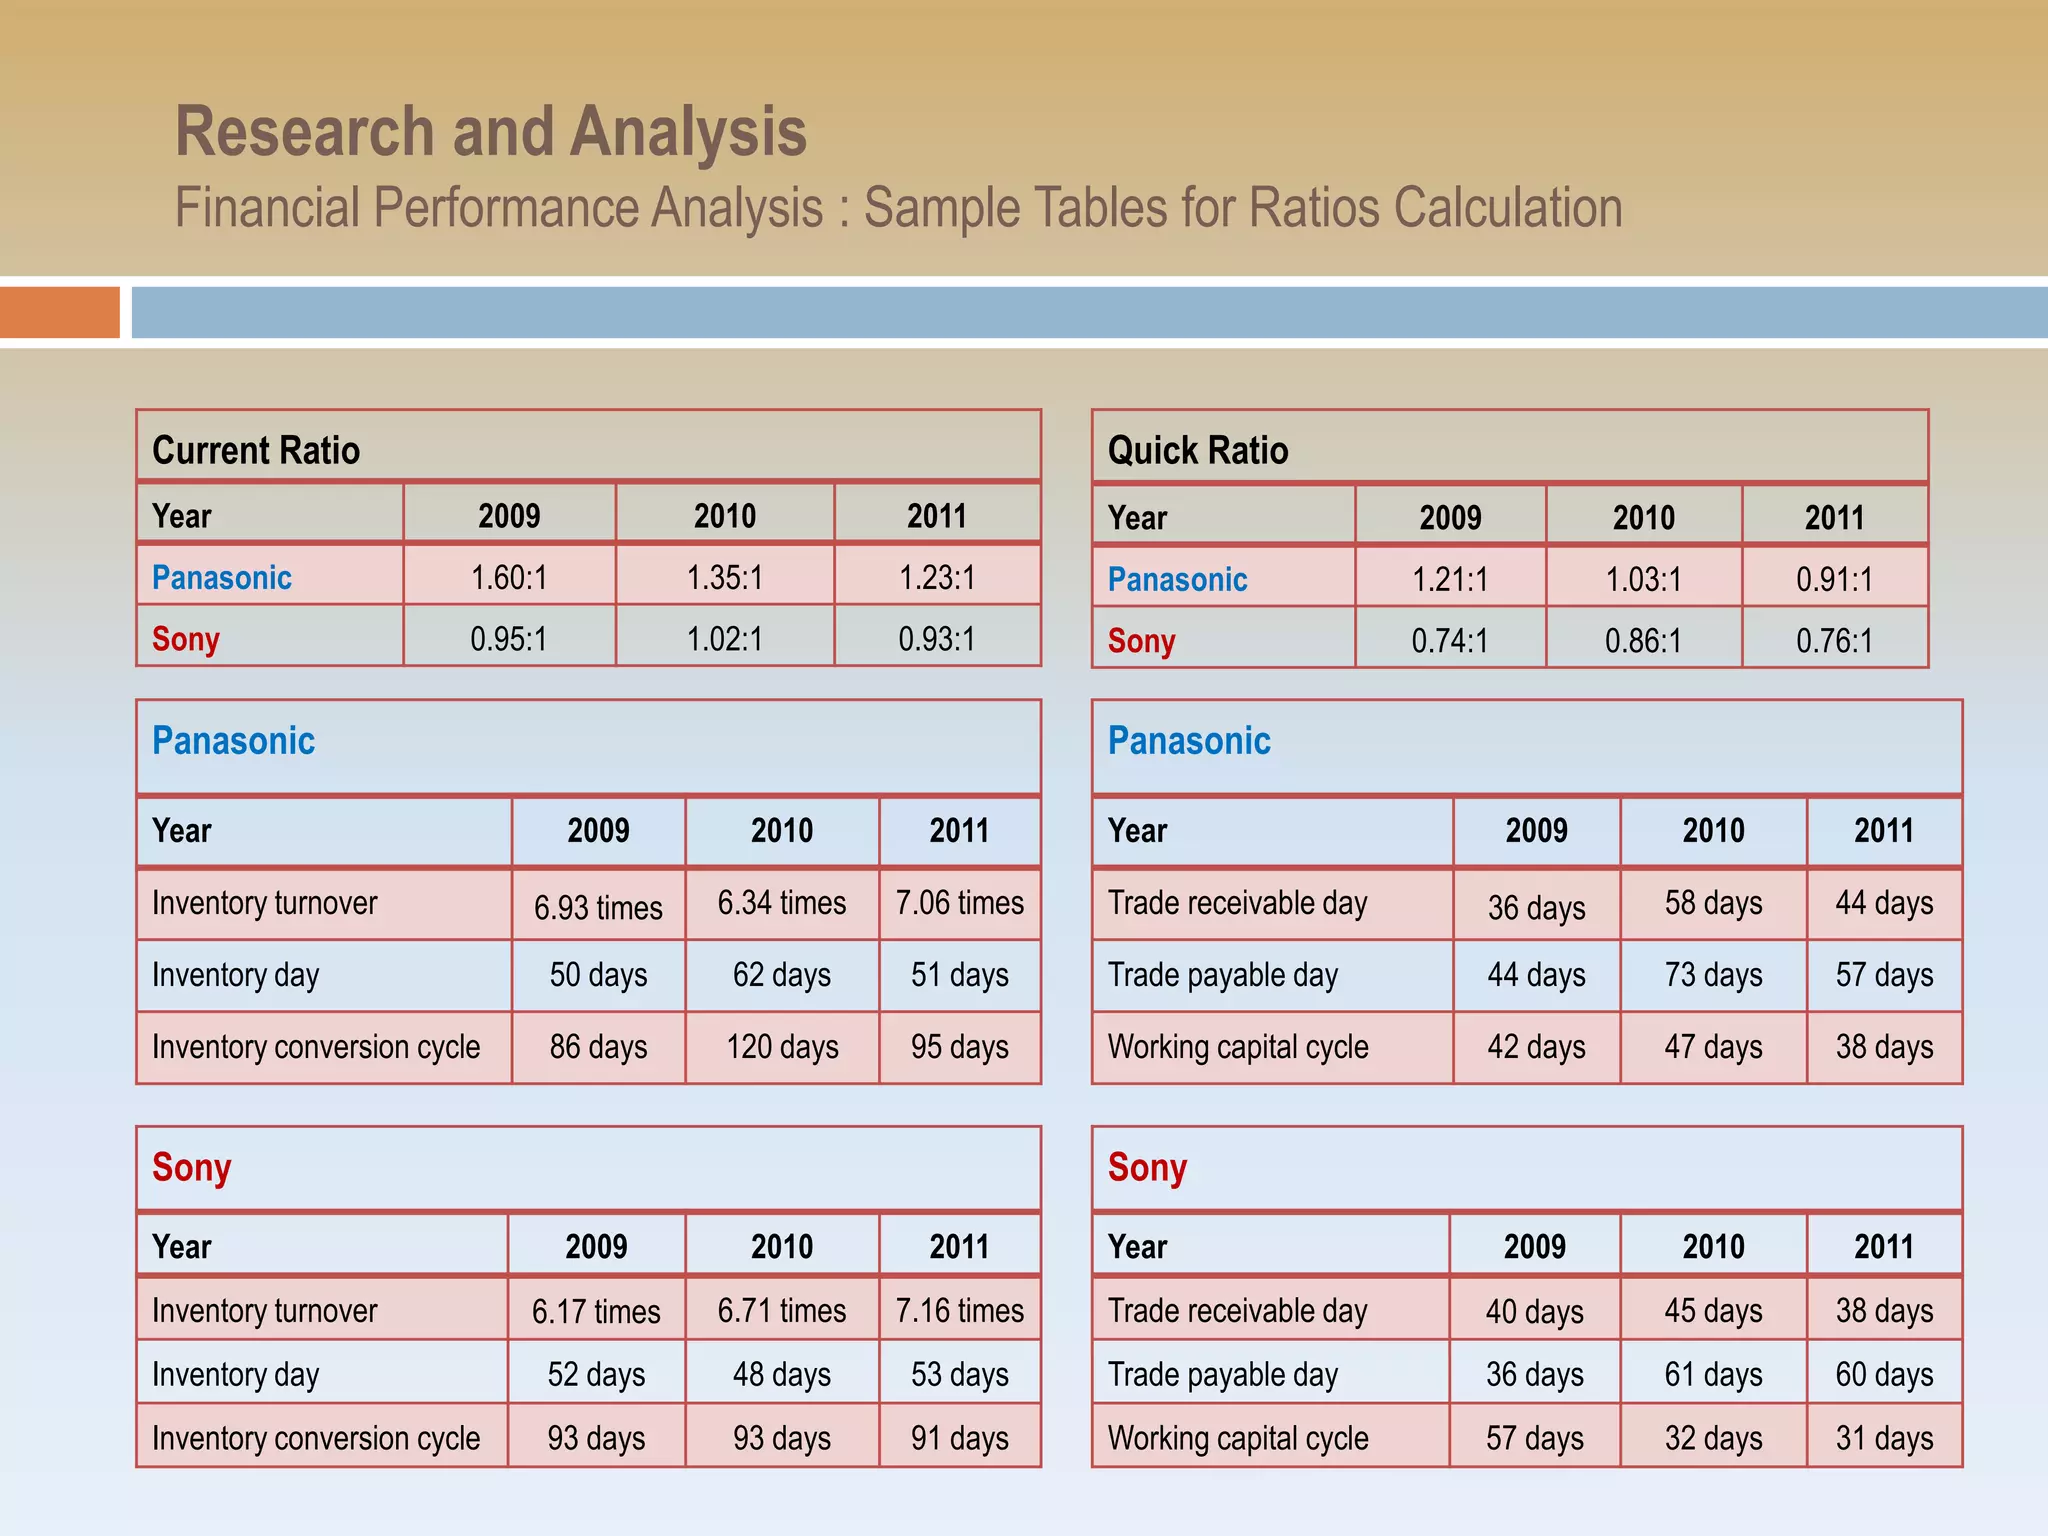
Analysis of profitability trends, asset turnover, working capital, and financial ratios for Panasonic and Sony.
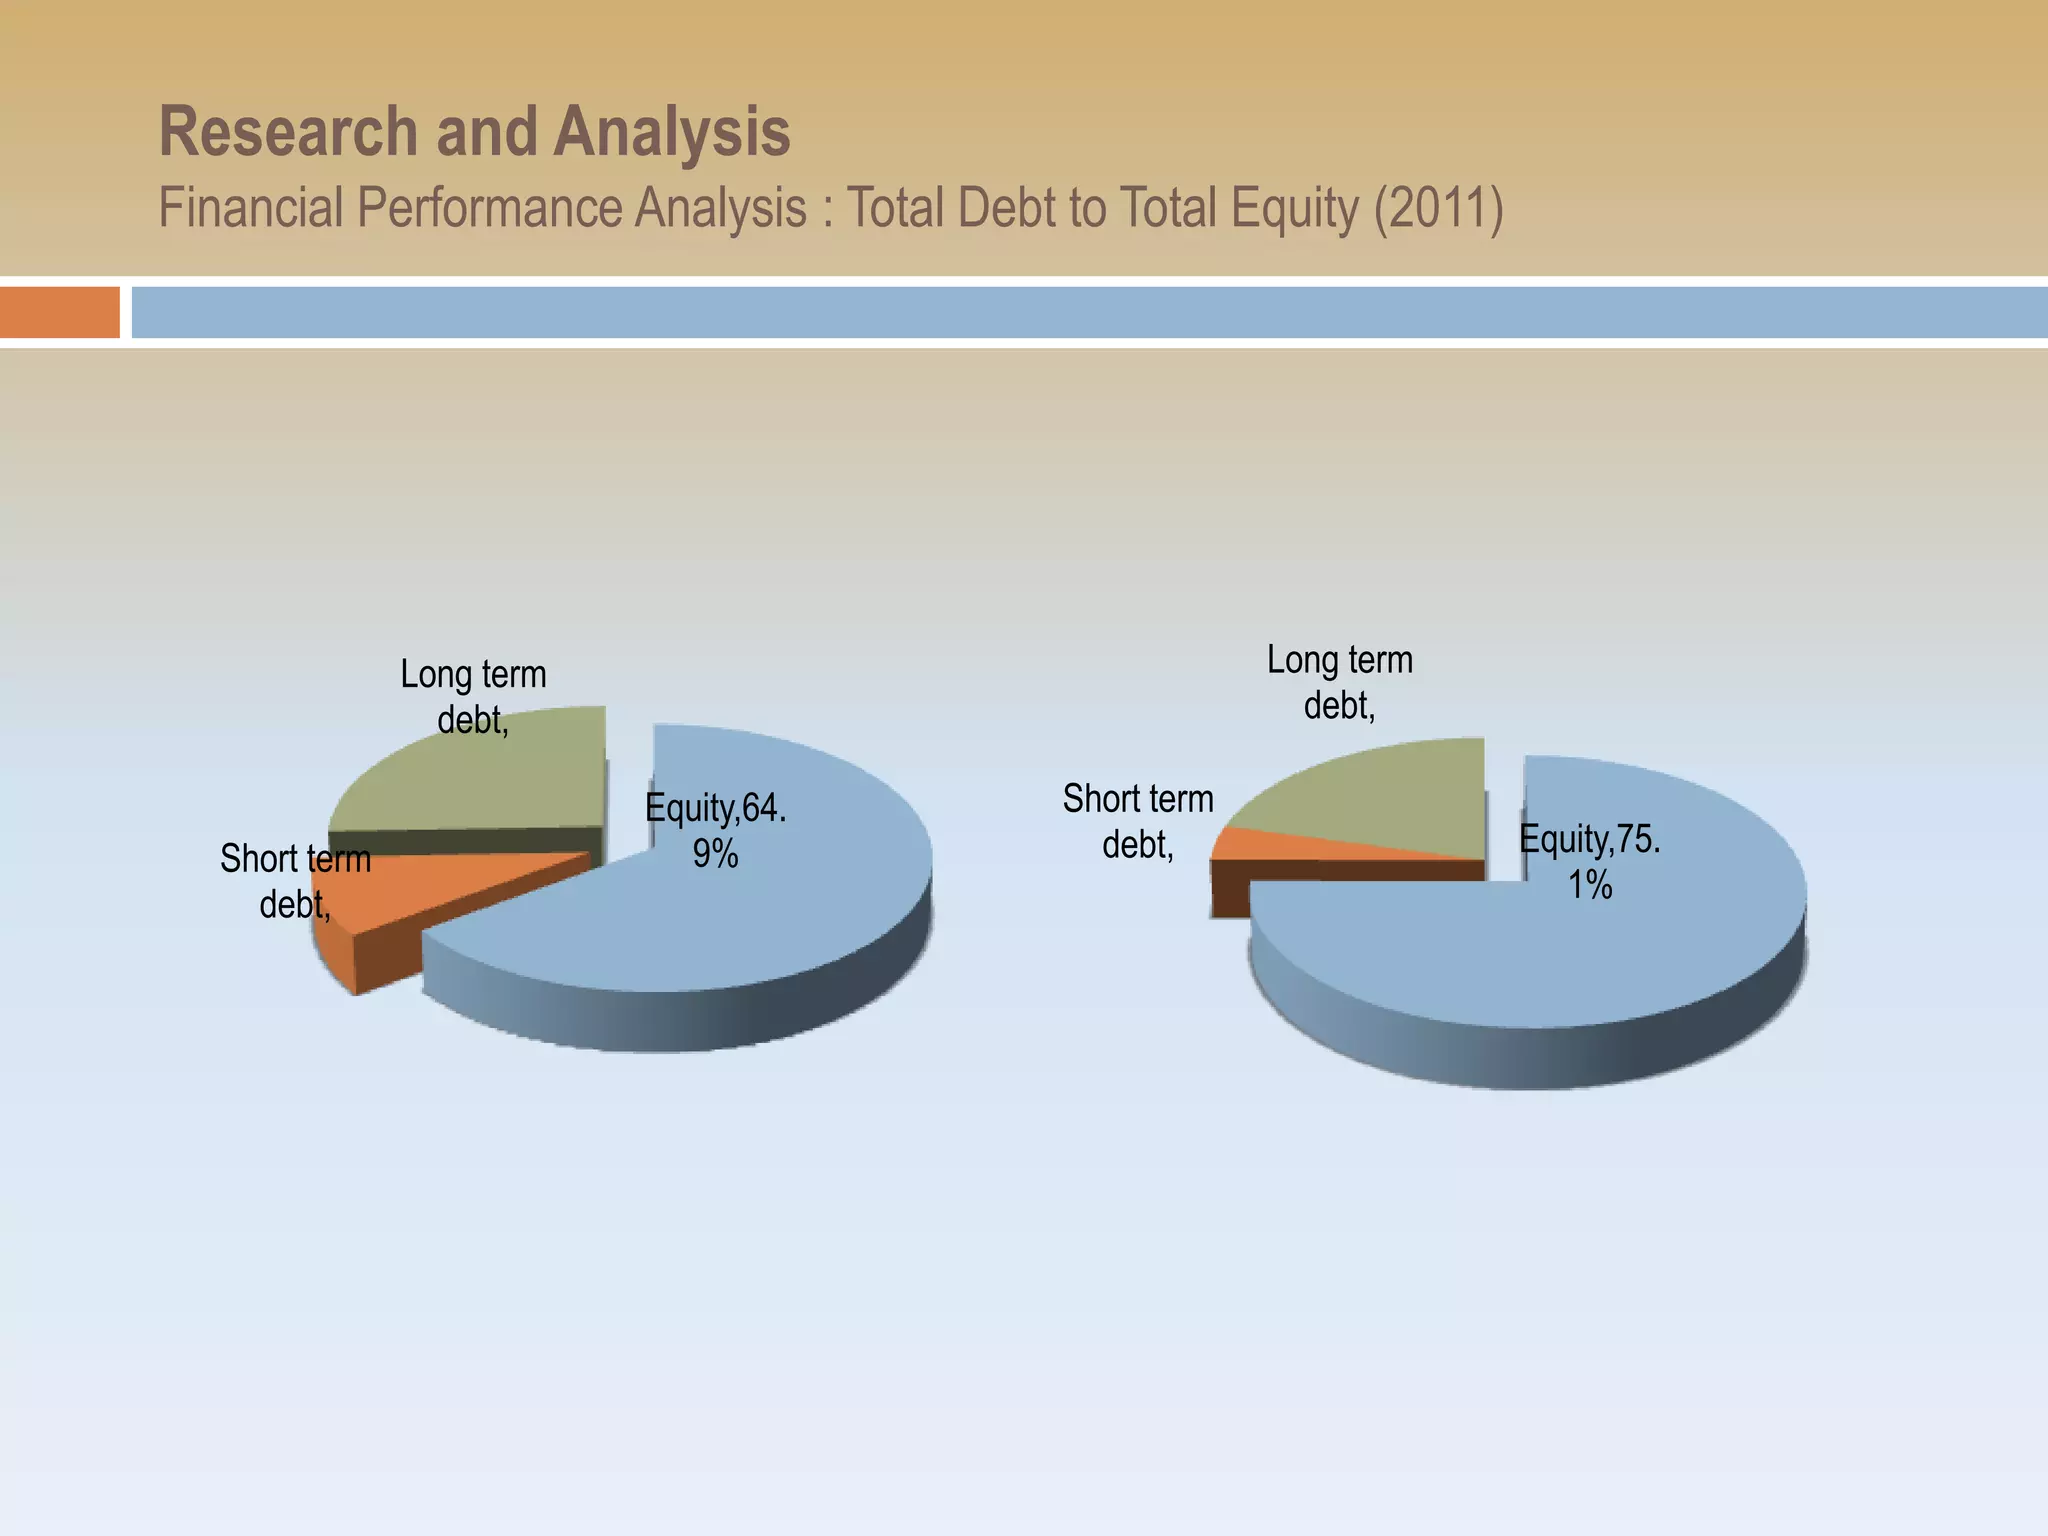
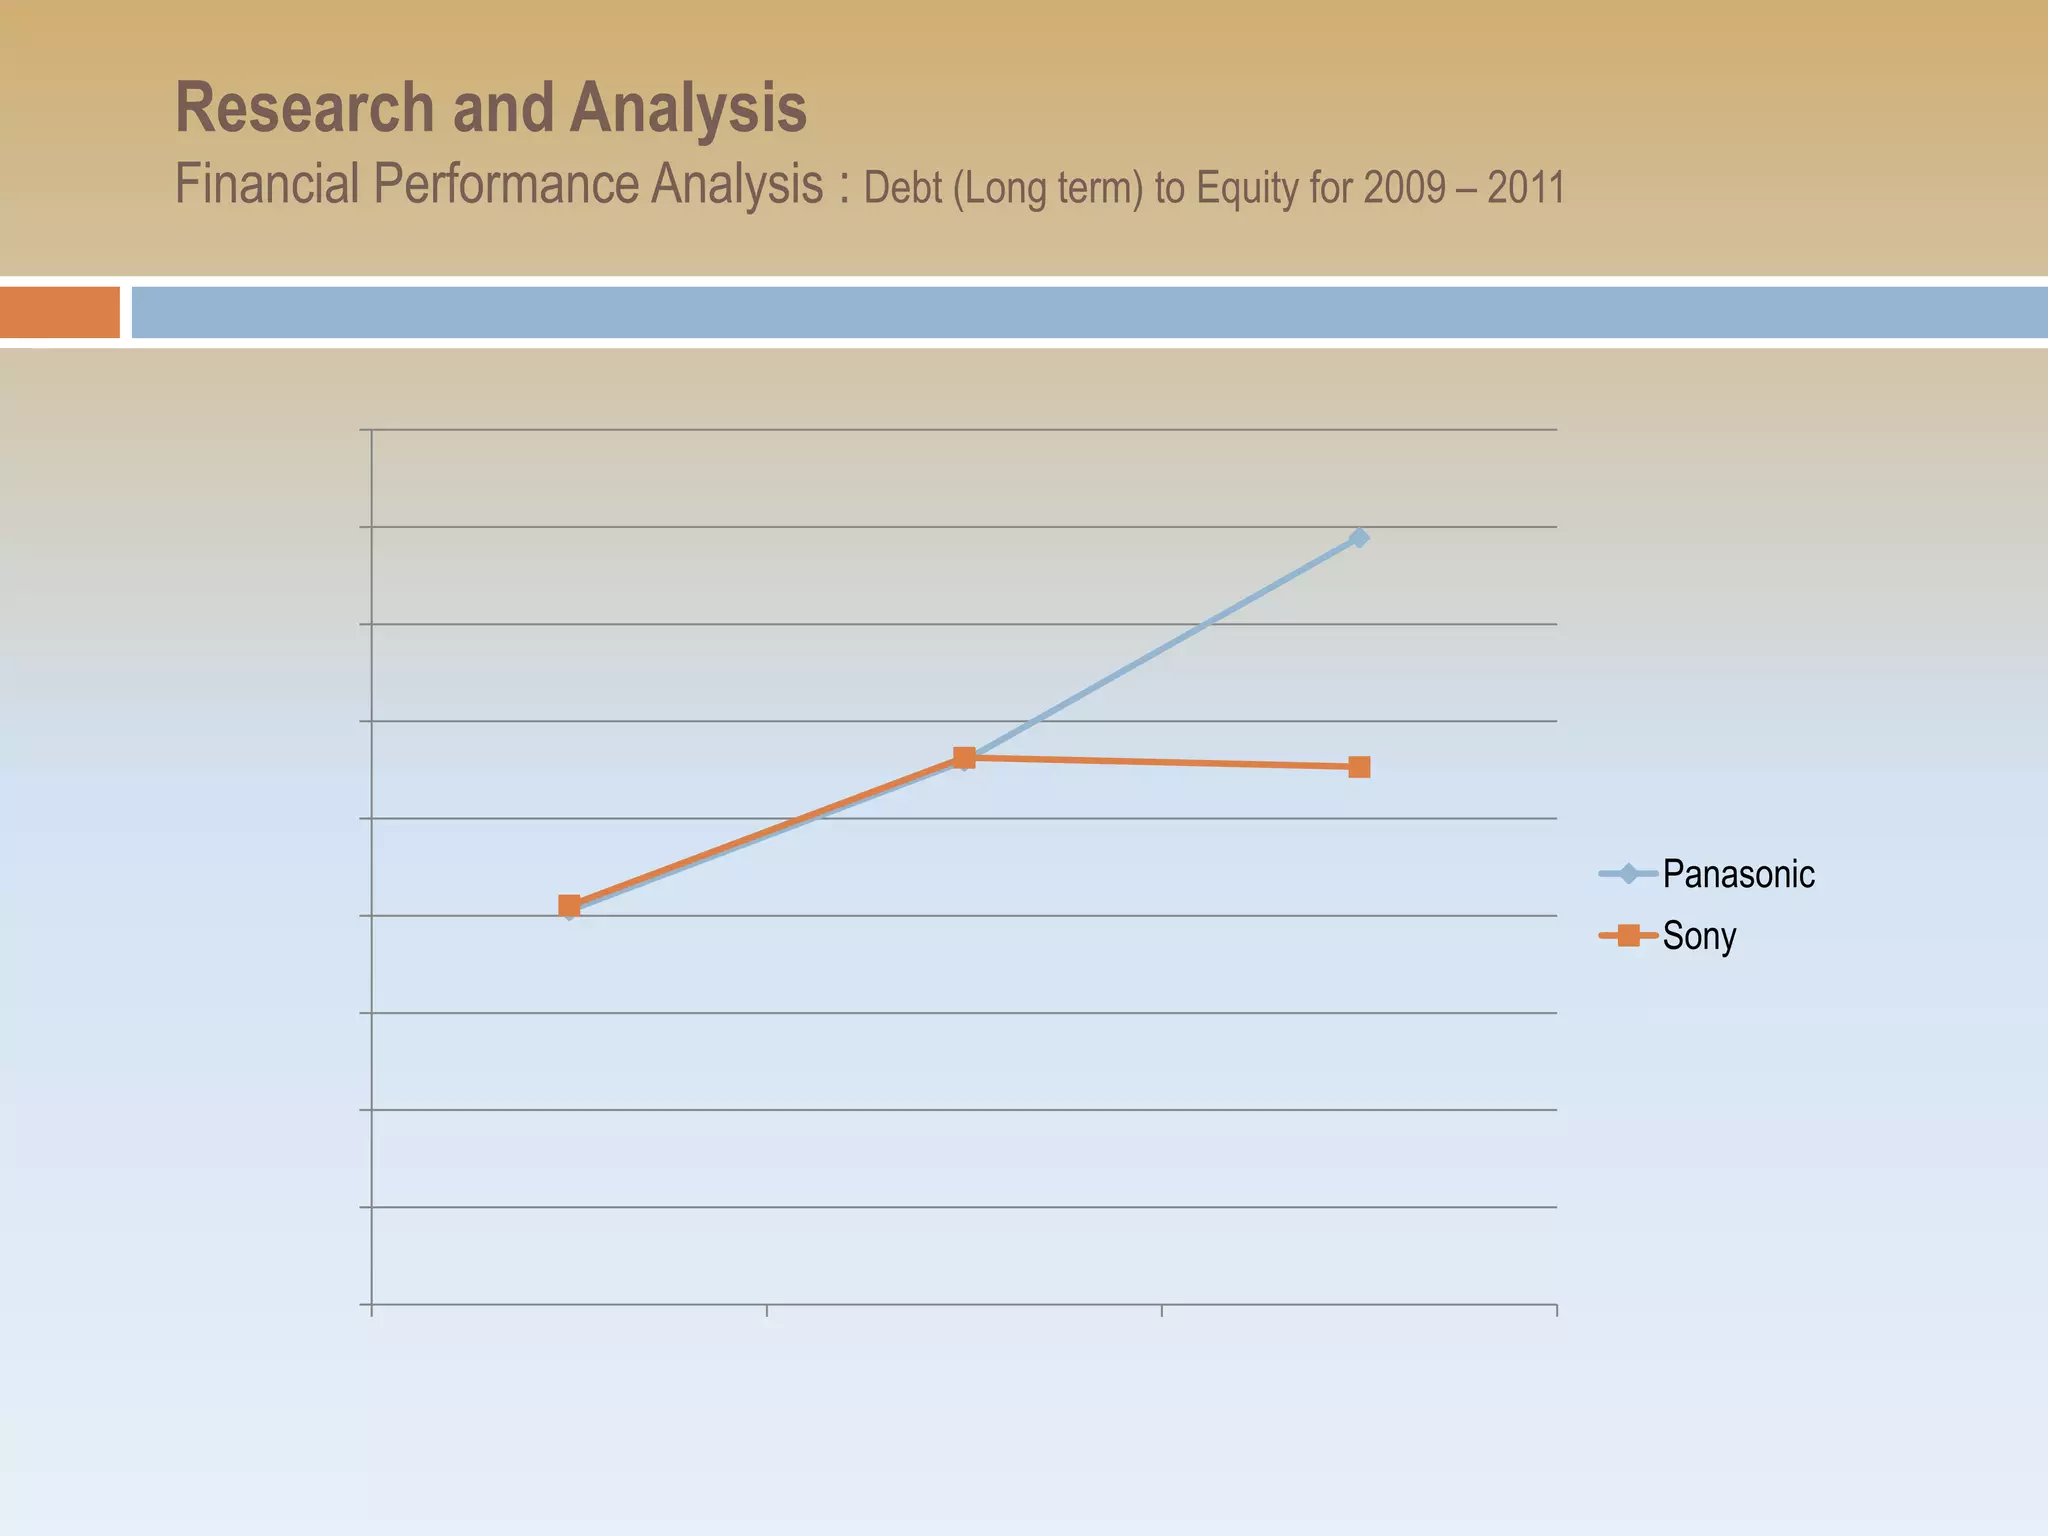
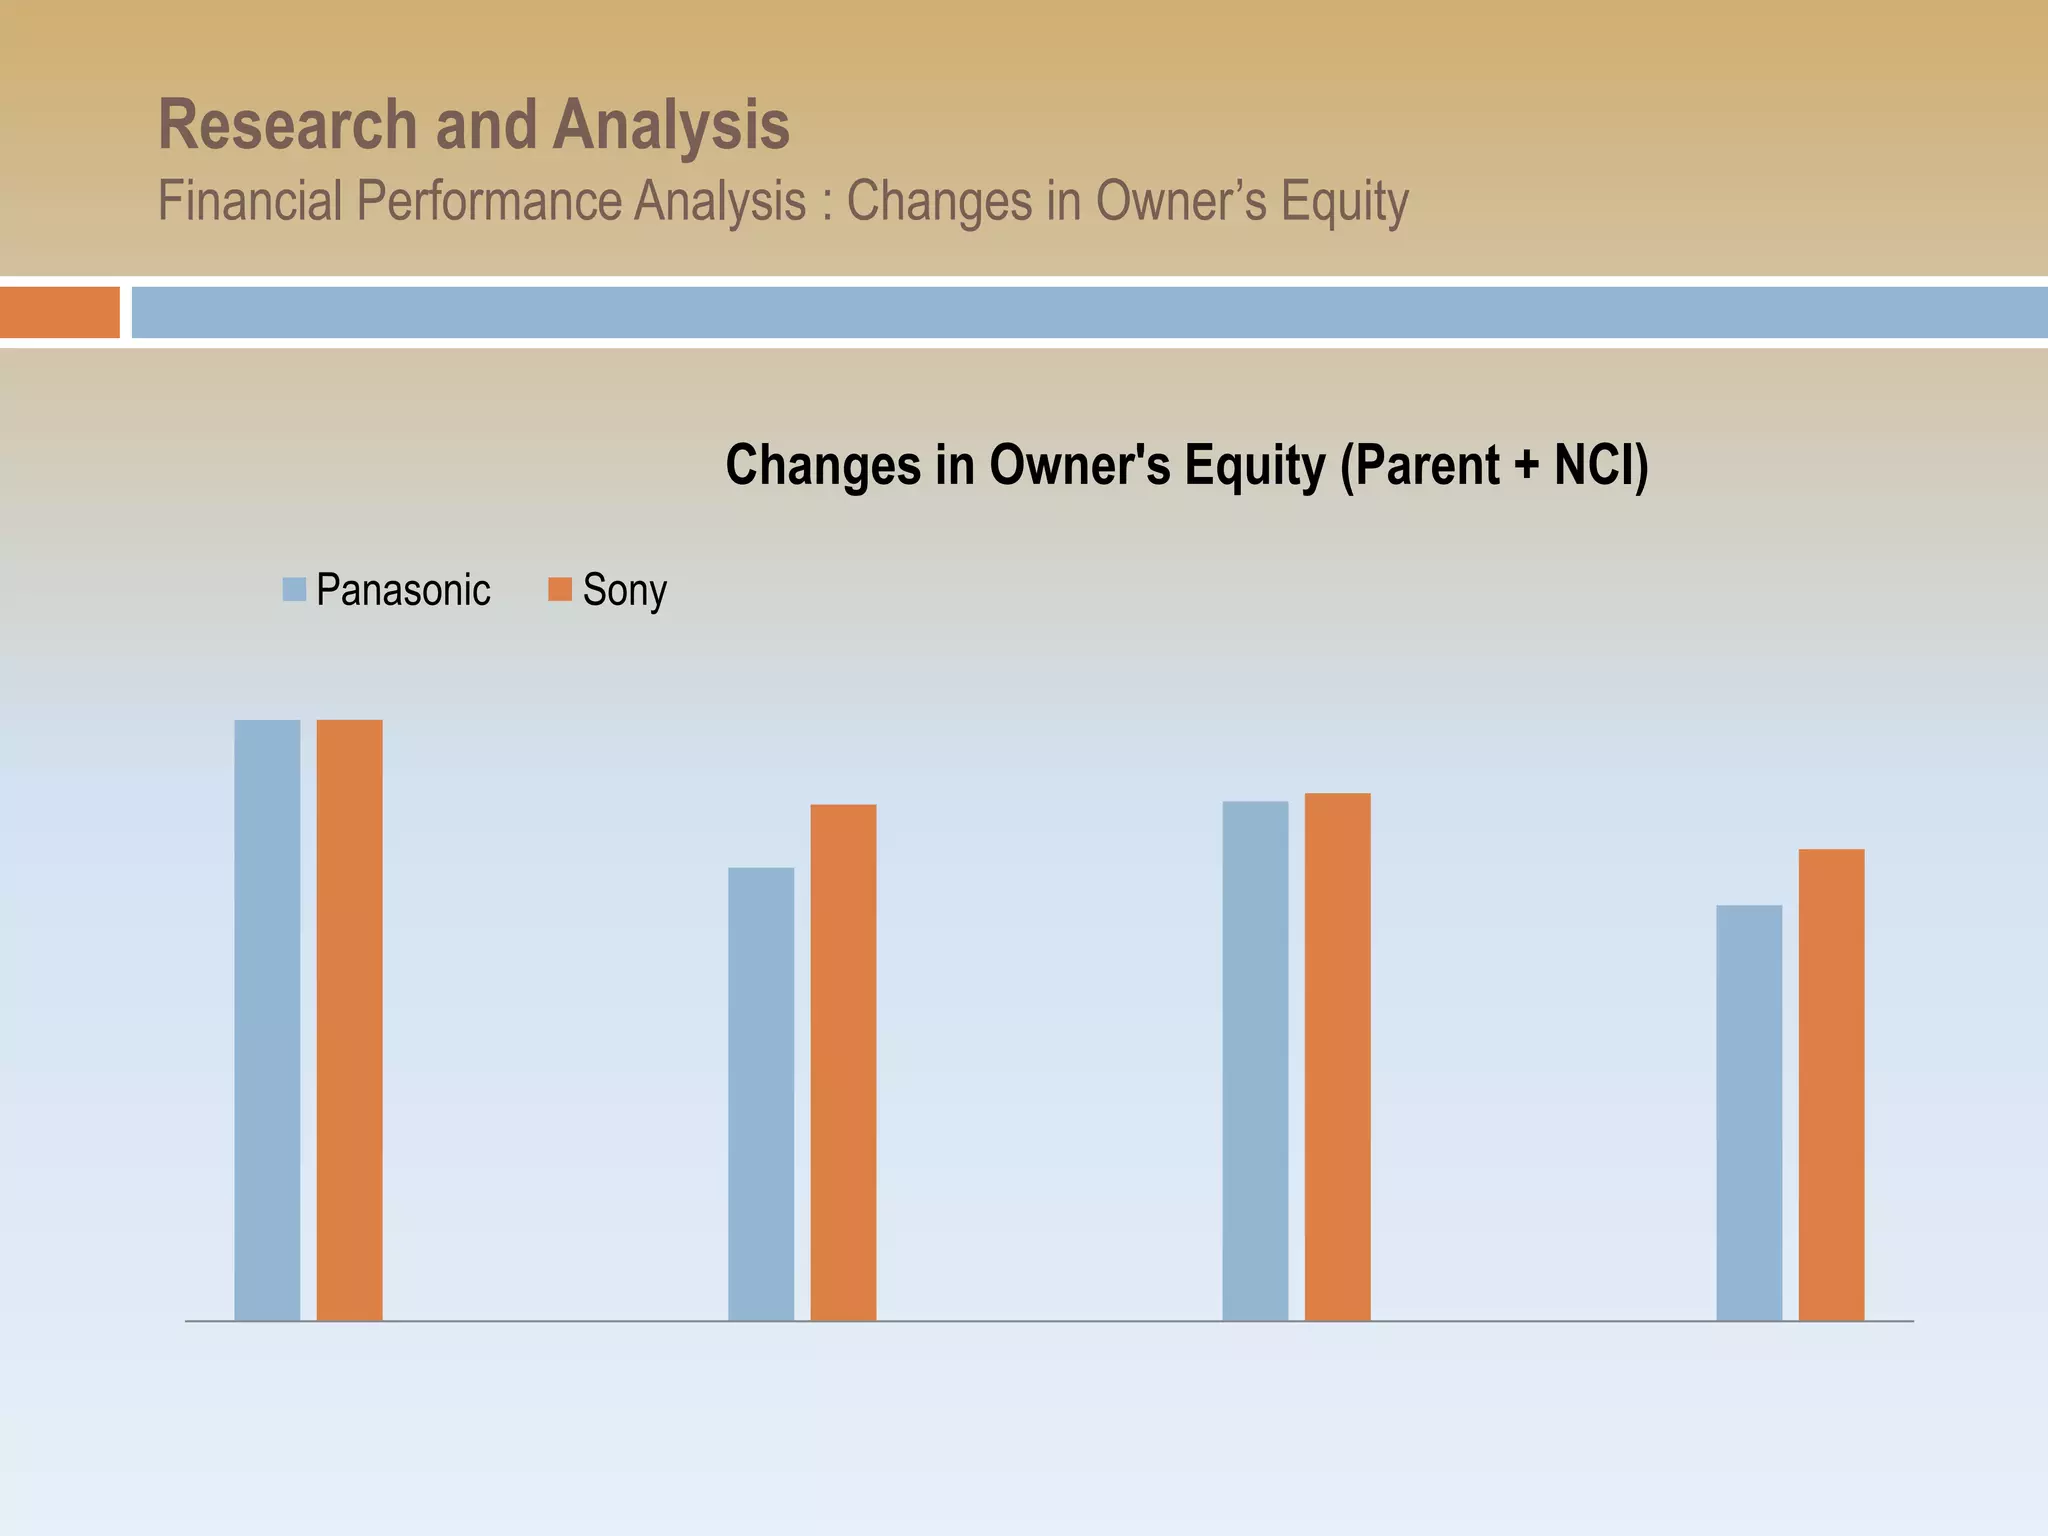
Examination of long-term debts and equity changes over the years for both companies, highlighting key financial metrics.
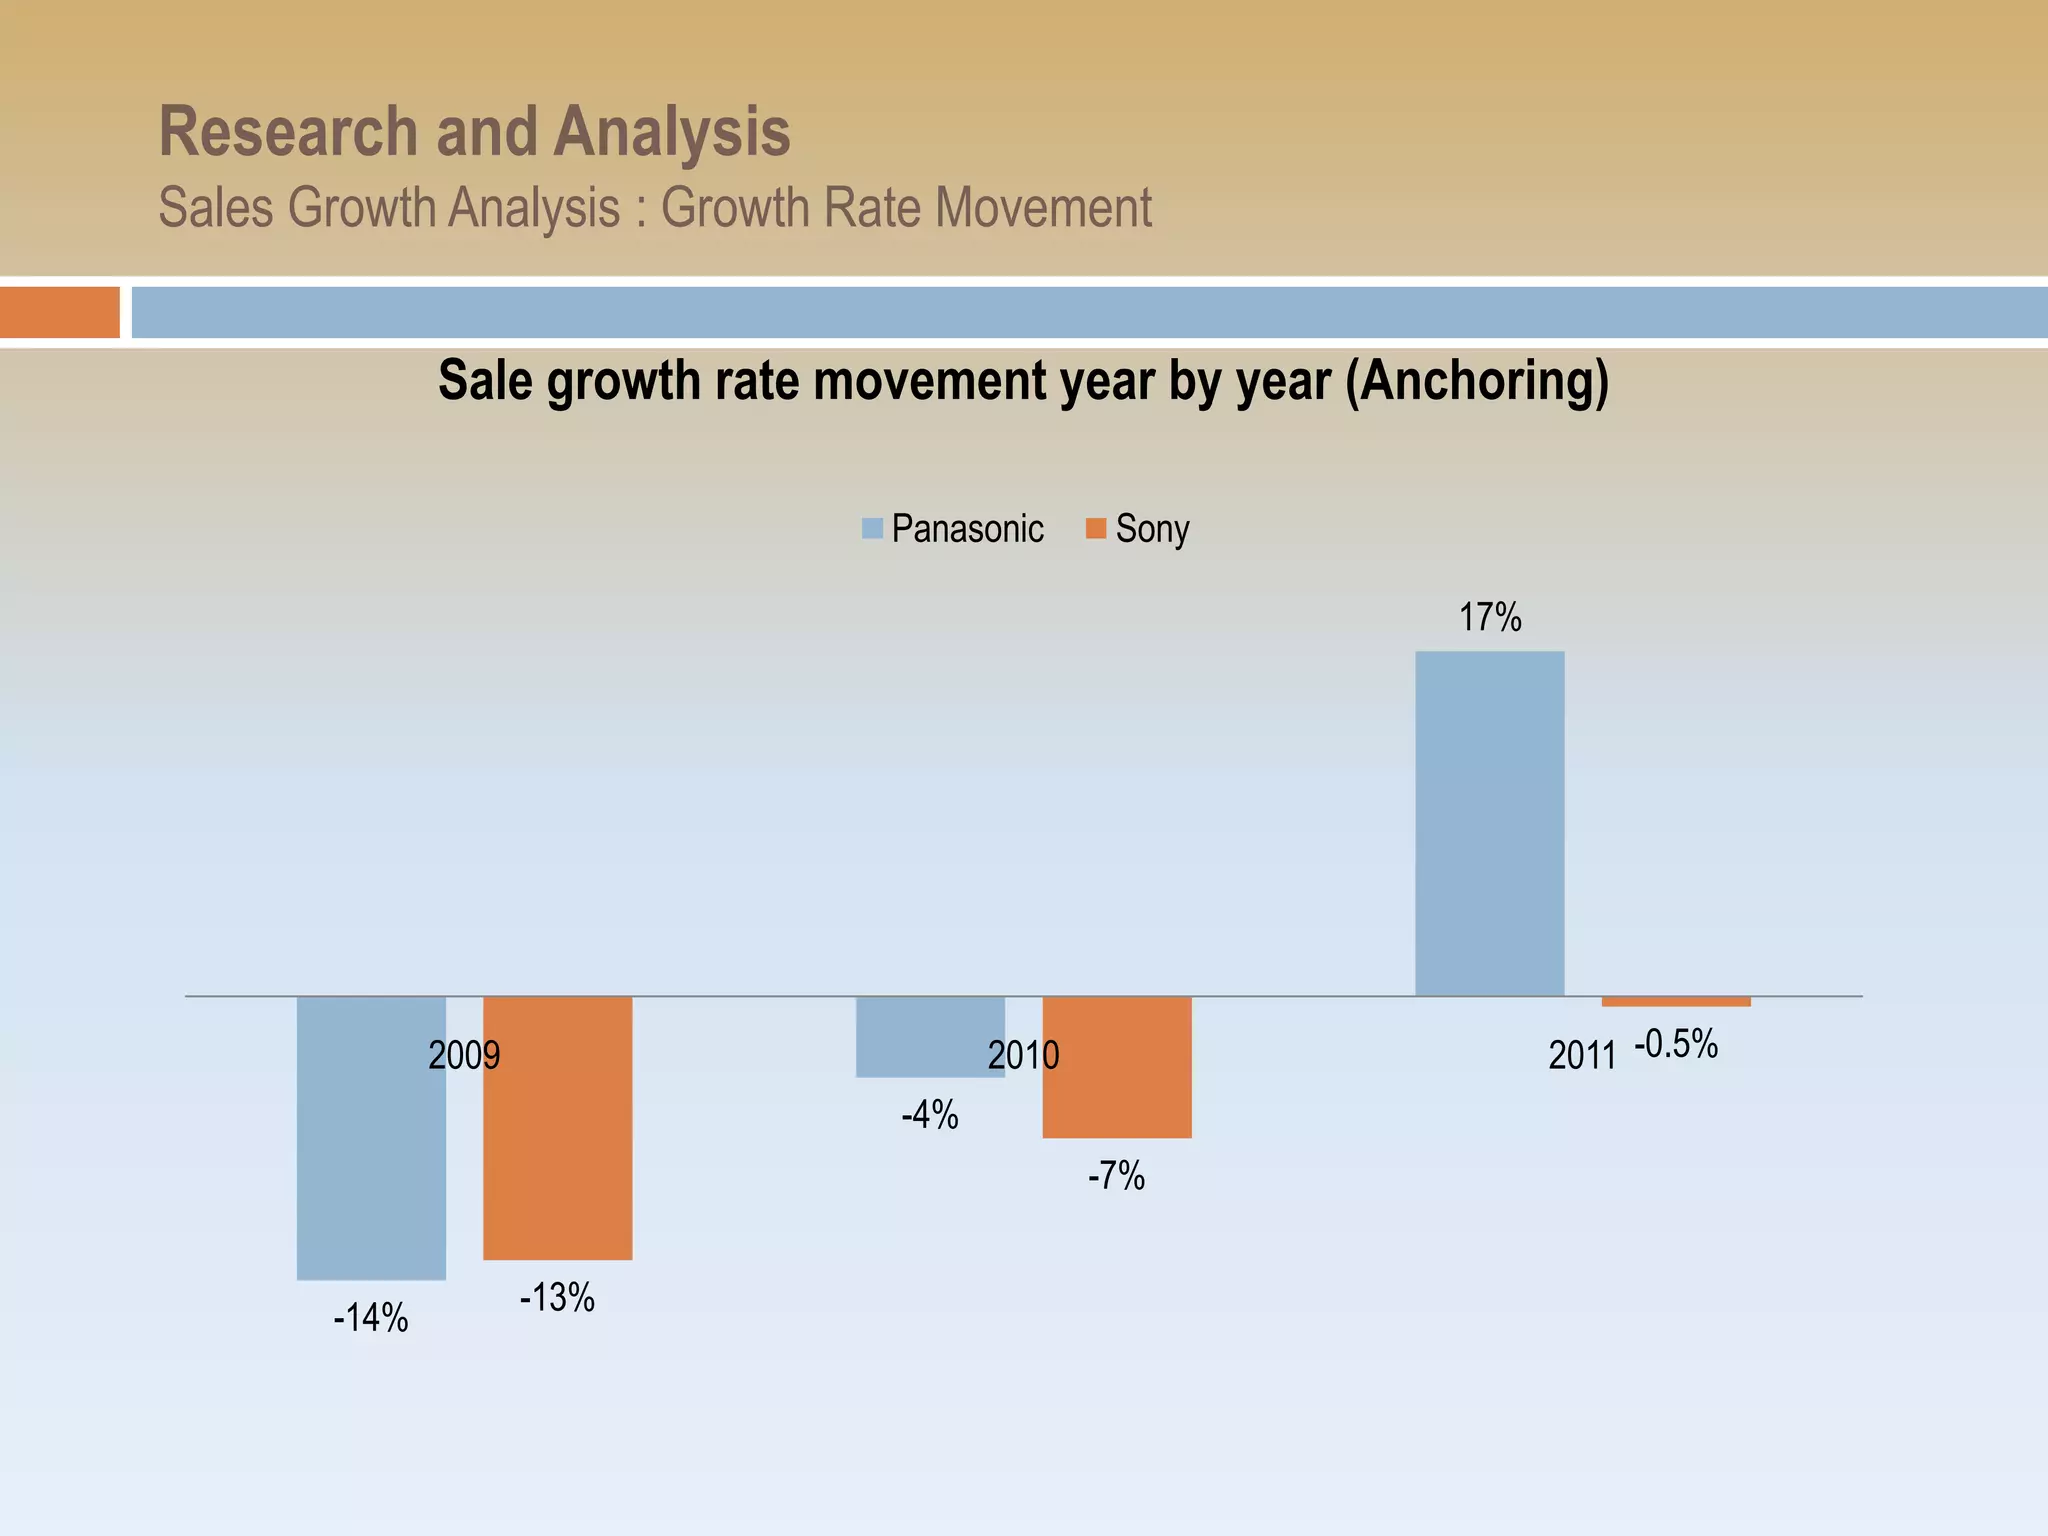
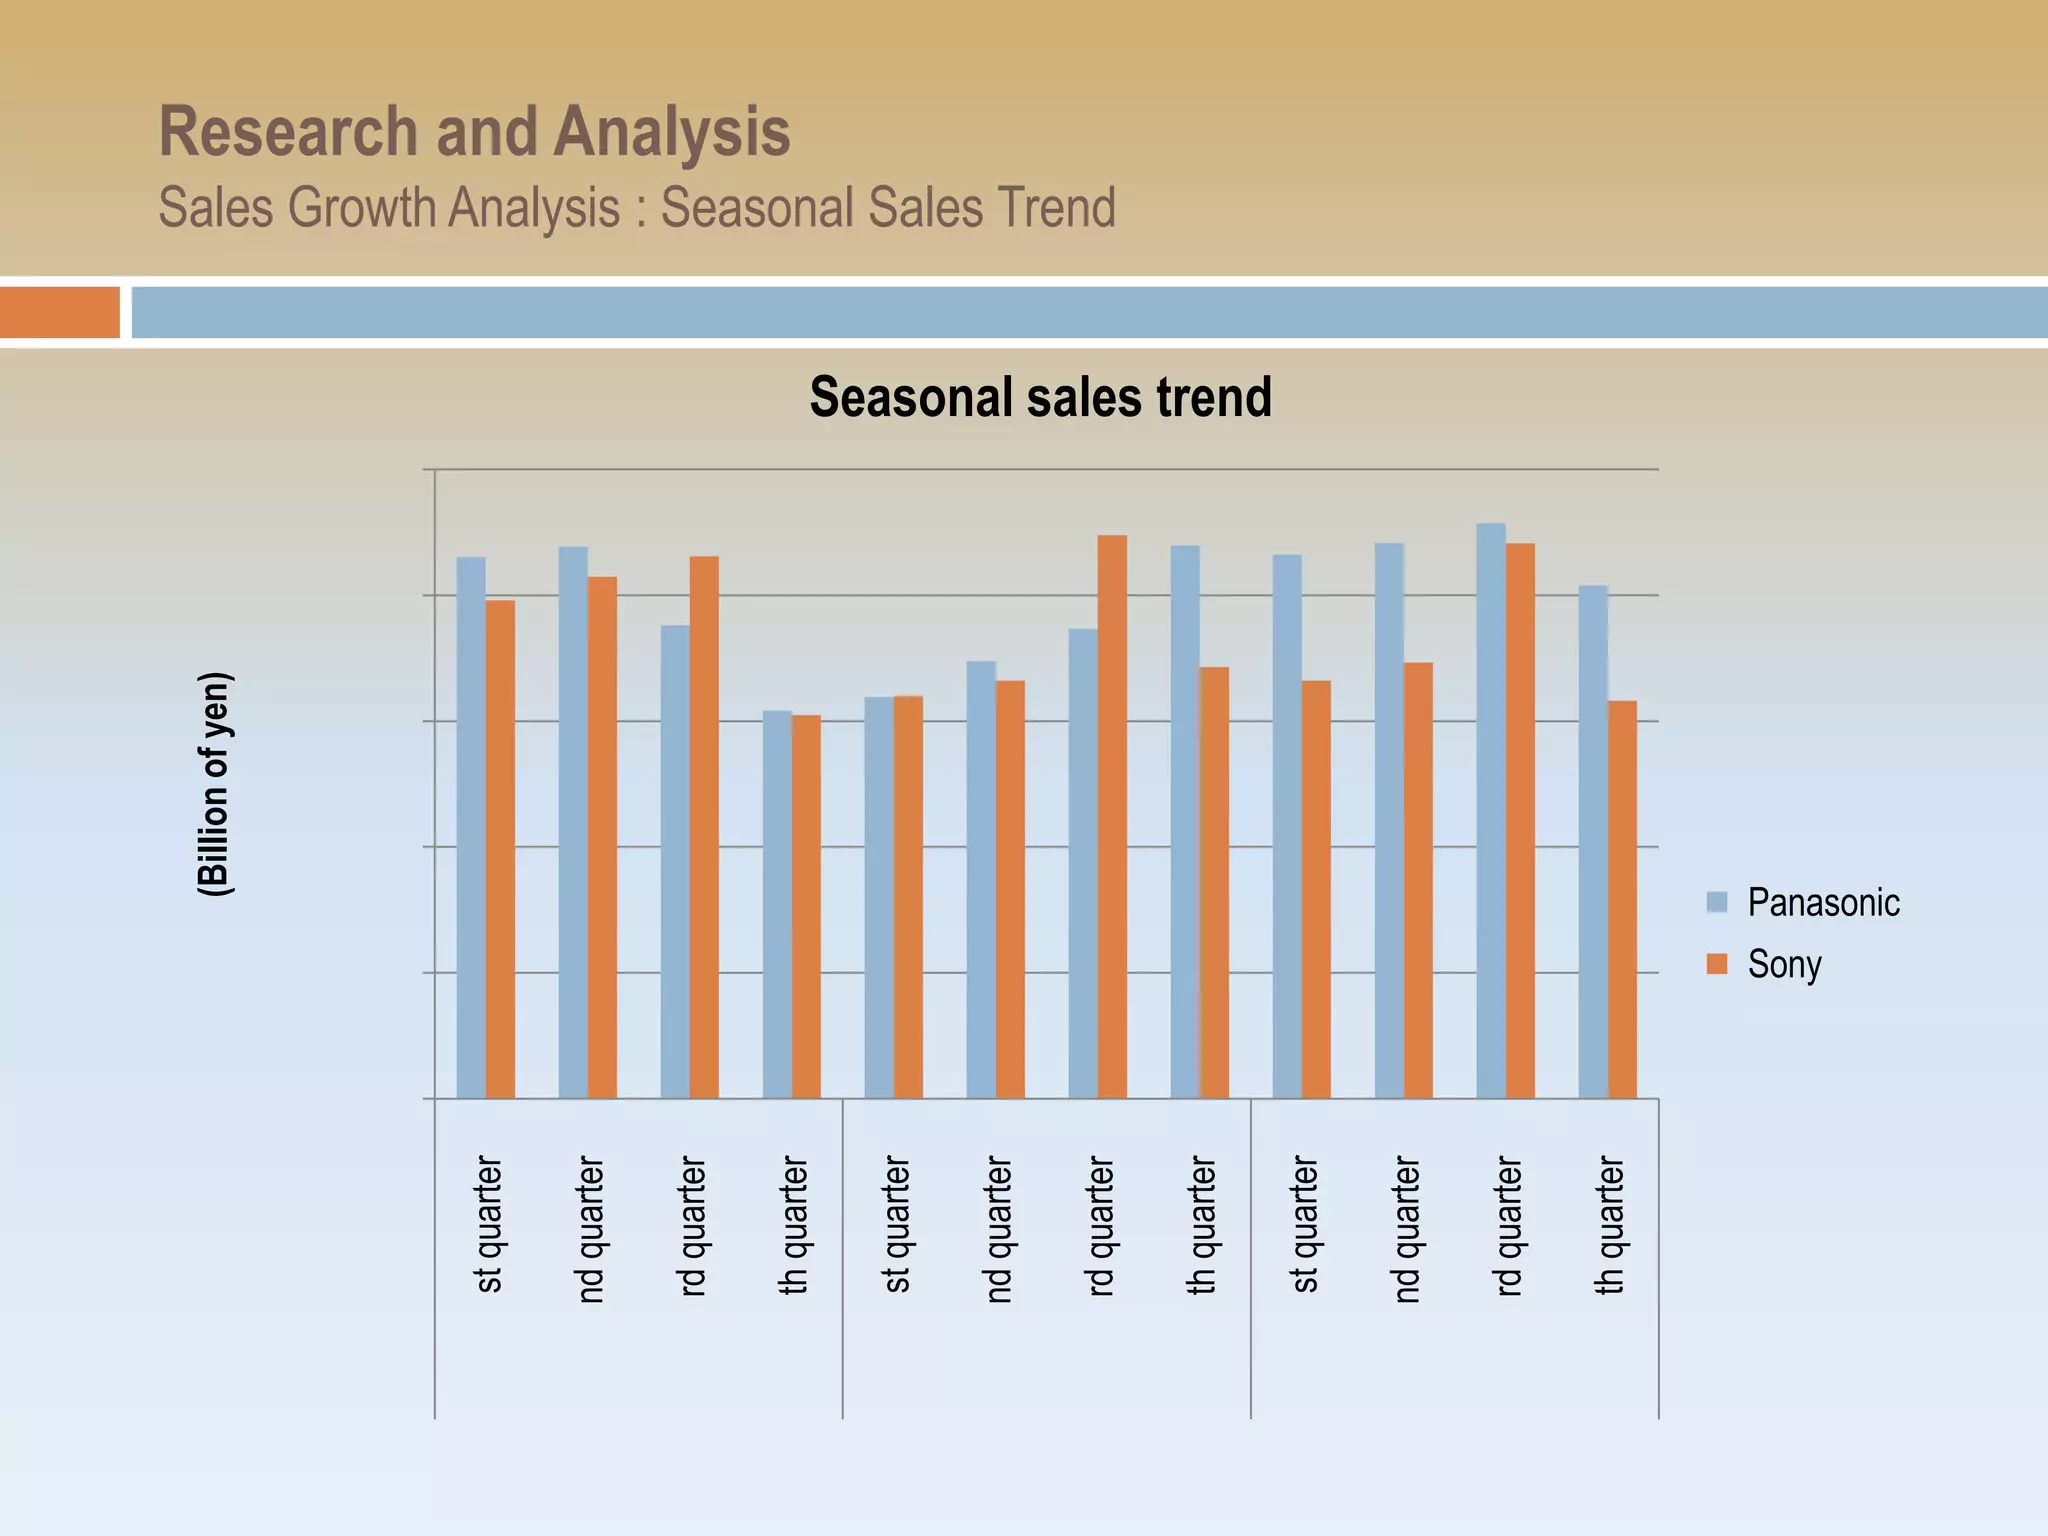
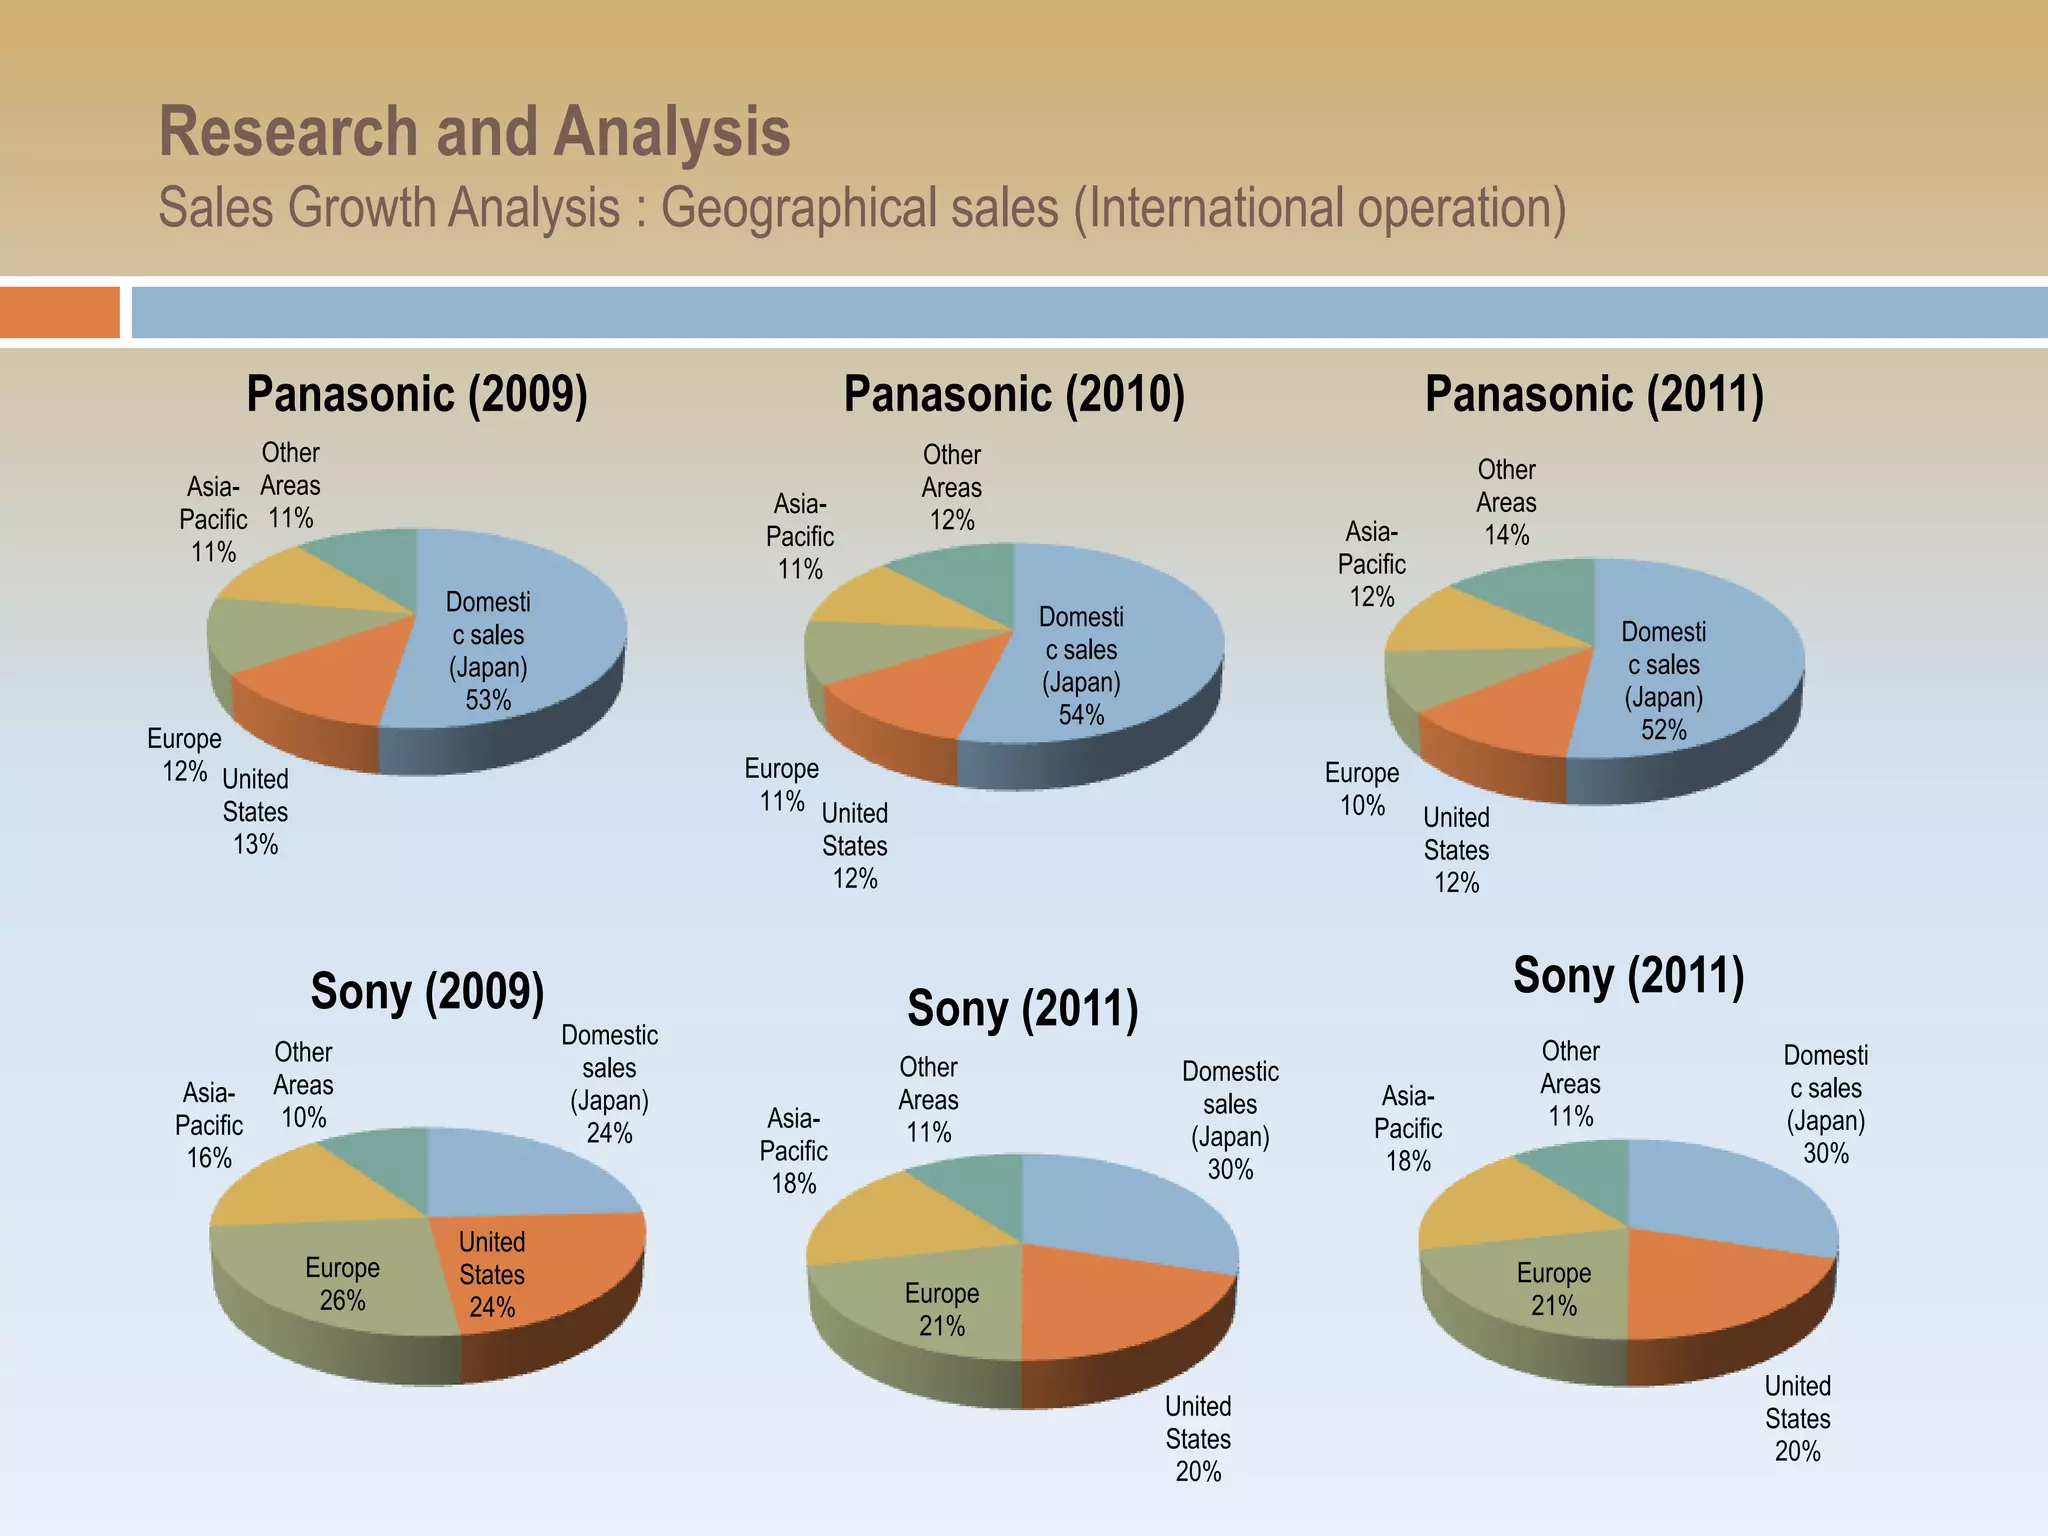
Analysis of year-over-year sales growth rates, seasonal trends, and geographical sales distribution for both companies.
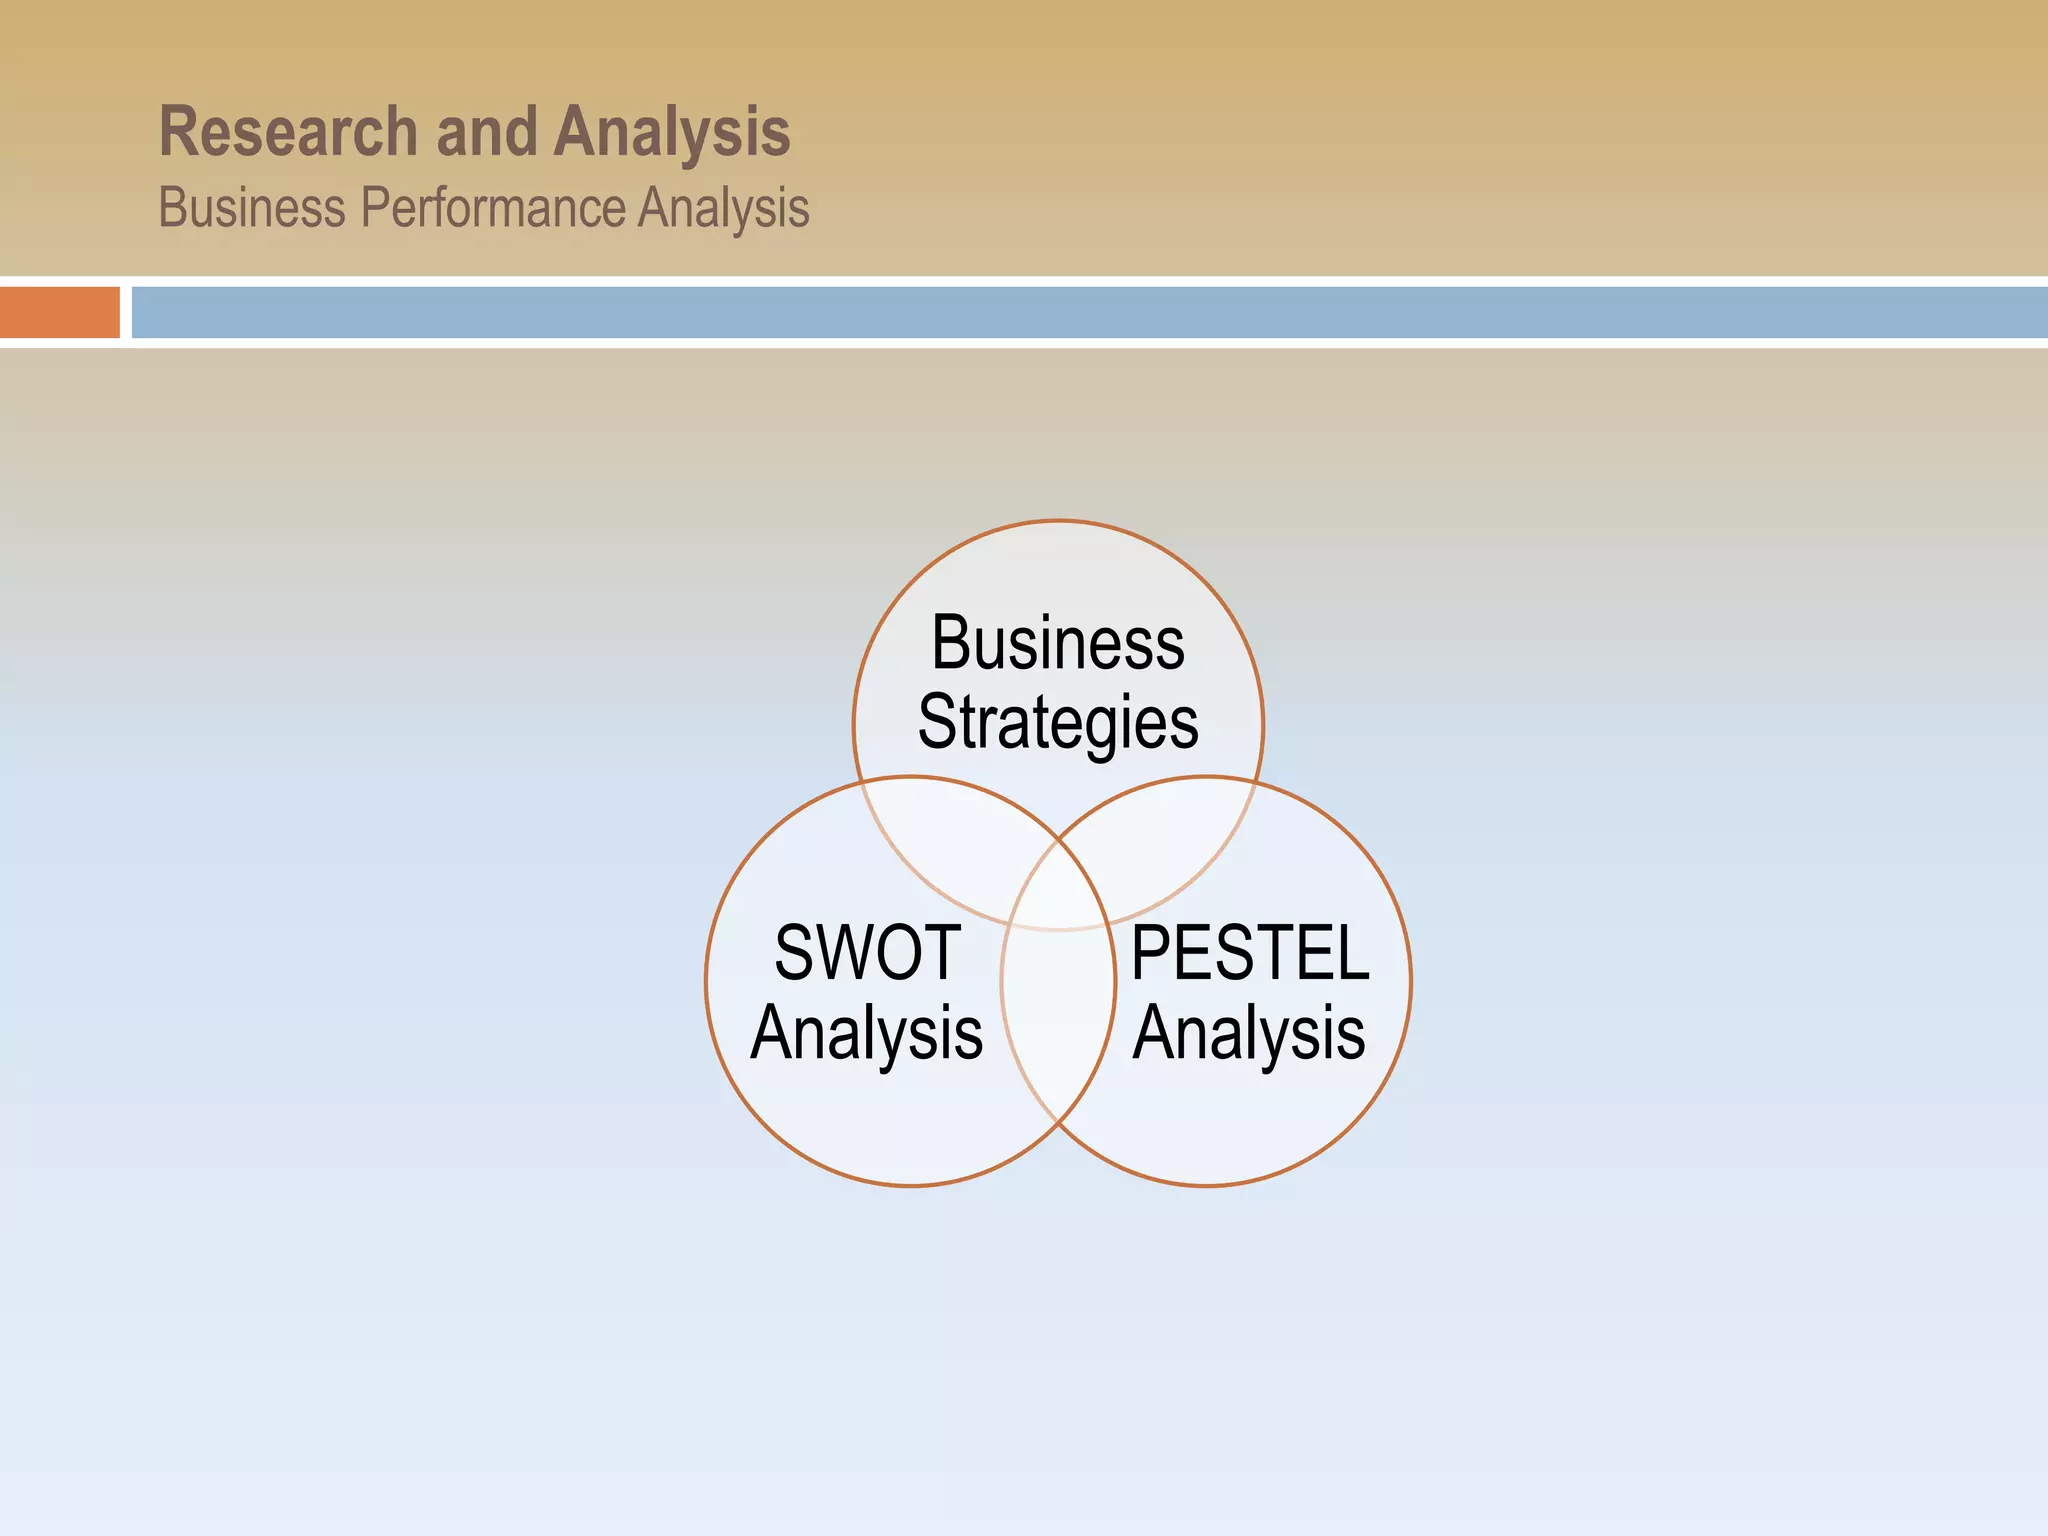
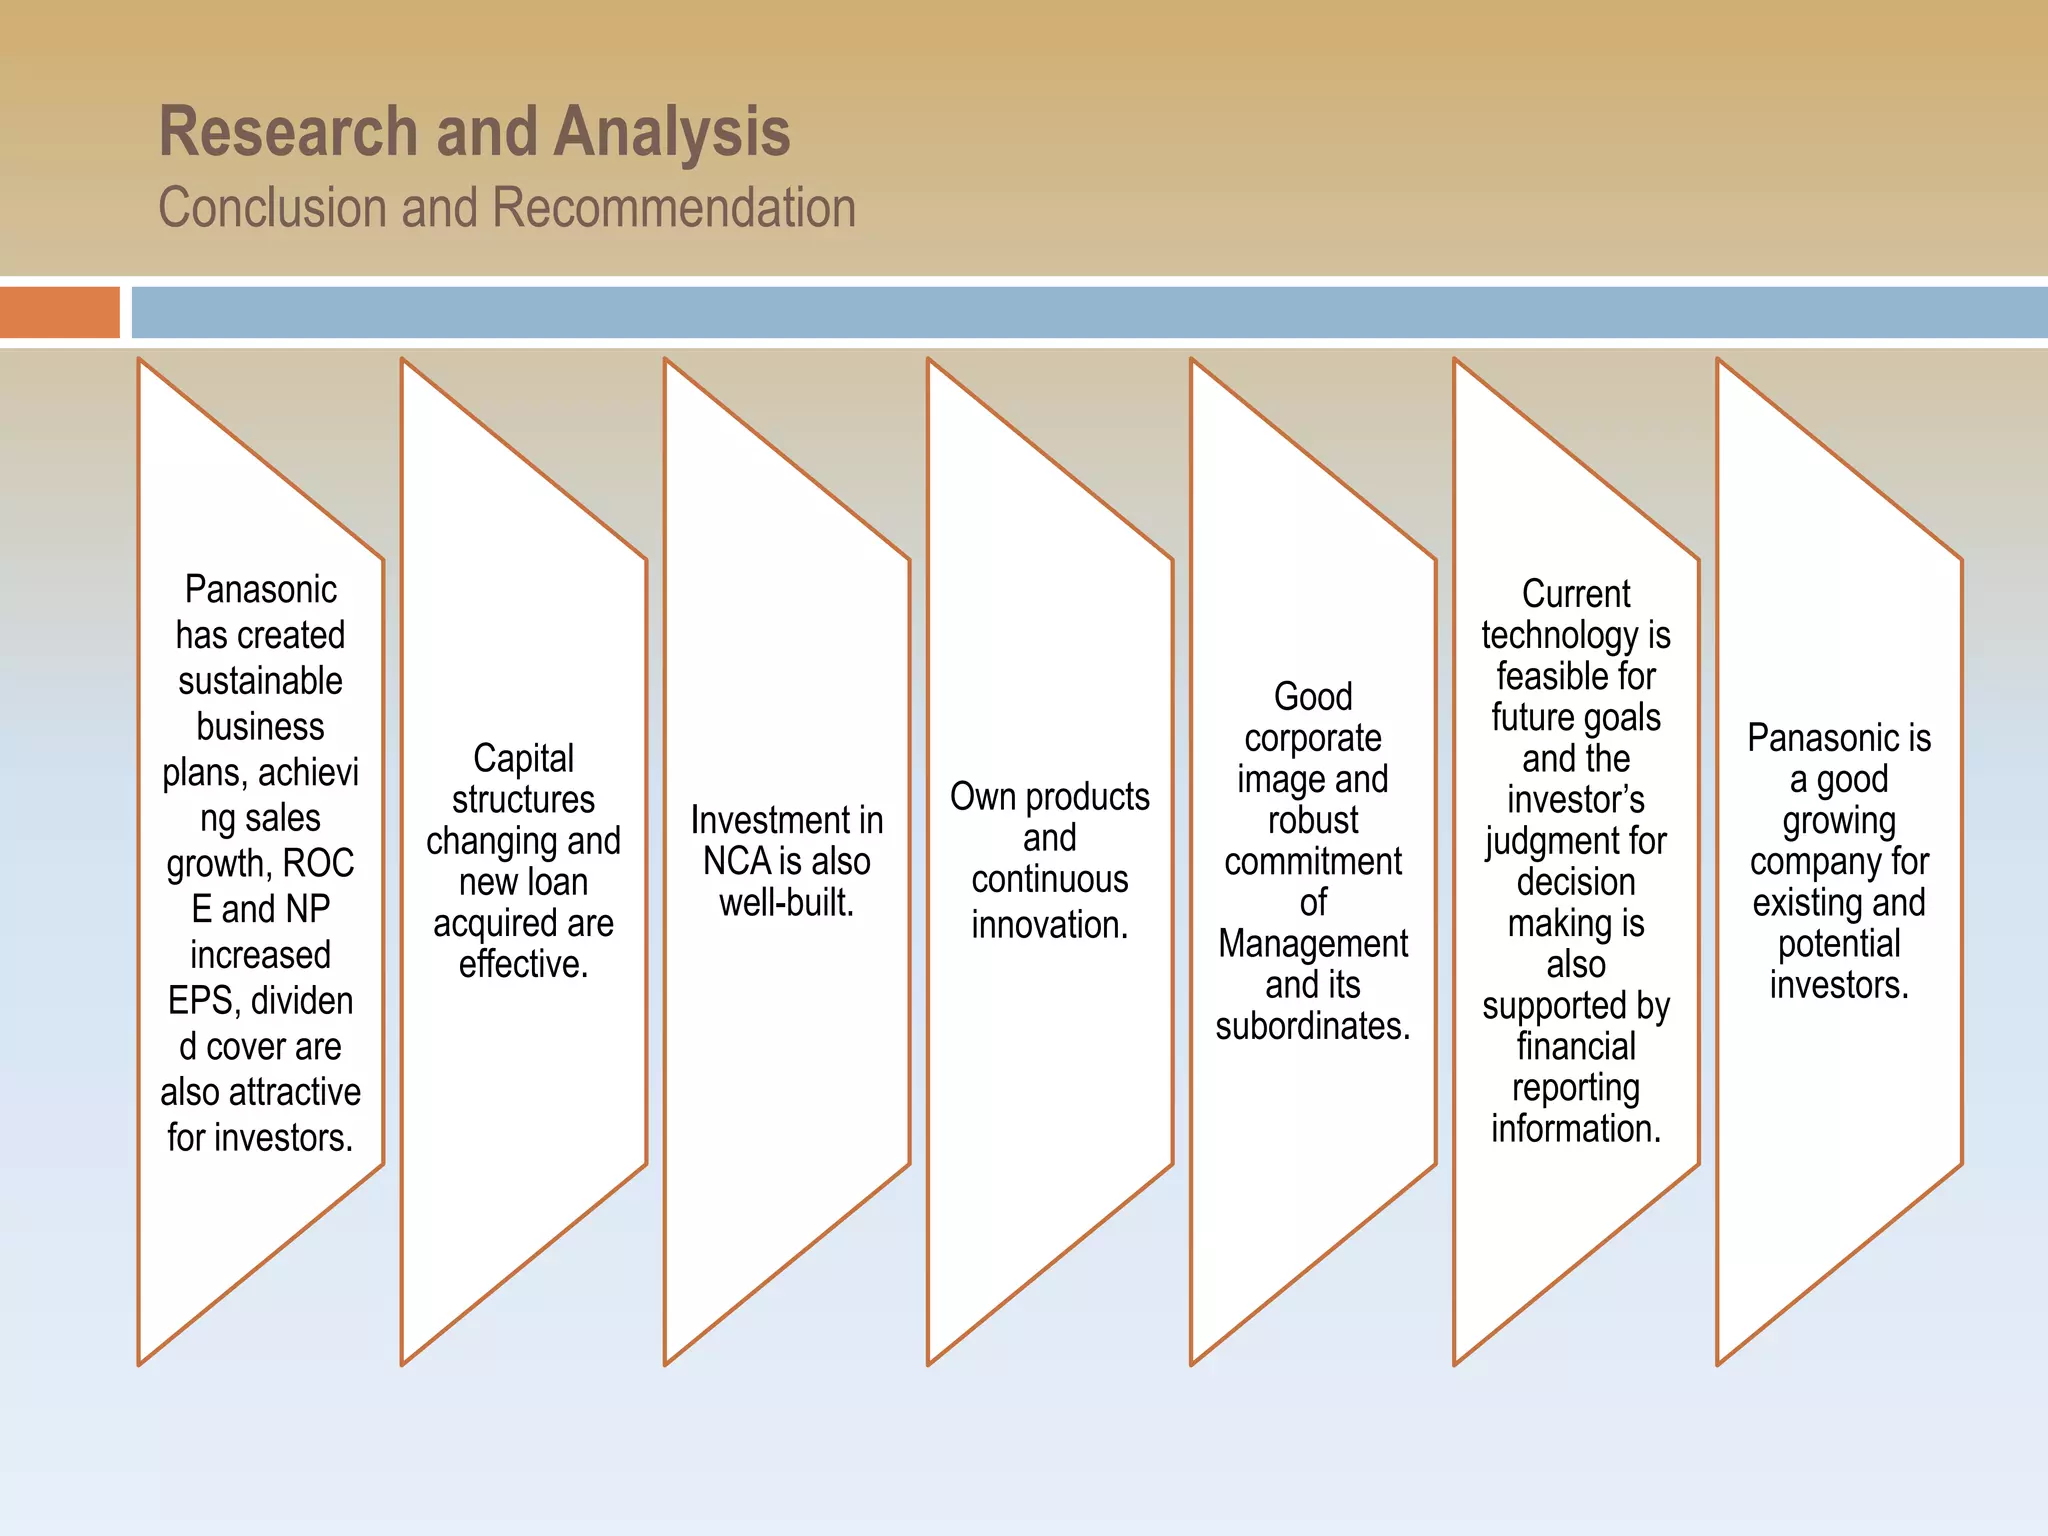
Discussion of business strategies employing SWOT and PESTEL analyses, with conclusions and recommendations for stakeholders.
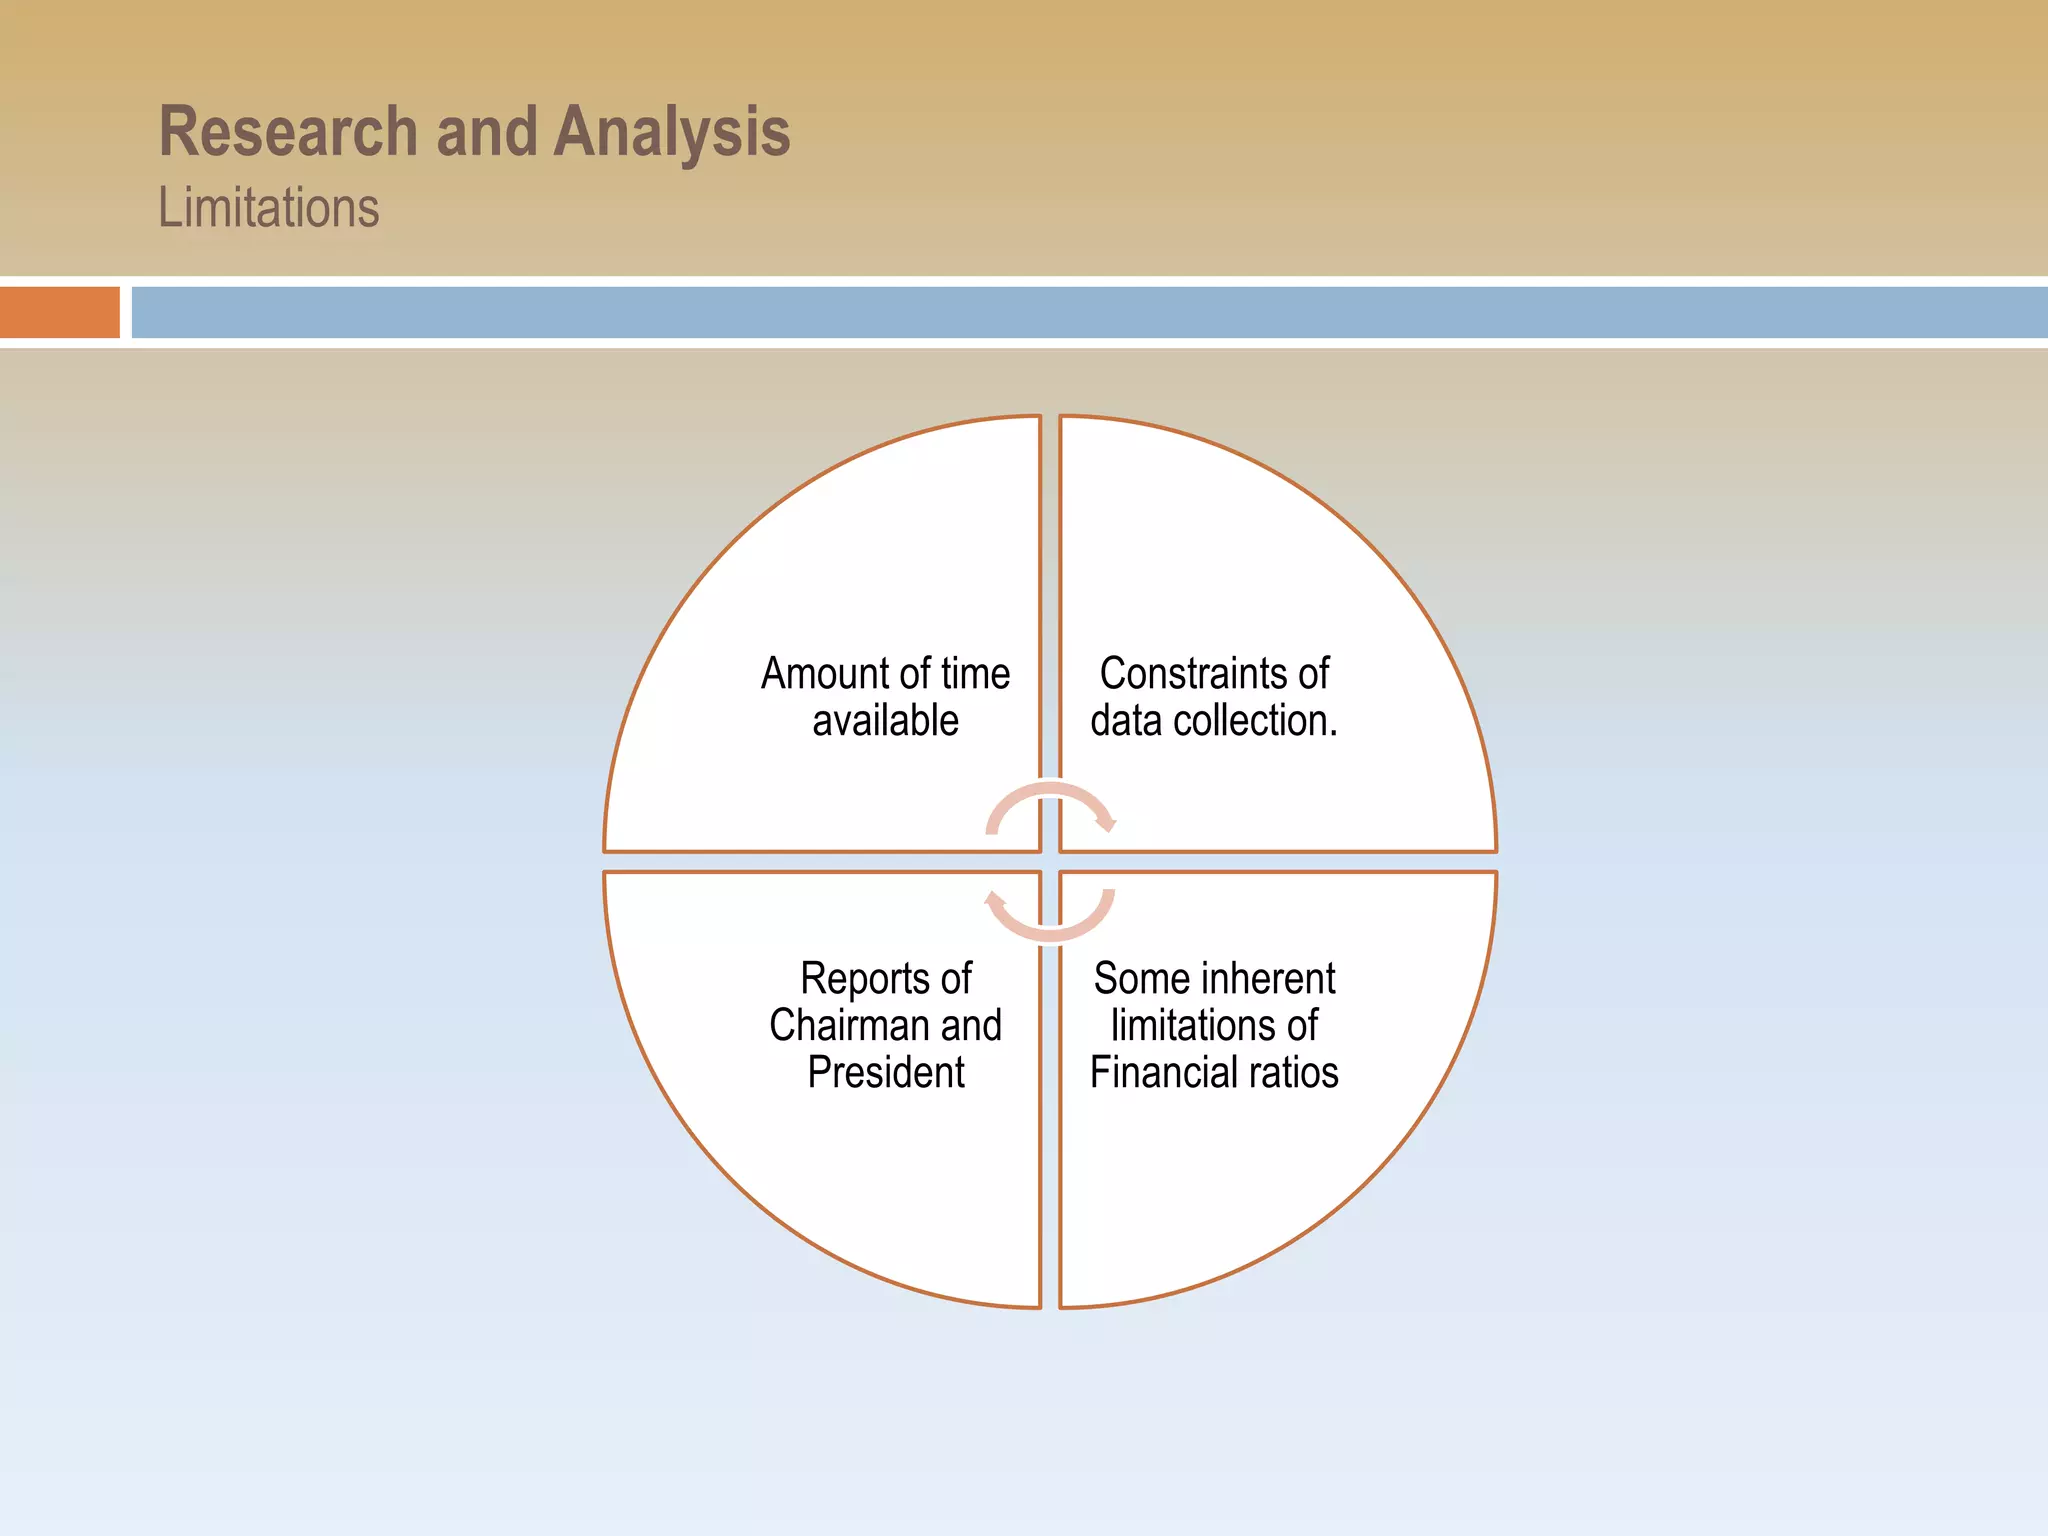
Acknowledgement of time constraints and limitations regarding data collection and financial ratios used in the analysis.
Final thank you slide concluding the presentation.


