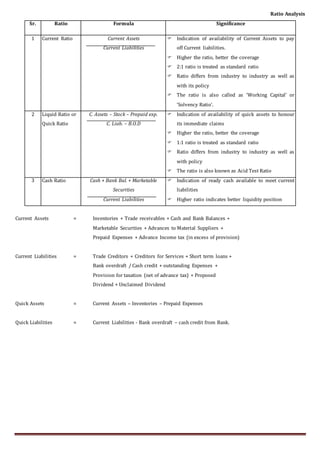
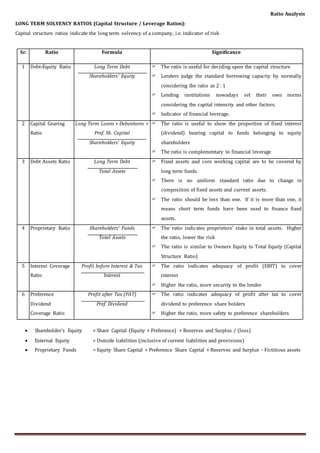
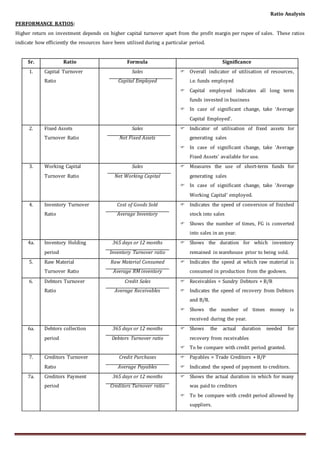
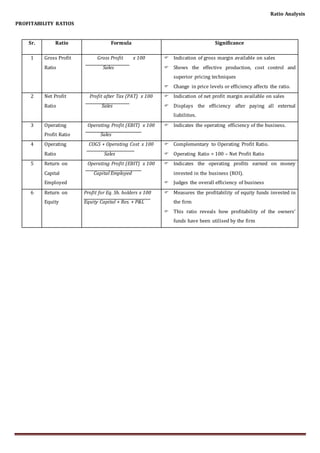
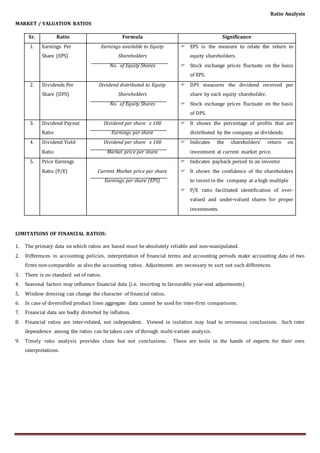
RATIO ANALYSIS
INTRODUCTION
‘Financial Statements Analysis’ means drawing meaningful understanding of financial statements for parties who require such
financial information. In this analysis user oriented approach is adopted instead of following the traditional proprietary
approach.
Traditionally and popularly the term ‘Financial Statements’ means Balance - Sheet and Profit & Loss Account. The term
financial statements is usually defined as, “statements that contain financial information”. It does not merely consist of
Annual Report, although for external users the major portion for the financial information comes from the annual report.
Generally, the financial statements are prepared for the proprietors and the accounting aids for stewardship function. In
recent years the concept of stewardship accounting has been changed for user oriented approach has emerged to fit the
purpose of recipients of financial information.
Prominent users are:
a) Owners or investors or shareholders
b) Creditors / debenture holders
c) Financial institutions / bankers
d) Trade unions / employees
e) Finance executives
f) Management
g) Government / regulating agencies
h) Economists / security analysts
Although all the above persons are interested in the financial information and operating results of an enterprise, the primary
information that each seeks to obtain from these statements differ materially. Investors are primarily interested in earning
capacity. Creditors (trade and financial) are primarily concerned with liquidity and ability to serve and redeem the debt
within a specified period. Management is interested in evolving analytical tools that will measure costs, operational efficiency,
liquidity and profitability with the objective of taking appropriate decisions.
Thus financial statement analysis is purposive and not necessarily comprehensive to cover all possible uses. The relationship
over the time may be a study of comparable firms at a particular time or it may be study of particular firm over a period of
time or it may cover both.
FINANCIAL RATIO ANALYSIS
Financial ratios measure relationship expressed in mathematical terms between figures which are connected with each other
in significant manner. A ratio is a statistical benchmark that provides a measure of relationship between two financial figures.
It is a process of determining, interpreting & presenting numerical relationships of items and group of items in the financial
statements.
Ratios are customarily presented in the following forms: The first is merely a quotient (Current Ratio, Proprietors Funds: Total
assets Ratio etc.) Sometimes ratios are also expressed as rates which refer to ratios over a period of time (fixed assets
turnover ratio, Inventory turnover ratio etc.) Some ratios are presented by per cent. (Gross Profit Ratio, ROI etc.)
Ratio Analysis
“Ratio analysis is a process of analysis of the ratios in such a manner, so that the management can take actions on off
standard performances.”
The process can be segregated into:
i) Working of Ratios
ii) Interpretation of Ratios
iii) Remedial actions on variance with the objective of improvement in efficiency.
Financial Ratios for Evaluating Performance:
a) Liquidity Position: With the help of ratio analysis one can draw conclusions regarding liquidity position of a firm. The
liquidity position of a firm would be satisfactory if it is able to meet its current obligations when they become due. A firm
can be said to have the ability to meet its short-term liabilities if it has sufficient liquid funds to pay the interest on its
short maturing debt usually within a year as well the principal. This ability is reflected in the liquidity ratios of a firm.
The liquidity ratios are particularly useful in credit analysis by banks and other suppliers of short-term loans.
b) Long-term Solvency: Ratio analysis is equally useful for assessing the long-term financial viability of a firm. This aspect
of the financial position of a borrower is of concern to the long term creditors, security analysts and the present and
potential owners of a business. The long term solvency is measured by the leverage /capital structure and profitability
ratios which focus on earning power and operating efficiency. Ratio analysis reveals the strengths and weaknesses of a
firm in this respect. The leverage ratios, for instance, will indicate whether a firm has a reasonable proportion of various
sources of finance or whether heavily loaded with debt in which case its solvency is exposed to serious strain. Similarly,
the various profitability ratios would reveal whether or not the firm is able to offer adequate return to its owners
consistent with the risk involved.
c) Operating Efficiency: Ratio analysis throws light on the degree of efficiency in the management and utilisation of its
assets. The various activity ratios measure this kind of operational efficiency. In fact, the solvency of a firm is, in the
ultimate analysis, dependent upon the sales revenues generated by the use of its assets - total as well as its components.
d) Overall Profitability: Unlike the outside parties which are interested in one aspect of the financial position of a firm, the
management is constantly concerned about the overall profitability of the enterprise. That is, they are concerned about
the ability of the firm to meet its short-term as well as long-term obligations to its creditors, to ensure a reasonable return
to its owners and secure optimum utilisation of the assets of the firm. This is possible if an integrated view is taken and
all the ratios are considered together.
e) Inter-firm Comparison: Ratio analysis not only throws light on the financial position of a firm but also serves as a
stepping stone to remedial measures. This is made possible due to inter-firm comparison / comparison with industry
averages. A single figure of particular ratio is meaningless unless it is related to some standard or norm. One of the
popular techniques is to compare the ratios of a firm with the industry average. It should be reasonably expected that the
performance of a firm should be in broad conformity with that of the industry to which it belongs. An inter-firm
comparison would demonstrate the relative position vis-à-vis its competitors. If the results are at variance either with the
industry average or with those of the competitors, the firm can seek to identify the probable reasons and, in the light, take
remedial measures.
Ratio Analysis
Ratios not only perform post mortem of operations, but also serve as barometer for future. Ratios have prediction value
and they are very helpful in forecasting and planning the business activities for a future. It helps in budgeting.
Conclusions are drawn on the basis of the analysis obtained by using ratio analysis. The decisions affected may be
whether to supply goods on credit to a concern, whether bank loans will be made available, etc.
f) Financial Ratios for Budgeting: In this field ratios are able to provide a great deal of assistance, budget is only an
estimate of future activity based on past experience, in the making of which the relationship between different spheres of
activities are invaluable. It is usually possible to estimate budgeted figures using financial ratios. Ratios also can be made
use of for measuring actual performance with budgeted estimates. They indicate directions in which adjustments should
be made either in the budget or in performance to bring them closer to each other.
CLASSIFICATION:
Ratios may be classified on the following basis:
1. Classification according to the statement from which ratios are derived —
a) Balance - Sheet Ratios
Balance Sheet ratios are those ratios, which use financial information only from the Balance Sheet of a company. For
example – Current Ratio, Debt-Equity Ratio, Capital Gearing Ratio etc
b) Income Statement Ratios
Income statement (P&L) ratios are those ratios, which use financial information only from the Income Statement or
Profit & Loss A/c of a company. For example – Net Profit Margin, Operating ratio etc
c) Combined / Composite Ratios
Combined or Composite ratios are those ratios, which use financial information from the Balance Sheet as well as the
Income statement. For example – Return on Capital Employed, Return on Equity, Fixed Asset Turnover Ratio etc.
2. Functional Classification –
a) Liquidity ratios – measures the ability of a company to meet its short-term financial obligations. They measure the
short-term solvency of a company.
b) Long Term Solvency ratios – also known as Leverage Ratios. They measure the long-term solvency of a company. They
measure the leverage undertaken by the company, thereby showing the risk taken by the company.
c) Performance Ratios – also known as activity ratios or turnover ratios or velocity ratios. They measure a company’s
efficiency in utilization of its resources. They measure the performance of individual departments and facilitate fixing
responsibilities.
d) Profitability ratios – measure the firm’s profit making ability. They indicate the effectiveness of company in converting
funds into profits.
e) Market Ratios – used by investors to measure the market standing of a company.
LIQUIDITY RATIOS
Liquidity or Short term solvency means ability of the business to pay its short term liabilities. Inability to pay short term
liabilities affects its creditability as well as its credit rating, continuous default on the part of the business leads to bankruptcy.
Eventually bankruptcy leads to sickness and liquidation. Cash position ratios may be supplemented for liquidity appraisal .
Ratio Analysis
Sr. Ratio Formula Significance
1 Current Ratio Current Assets
Current Liabilities
 Indication of availability of Current Assets to pay
off Current liabilities.
 Higher the ratio, better the coverage
 2:1 ratio is treated as standard ratio
 Ratio differs from industry to industry as well as
with its policy
 The ratio is also called as ‘Working Capital’ or
‘Solvency Ratio’.
2 Liquid Ratio or
Quick Ratio
C. Assets – Stock – Prepaid exp.
C. Liab. – B.O.D
 Indication of availability of quick assets to honour
its immediate claims
 Higher the ratio, better the coverage
 1:1 ratio is treated as standard ratio
 Ratio differs from industry to industry as well as
with policy
 The ratio is also known as Acid Test Ratio
3 Cash Ratio Cash + Bank Bal. + Marketable
Securities
Current Liabilities
 Indication of ready cash available to meet current
liabilities
 Higher ratio indicates better liquidity position
Current Assets = Inventories + Trade receivables + Cash and Bank Balances +
Marketable Securities + Advances to Material Suppliers +
Prepaid Expenses + Advance Income tax (in excess of provision)
Current Liabilities = Trade Creditors + Creditors for Services + Short term loans +
Bank overdraft / Cash credit + outstanding Expenses +
Provision for taxation (net of advance tax) + Proposed
Dividend + Unclaimed Dividend
Quick Assets = Current Assets – Inventories – Prepaid Expenses
Quick Liabilities = Current Liabilities - Bank overdraft – cash credit from Bank.
Ratio Analysis
LONG TERM SOLVENCY RATIOS (Capital Structure / Leverage Ratios):
Capital structure ratios indicate the long term solvency of a company, i.e. indicator of risk
Sr. Ratio Formula Significance
1 Debt-Equity Ratio Long Term Debt
Shareholders’ Equity
 The ratio is useful for deciding upon the capital structure
 Lenders judge the standard borrowing capacity by normally
considering the ratio as 2 : 1
 Lending institutions nowadays set their own norms
considering the capital intensity and other factors.
 Indicator of financial leverage.
2 Capital Gearing
Ratio
Long Term Loans + Debentures +
Pref. Sh. Capital
Shareholders’ Equity
 The ratio is useful to show the proportion of fixed interest
(dividend) bearing capital to funds belonging to equity
shareholders
 The ratio is complementary to financial leverage
3 Debt Assets Ratio Long Term Debt
Total Assets
 Fixed assets and core working capital are to be covered by
long term funds.
 There is no uniform standard ratio due to change in
composition of fixed assets and current assets.
 The ratio should be less than one. If it is more than one, it
means short term funds have been used to finance fixed
assets.
4 Proprietary Ratio Shareholders’ Funds
Total Assets
 The ratio indicates proprietors’ stake in total assets. Higher
the ratio, lower the risk
 The ratio is similar to Owners Equity to Total Equity (Capital
Structure Ratio)
5 Interest Coverage
Ratio
Profit before Interest & Tax
Interest
 The ratio indicates adequacy of profit (EBIT) to cover
interest
 Higher the ratio, more security to the lender
6 Preference
Dividend
Coverage Ratio
Profit after Tax (PAT)
Pref. Dividend
 The ratio indicates adequacy of profit after tax to cover
dividend to preference share holders
 Higher the ratio, more safety to preference shareholders
 Shareholder’s Equity = Share Capital (Equity + Preference) + Reserves and Surplus / (loss)
 External Equity = Outside liabilities (inclusive of current liabilities and provisions)
 Proprietary Funds = Equity Share Capital + Preference Share Capital + Reserves and Surplus - Fictitious assets
Ratio Analysis
PERFORMANCE RATIOS:
Higher return on investment depends on higher capital turnover apart from the profit margin per rupee of sales. These ratios
indicate how efficiently the resources have been utilised during a particular period.
Sr. Ratio Formula Significance
1. Capital Turnover
Ratio
Sales
Capital Employed
 Overall indicator of utilisation of resources,
i.e. funds employed
 Capital employed indicates all long term
funds invested in business
 In case of significant change, take ‘Average
Capital Employed’.
2. Fixed Assets
Turnover Ratio
Sales
Net Fixed Assets
 Indicator of utilisation of fixed assets for
generating sales
 In case of significant change, take ‘Average
Fixed Assets’ available for use.
3. Working Capital
Turnover Ratio
Sales
Net Working Capital
 Measures the use of short-term funds for
generating sales
 In case of significant change, take ‘Average
Working Capital’ employed.
4. Inventory Turnover
Ratio
Cost of Goods Sold
Average Inventory
 Indicates the speed of conversion of finished
stock into sales
 Shows the number of times, FG is converted
into sales in an year.
4a. Inventory Holding
period
365 days or 12 months
Inventory Turnover ratio
 Shows the duration for which inventory
remained in warehouse prior to being sold.
5. Raw Material
Turnover Ratio
Raw Material Consumed
Average RM inventory
 Indicates the speed at which raw material is
consumed in production from the godown.
6. Debtors Turnover
Ratio
Credit Sales
Average Receivables
 Receivables = Sundry Debtors + B/R
 Indicates the speed of recovery from Debtors
and B/R.
 Shows the number of times money is
received during the year.
6a. Debtors collection
period
365 days or 12 months
Debtors Turnover ratio
 Shows the actual duration needed for
recovery from receivables
 To be compare with credit period granted.
7. Creditors Turnover
Ratio
Credit Purchases
Average Payables
 Payables = Trade Creditors + B/P
 Indicated the speed of payment to creditors.
7a. Creditors Payment
period
365 days or 12 months
Creditors Turnover ratio
 Shows the actual duration in which for many
was paid to creditors
 To be compare with credit period allowed by
suppliers.
Ratio Analysis
PROFITABILITY RATIOS
Sr. Ratio Formula Significance
1 Gross Profit
Ratio
Gross Profit x 100
Sales
 Indication of gross margin available on sales
 Shows the effective production, cost control and
superior pricing techniques
 Change in price levels or efficiency affects the ratio.
2 Net Profit
Ratio
Profit after Tax (PAT) x 100
Sales
 Indication of net profit margin available on sales
 Displays the efficiency after paying all external
liabilities.
3 Operating
Profit Ratio
Operating Profit (EBIT) x 100
Sales
 Indicates the operating efficiency of the business.
4 Operating
Ratio
COGS + Operating Cost x 100
Sales
 Complementary to Operating Profit Ratio.
 Operating Ratio = 100 – Net Profit Ratio
5 Return on
Capital
Employed
Operating Profit (EBIT) x 100
Capital Employed
 Indicates the operating profits earned on money
invested in the business (ROI).
 Judges the overall efficiency of business
6 Return on
Equity
Profit for Eq. Sh. holders x 100
Equity Capital + Res. + P&L
 Measures the profitability of equity funds invested in
the firm
 This ratio reveals how profitability of the owners’
funds have been utilised by the firm
Ratio Analysis
MARKET / VALUATION RATIOS
Sr. Ratio Formula Significance
1. Earnings Per
Share (EPS)
Earnings available to Equity
Shareholders
No. of Equity Shares
 EPS is the measure to relate the return to
equity shareholders.
 Stock exchange prices fluctuate on the basis
of EPS.
2. Dividends Per
Share (DPS)
Dividend distributed to Equity
Shareholders
No. of Equity Shares
 DPS measures the dividend received per
share by each equity shareholder.
 Stock exchange prices fluctuate on the basis
of DPS.
3. Dividend Payout
Ratio
Dividend per share x 100
Earnings per share
 It shows the percentage of profits that are
distributed by the company as dividends.
4. Dividend Yield
Ratio
Dividend per share x 100
Market price per share
 Indicates the shareholders’ return on
investment at current market price.
5. Price Earnings
Ratio (P/E) Current Market price per share
Earnings per share (EPS)
 Indicates payback period to an investor
 It shows the confidence of the shareholders
to invest in the company at a high multiple
 P/E ratio facilitated identification of over-
valued and under-valued shares for proper
investments.
LIMITATIONS OF FINANCIAL RATIOS:
1. The primary data on which ratios are based must be absolutely reliable and non-manipulated.
2. Differences in accounting policies, interpretation of financial terms and accounting periods make accounting data of two
firms non-comparable as also the accounting ratios. Adjustments are necessary to sort out such differences.
3. There is no standard set of ratios.
4. Seasonal factors may influence financial data (i.e. resorting to favourable year-end adjustments)
5. Window dressing can change the character of financial ratios.
6. In case of diversified product lines aggregate data cannot be used for inter-firm comparisons.
7. Financial data are badly distorted by inflation.
8. Financial ratios are inter-related, not independent. Viewed in isolation may lead to erroneous conclusions. Such inter
dependence among the ratios can be taken care of through multi-variate analysis.
9. Timely ratio analysis provides clues but not conclusions. These are tools in the hands of experts for their own
interpretations.

Cs ratio analysis

  • 1.
    RATIO ANALYSIS INTRODUCTION ‘Financial StatementsAnalysis’ means drawing meaningful understanding of financial statements for parties who require such financial information. In this analysis user oriented approach is adopted instead of following the traditional proprietary approach. Traditionally and popularly the term ‘Financial Statements’ means Balance - Sheet and Profit & Loss Account. The term financial statements is usually defined as, “statements that contain financial information”. It does not merely consist of Annual Report, although for external users the major portion for the financial information comes from the annual report. Generally, the financial statements are prepared for the proprietors and the accounting aids for stewardship function. In recent years the concept of stewardship accounting has been changed for user oriented approach has emerged to fit the purpose of recipients of financial information. Prominent users are: a) Owners or investors or shareholders b) Creditors / debenture holders c) Financial institutions / bankers d) Trade unions / employees e) Finance executives f) Management g) Government / regulating agencies h) Economists / security analysts Although all the above persons are interested in the financial information and operating results of an enterprise, the primary information that each seeks to obtain from these statements differ materially. Investors are primarily interested in earning capacity. Creditors (trade and financial) are primarily concerned with liquidity and ability to serve and redeem the debt within a specified period. Management is interested in evolving analytical tools that will measure costs, operational efficiency, liquidity and profitability with the objective of taking appropriate decisions. Thus financial statement analysis is purposive and not necessarily comprehensive to cover all possible uses. The relationship over the time may be a study of comparable firms at a particular time or it may be study of particular firm over a period of time or it may cover both. FINANCIAL RATIO ANALYSIS Financial ratios measure relationship expressed in mathematical terms between figures which are connected with each other in significant manner. A ratio is a statistical benchmark that provides a measure of relationship between two financial figures. It is a process of determining, interpreting & presenting numerical relationships of items and group of items in the financial statements. Ratios are customarily presented in the following forms: The first is merely a quotient (Current Ratio, Proprietors Funds: Total assets Ratio etc.) Sometimes ratios are also expressed as rates which refer to ratios over a period of time (fixed assets turnover ratio, Inventory turnover ratio etc.) Some ratios are presented by per cent. (Gross Profit Ratio, ROI etc.)
  • 2.
    Ratio Analysis “Ratio analysisis a process of analysis of the ratios in such a manner, so that the management can take actions on off standard performances.” The process can be segregated into: i) Working of Ratios ii) Interpretation of Ratios iii) Remedial actions on variance with the objective of improvement in efficiency. Financial Ratios for Evaluating Performance: a) Liquidity Position: With the help of ratio analysis one can draw conclusions regarding liquidity position of a firm. The liquidity position of a firm would be satisfactory if it is able to meet its current obligations when they become due. A firm can be said to have the ability to meet its short-term liabilities if it has sufficient liquid funds to pay the interest on its short maturing debt usually within a year as well the principal. This ability is reflected in the liquidity ratios of a firm. The liquidity ratios are particularly useful in credit analysis by banks and other suppliers of short-term loans. b) Long-term Solvency: Ratio analysis is equally useful for assessing the long-term financial viability of a firm. This aspect of the financial position of a borrower is of concern to the long term creditors, security analysts and the present and potential owners of a business. The long term solvency is measured by the leverage /capital structure and profitability ratios which focus on earning power and operating efficiency. Ratio analysis reveals the strengths and weaknesses of a firm in this respect. The leverage ratios, for instance, will indicate whether a firm has a reasonable proportion of various sources of finance or whether heavily loaded with debt in which case its solvency is exposed to serious strain. Similarly, the various profitability ratios would reveal whether or not the firm is able to offer adequate return to its owners consistent with the risk involved. c) Operating Efficiency: Ratio analysis throws light on the degree of efficiency in the management and utilisation of its assets. The various activity ratios measure this kind of operational efficiency. In fact, the solvency of a firm is, in the ultimate analysis, dependent upon the sales revenues generated by the use of its assets - total as well as its components. d) Overall Profitability: Unlike the outside parties which are interested in one aspect of the financial position of a firm, the management is constantly concerned about the overall profitability of the enterprise. That is, they are concerned about the ability of the firm to meet its short-term as well as long-term obligations to its creditors, to ensure a reasonable return to its owners and secure optimum utilisation of the assets of the firm. This is possible if an integrated view is taken and all the ratios are considered together. e) Inter-firm Comparison: Ratio analysis not only throws light on the financial position of a firm but also serves as a stepping stone to remedial measures. This is made possible due to inter-firm comparison / comparison with industry averages. A single figure of particular ratio is meaningless unless it is related to some standard or norm. One of the popular techniques is to compare the ratios of a firm with the industry average. It should be reasonably expected that the performance of a firm should be in broad conformity with that of the industry to which it belongs. An inter-firm comparison would demonstrate the relative position vis-à-vis its competitors. If the results are at variance either with the industry average or with those of the competitors, the firm can seek to identify the probable reasons and, in the light, take remedial measures.
  • 3.
    Ratio Analysis Ratios notonly perform post mortem of operations, but also serve as barometer for future. Ratios have prediction value and they are very helpful in forecasting and planning the business activities for a future. It helps in budgeting. Conclusions are drawn on the basis of the analysis obtained by using ratio analysis. The decisions affected may be whether to supply goods on credit to a concern, whether bank loans will be made available, etc. f) Financial Ratios for Budgeting: In this field ratios are able to provide a great deal of assistance, budget is only an estimate of future activity based on past experience, in the making of which the relationship between different spheres of activities are invaluable. It is usually possible to estimate budgeted figures using financial ratios. Ratios also can be made use of for measuring actual performance with budgeted estimates. They indicate directions in which adjustments should be made either in the budget or in performance to bring them closer to each other. CLASSIFICATION: Ratios may be classified on the following basis: 1. Classification according to the statement from which ratios are derived — a) Balance - Sheet Ratios Balance Sheet ratios are those ratios, which use financial information only from the Balance Sheet of a company. For example – Current Ratio, Debt-Equity Ratio, Capital Gearing Ratio etc b) Income Statement Ratios Income statement (P&L) ratios are those ratios, which use financial information only from the Income Statement or Profit & Loss A/c of a company. For example – Net Profit Margin, Operating ratio etc c) Combined / Composite Ratios Combined or Composite ratios are those ratios, which use financial information from the Balance Sheet as well as the Income statement. For example – Return on Capital Employed, Return on Equity, Fixed Asset Turnover Ratio etc. 2. Functional Classification – a) Liquidity ratios – measures the ability of a company to meet its short-term financial obligations. They measure the short-term solvency of a company. b) Long Term Solvency ratios – also known as Leverage Ratios. They measure the long-term solvency of a company. They measure the leverage undertaken by the company, thereby showing the risk taken by the company. c) Performance Ratios – also known as activity ratios or turnover ratios or velocity ratios. They measure a company’s efficiency in utilization of its resources. They measure the performance of individual departments and facilitate fixing responsibilities. d) Profitability ratios – measure the firm’s profit making ability. They indicate the effectiveness of company in converting funds into profits. e) Market Ratios – used by investors to measure the market standing of a company. LIQUIDITY RATIOS Liquidity or Short term solvency means ability of the business to pay its short term liabilities. Inability to pay short term liabilities affects its creditability as well as its credit rating, continuous default on the part of the business leads to bankruptcy. Eventually bankruptcy leads to sickness and liquidation. Cash position ratios may be supplemented for liquidity appraisal .
  • 4.
    Ratio Analysis Sr. RatioFormula Significance 1 Current Ratio Current Assets Current Liabilities  Indication of availability of Current Assets to pay off Current liabilities.  Higher the ratio, better the coverage  2:1 ratio is treated as standard ratio  Ratio differs from industry to industry as well as with its policy  The ratio is also called as ‘Working Capital’ or ‘Solvency Ratio’. 2 Liquid Ratio or Quick Ratio C. Assets – Stock – Prepaid exp. C. Liab. – B.O.D  Indication of availability of quick assets to honour its immediate claims  Higher the ratio, better the coverage  1:1 ratio is treated as standard ratio  Ratio differs from industry to industry as well as with policy  The ratio is also known as Acid Test Ratio 3 Cash Ratio Cash + Bank Bal. + Marketable Securities Current Liabilities  Indication of ready cash available to meet current liabilities  Higher ratio indicates better liquidity position Current Assets = Inventories + Trade receivables + Cash and Bank Balances + Marketable Securities + Advances to Material Suppliers + Prepaid Expenses + Advance Income tax (in excess of provision) Current Liabilities = Trade Creditors + Creditors for Services + Short term loans + Bank overdraft / Cash credit + outstanding Expenses + Provision for taxation (net of advance tax) + Proposed Dividend + Unclaimed Dividend Quick Assets = Current Assets – Inventories – Prepaid Expenses Quick Liabilities = Current Liabilities - Bank overdraft – cash credit from Bank.
  • 5.
    Ratio Analysis LONG TERMSOLVENCY RATIOS (Capital Structure / Leverage Ratios): Capital structure ratios indicate the long term solvency of a company, i.e. indicator of risk Sr. Ratio Formula Significance 1 Debt-Equity Ratio Long Term Debt Shareholders’ Equity  The ratio is useful for deciding upon the capital structure  Lenders judge the standard borrowing capacity by normally considering the ratio as 2 : 1  Lending institutions nowadays set their own norms considering the capital intensity and other factors.  Indicator of financial leverage. 2 Capital Gearing Ratio Long Term Loans + Debentures + Pref. Sh. Capital Shareholders’ Equity  The ratio is useful to show the proportion of fixed interest (dividend) bearing capital to funds belonging to equity shareholders  The ratio is complementary to financial leverage 3 Debt Assets Ratio Long Term Debt Total Assets  Fixed assets and core working capital are to be covered by long term funds.  There is no uniform standard ratio due to change in composition of fixed assets and current assets.  The ratio should be less than one. If it is more than one, it means short term funds have been used to finance fixed assets. 4 Proprietary Ratio Shareholders’ Funds Total Assets  The ratio indicates proprietors’ stake in total assets. Higher the ratio, lower the risk  The ratio is similar to Owners Equity to Total Equity (Capital Structure Ratio) 5 Interest Coverage Ratio Profit before Interest & Tax Interest  The ratio indicates adequacy of profit (EBIT) to cover interest  Higher the ratio, more security to the lender 6 Preference Dividend Coverage Ratio Profit after Tax (PAT) Pref. Dividend  The ratio indicates adequacy of profit after tax to cover dividend to preference share holders  Higher the ratio, more safety to preference shareholders  Shareholder’s Equity = Share Capital (Equity + Preference) + Reserves and Surplus / (loss)  External Equity = Outside liabilities (inclusive of current liabilities and provisions)  Proprietary Funds = Equity Share Capital + Preference Share Capital + Reserves and Surplus - Fictitious assets
  • 6.
    Ratio Analysis PERFORMANCE RATIOS: Higherreturn on investment depends on higher capital turnover apart from the profit margin per rupee of sales. These ratios indicate how efficiently the resources have been utilised during a particular period. Sr. Ratio Formula Significance 1. Capital Turnover Ratio Sales Capital Employed  Overall indicator of utilisation of resources, i.e. funds employed  Capital employed indicates all long term funds invested in business  In case of significant change, take ‘Average Capital Employed’. 2. Fixed Assets Turnover Ratio Sales Net Fixed Assets  Indicator of utilisation of fixed assets for generating sales  In case of significant change, take ‘Average Fixed Assets’ available for use. 3. Working Capital Turnover Ratio Sales Net Working Capital  Measures the use of short-term funds for generating sales  In case of significant change, take ‘Average Working Capital’ employed. 4. Inventory Turnover Ratio Cost of Goods Sold Average Inventory  Indicates the speed of conversion of finished stock into sales  Shows the number of times, FG is converted into sales in an year. 4a. Inventory Holding period 365 days or 12 months Inventory Turnover ratio  Shows the duration for which inventory remained in warehouse prior to being sold. 5. Raw Material Turnover Ratio Raw Material Consumed Average RM inventory  Indicates the speed at which raw material is consumed in production from the godown. 6. Debtors Turnover Ratio Credit Sales Average Receivables  Receivables = Sundry Debtors + B/R  Indicates the speed of recovery from Debtors and B/R.  Shows the number of times money is received during the year. 6a. Debtors collection period 365 days or 12 months Debtors Turnover ratio  Shows the actual duration needed for recovery from receivables  To be compare with credit period granted. 7. Creditors Turnover Ratio Credit Purchases Average Payables  Payables = Trade Creditors + B/P  Indicated the speed of payment to creditors. 7a. Creditors Payment period 365 days or 12 months Creditors Turnover ratio  Shows the actual duration in which for many was paid to creditors  To be compare with credit period allowed by suppliers.
  • 7.
    Ratio Analysis PROFITABILITY RATIOS Sr.Ratio Formula Significance 1 Gross Profit Ratio Gross Profit x 100 Sales  Indication of gross margin available on sales  Shows the effective production, cost control and superior pricing techniques  Change in price levels or efficiency affects the ratio. 2 Net Profit Ratio Profit after Tax (PAT) x 100 Sales  Indication of net profit margin available on sales  Displays the efficiency after paying all external liabilities. 3 Operating Profit Ratio Operating Profit (EBIT) x 100 Sales  Indicates the operating efficiency of the business. 4 Operating Ratio COGS + Operating Cost x 100 Sales  Complementary to Operating Profit Ratio.  Operating Ratio = 100 – Net Profit Ratio 5 Return on Capital Employed Operating Profit (EBIT) x 100 Capital Employed  Indicates the operating profits earned on money invested in the business (ROI).  Judges the overall efficiency of business 6 Return on Equity Profit for Eq. Sh. holders x 100 Equity Capital + Res. + P&L  Measures the profitability of equity funds invested in the firm  This ratio reveals how profitability of the owners’ funds have been utilised by the firm
  • 8.
    Ratio Analysis MARKET /VALUATION RATIOS Sr. Ratio Formula Significance 1. Earnings Per Share (EPS) Earnings available to Equity Shareholders No. of Equity Shares  EPS is the measure to relate the return to equity shareholders.  Stock exchange prices fluctuate on the basis of EPS. 2. Dividends Per Share (DPS) Dividend distributed to Equity Shareholders No. of Equity Shares  DPS measures the dividend received per share by each equity shareholder.  Stock exchange prices fluctuate on the basis of DPS. 3. Dividend Payout Ratio Dividend per share x 100 Earnings per share  It shows the percentage of profits that are distributed by the company as dividends. 4. Dividend Yield Ratio Dividend per share x 100 Market price per share  Indicates the shareholders’ return on investment at current market price. 5. Price Earnings Ratio (P/E) Current Market price per share Earnings per share (EPS)  Indicates payback period to an investor  It shows the confidence of the shareholders to invest in the company at a high multiple  P/E ratio facilitated identification of over- valued and under-valued shares for proper investments. LIMITATIONS OF FINANCIAL RATIOS: 1. The primary data on which ratios are based must be absolutely reliable and non-manipulated. 2. Differences in accounting policies, interpretation of financial terms and accounting periods make accounting data of two firms non-comparable as also the accounting ratios. Adjustments are necessary to sort out such differences. 3. There is no standard set of ratios. 4. Seasonal factors may influence financial data (i.e. resorting to favourable year-end adjustments) 5. Window dressing can change the character of financial ratios. 6. In case of diversified product lines aggregate data cannot be used for inter-firm comparisons. 7. Financial data are badly distorted by inflation. 8. Financial ratios are inter-related, not independent. Viewed in isolation may lead to erroneous conclusions. Such inter dependence among the ratios can be taken care of through multi-variate analysis. 9. Timely ratio analysis provides clues but not conclusions. These are tools in the hands of experts for their own interpretations.