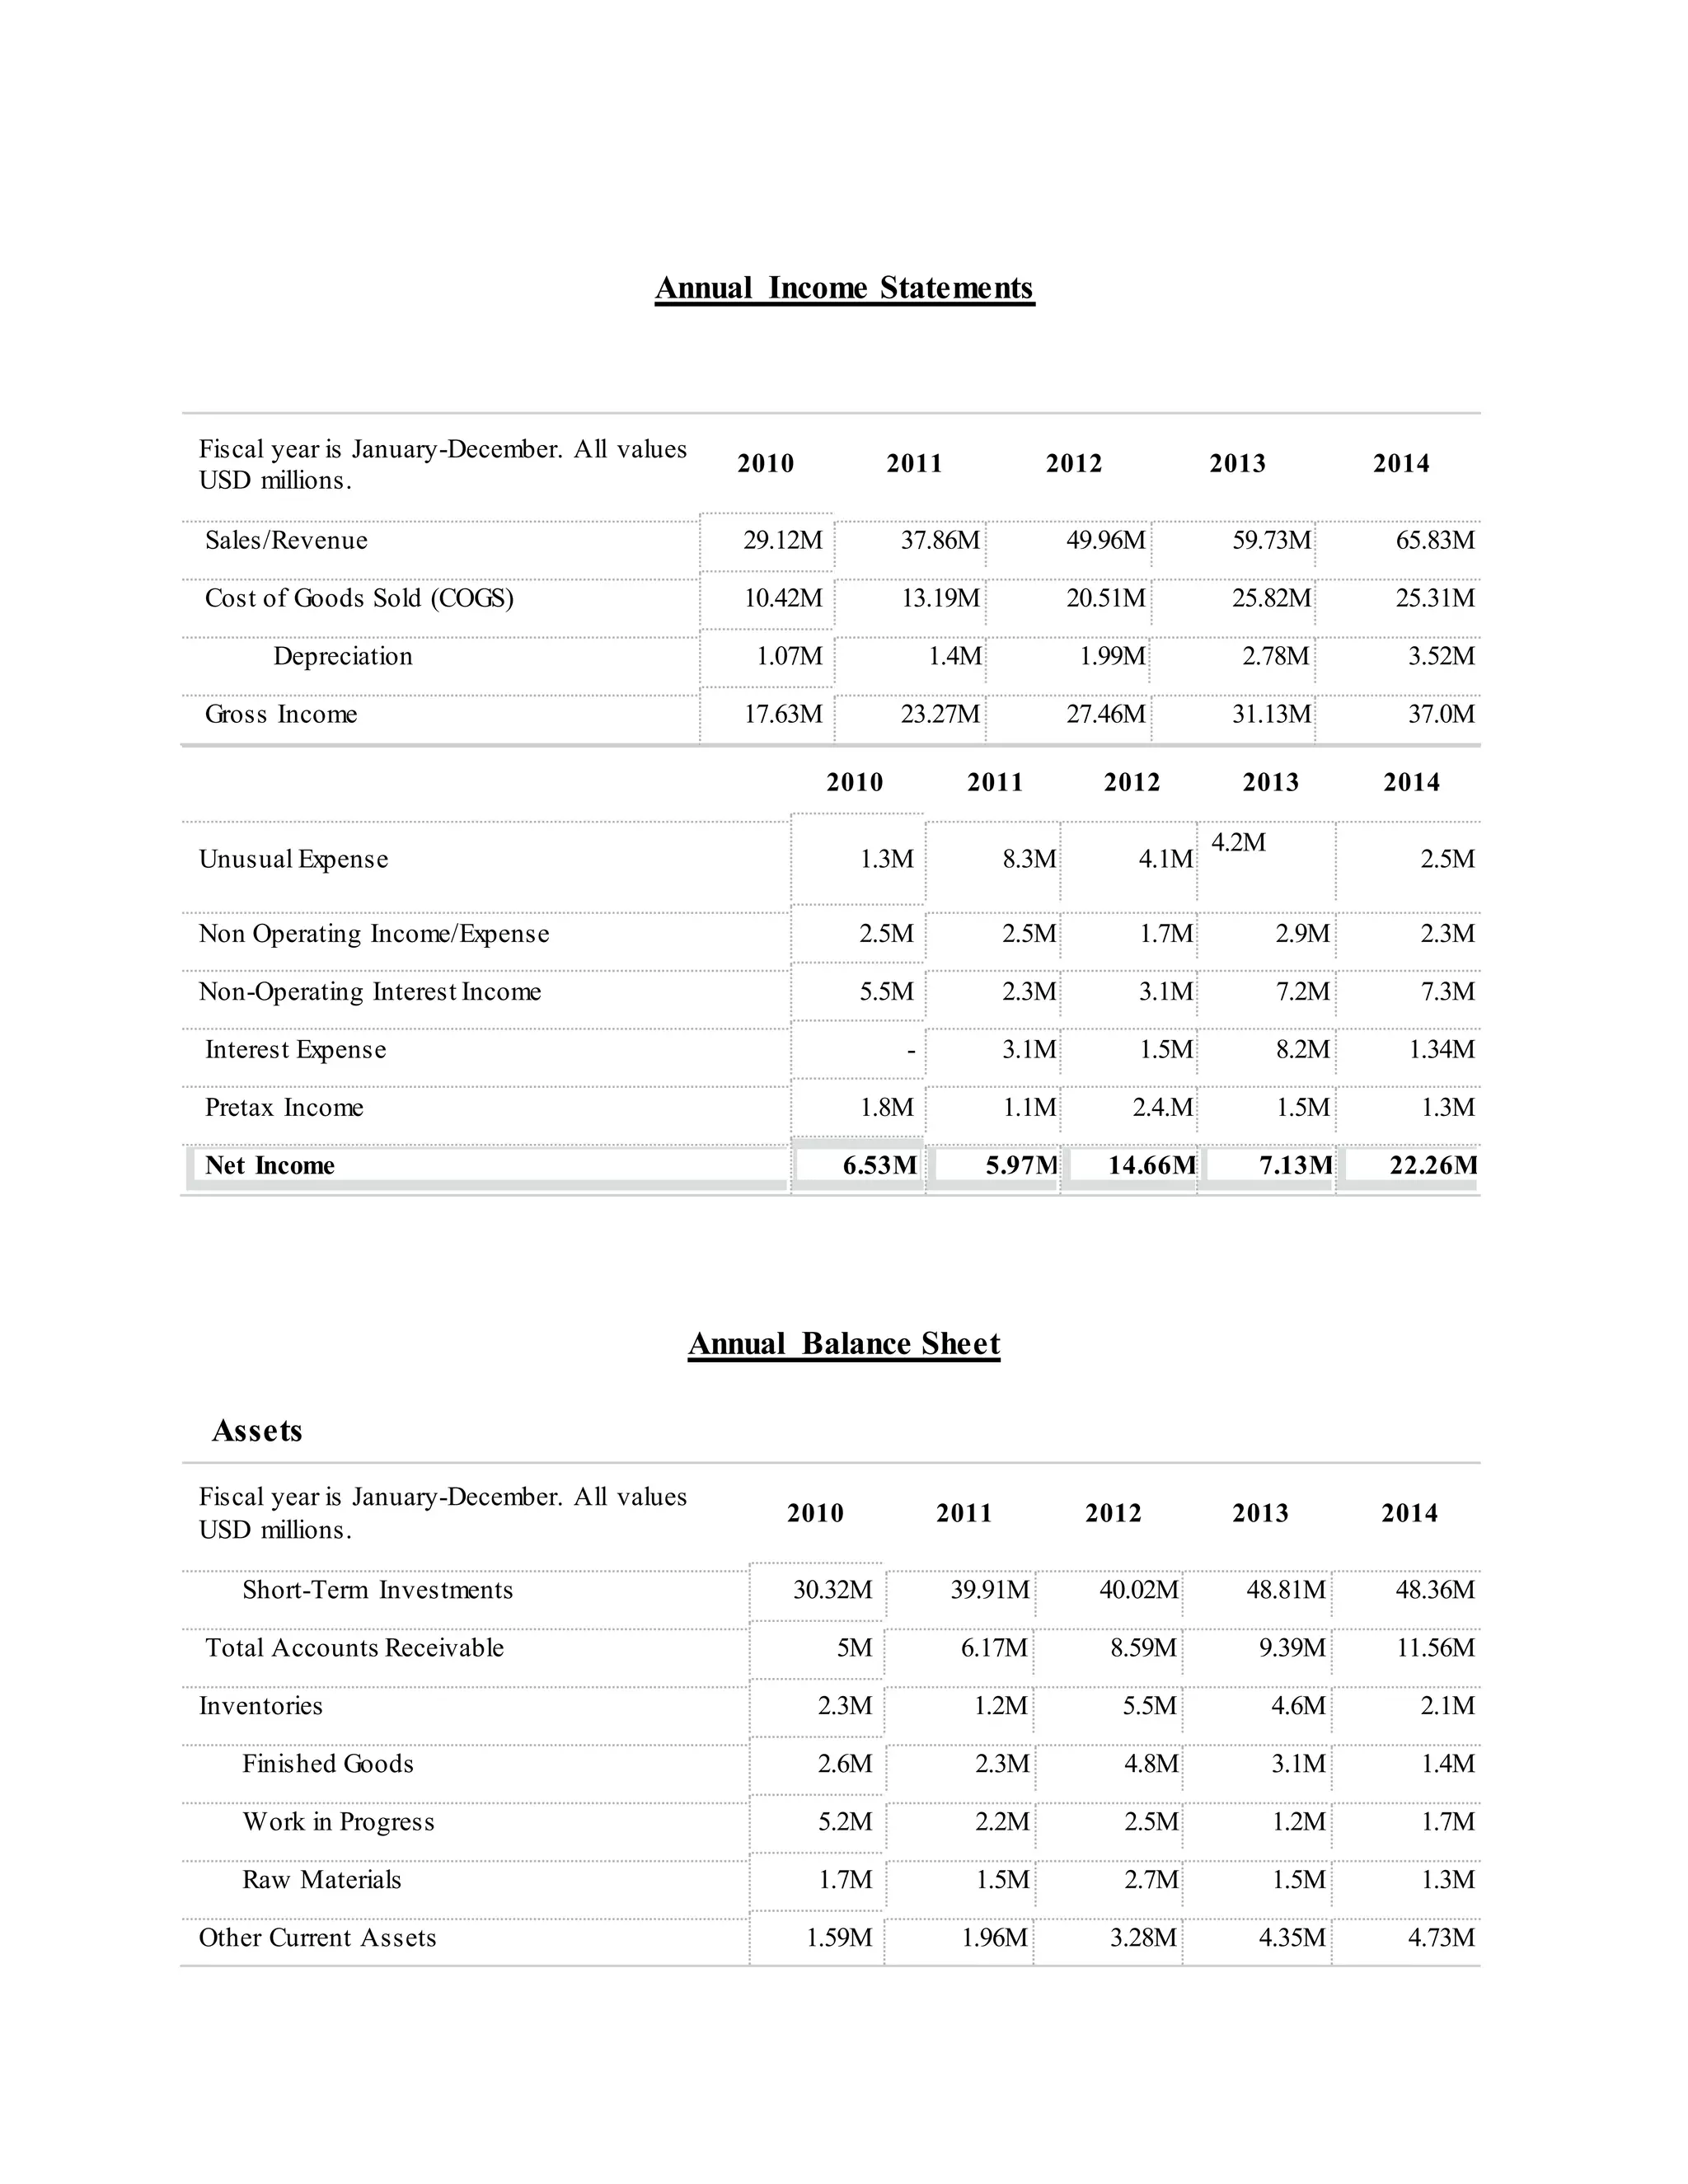
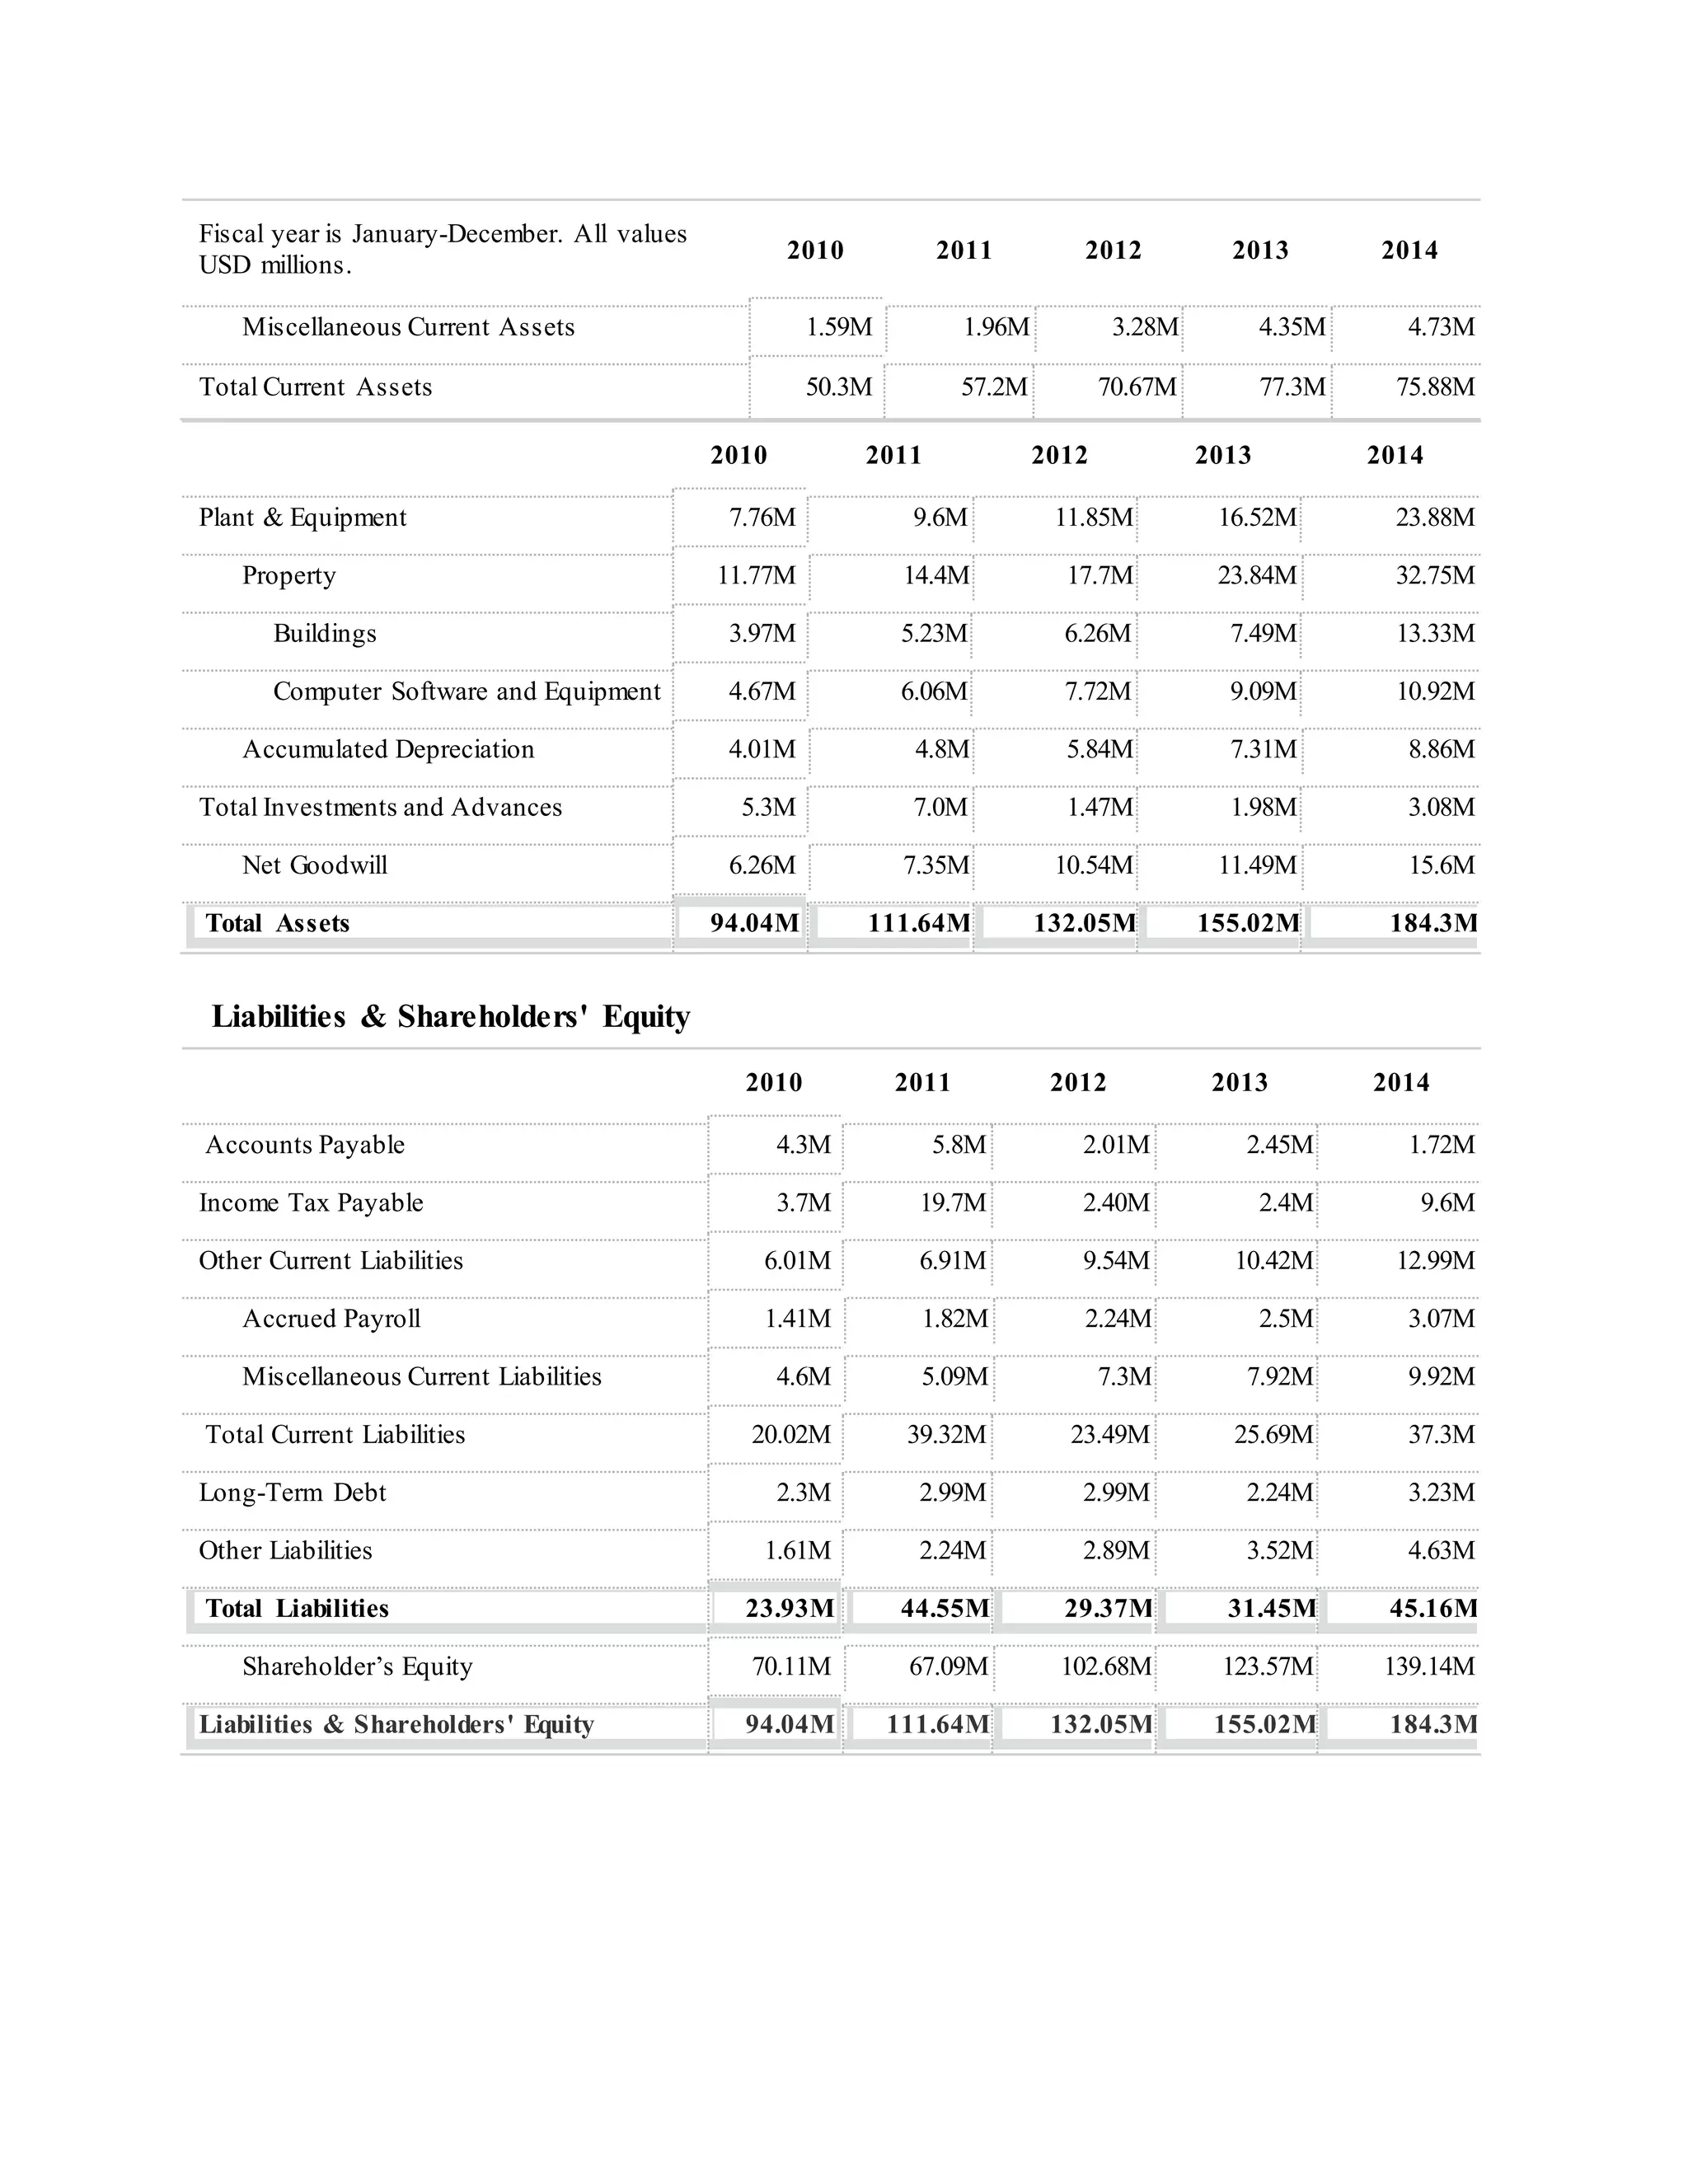
The document contains project report submitted by 4 students on the financial statements of Google from 2010-2014. It includes income statements, balance sheets, accounting ratios and their analysis. Key information presented includes:
- Sales/revenue grew from $29.12M to $65.83M from 2010-2014. Net income grew from $6.53M to $22.26M over the same period.
- Total assets grew from $94.04M to $184.3M from 2010-2014 with increasing property, plant and equipment. Shareholder's equity also increased from $70.11M to $139.14M.
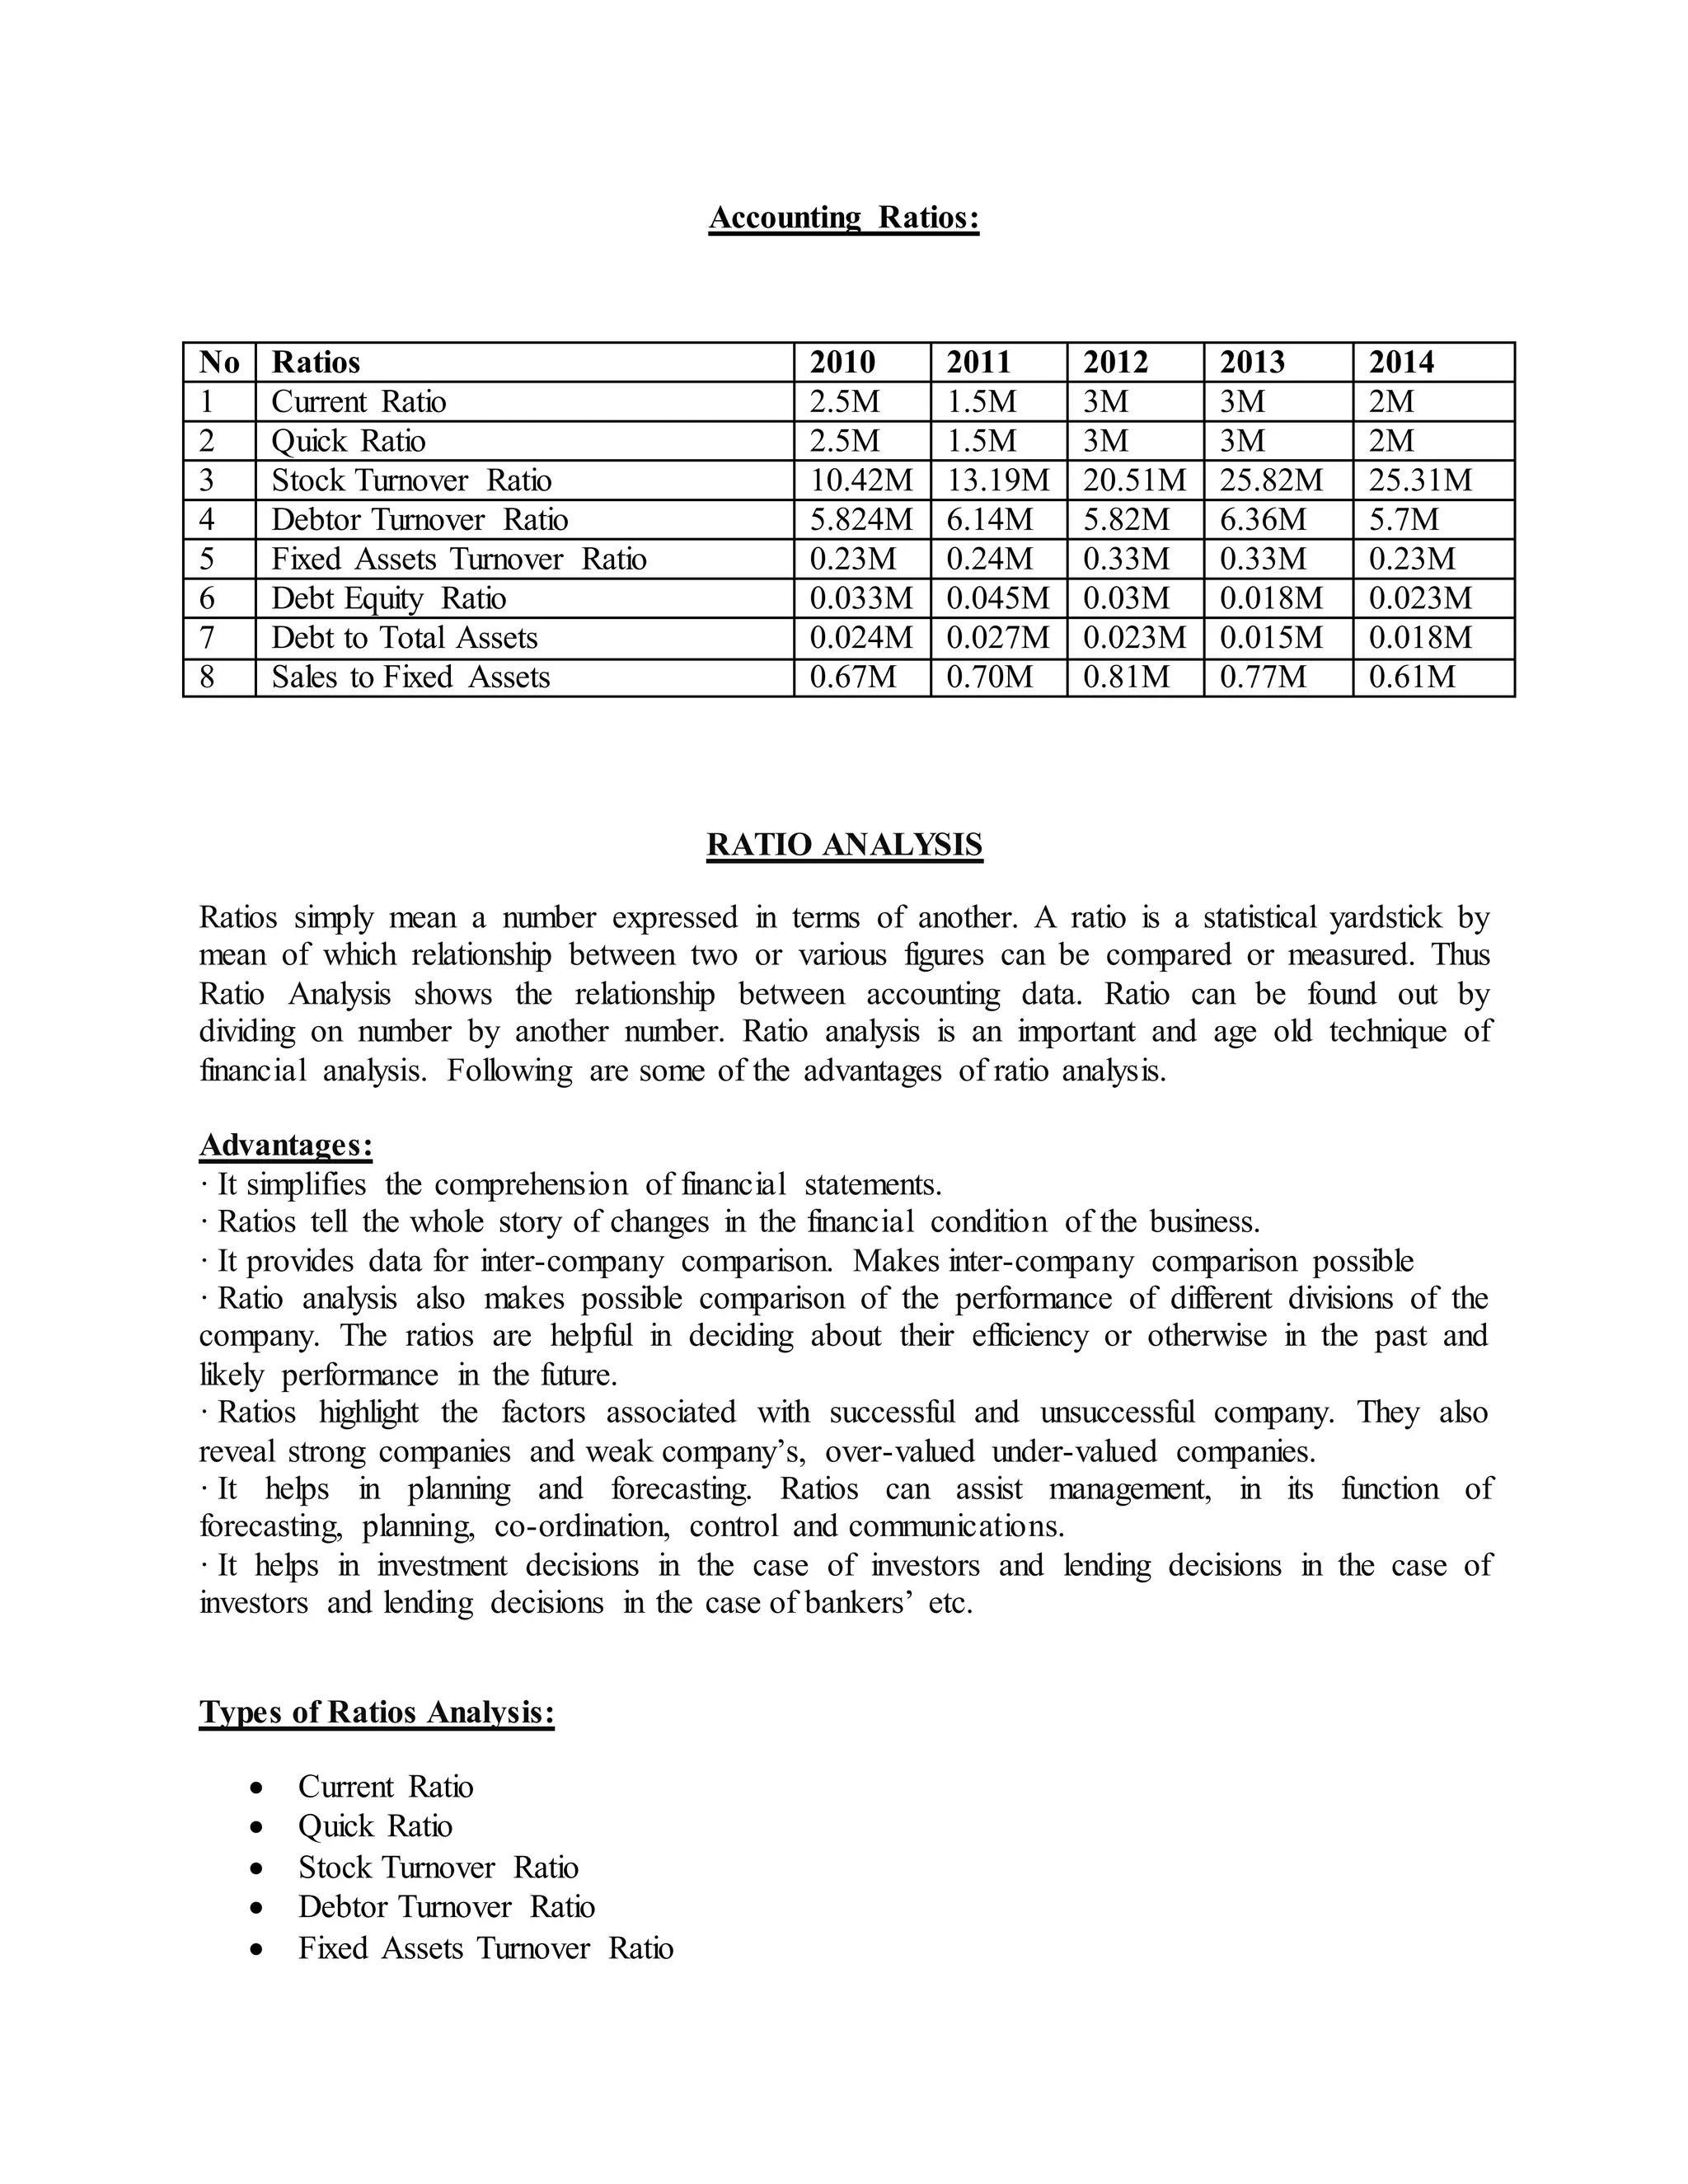
- Accounting ratios like current ratio, quick ratio, stock turnover ratio


![Financial statement analysis[1]](https://cdn.slidesharecdn.com/ss_thumbnails/financialstatementanalysis1-130418071722-phpapp02-thumbnail.jpg?width=640&height=640&fit=bounds)


