INTRODUCTION TO
VALUE AT RISK (VaR)

  ALAN ANDERSON, Ph.D.
     ECI Risk Training
   www.ecirisktraining.com
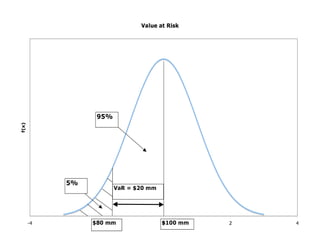
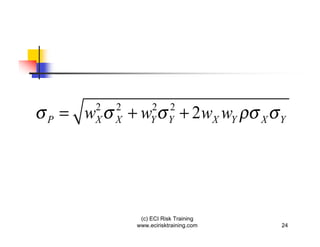
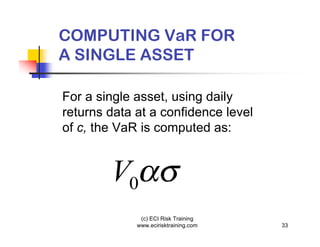
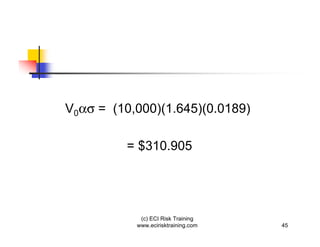
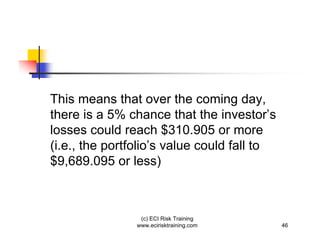
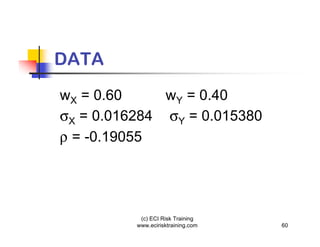
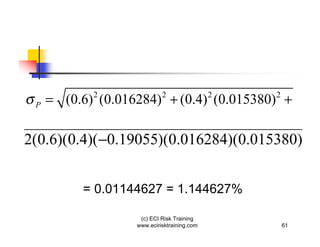
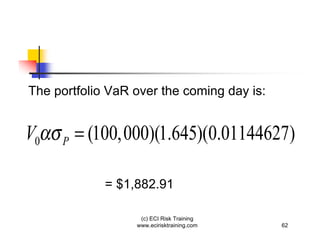
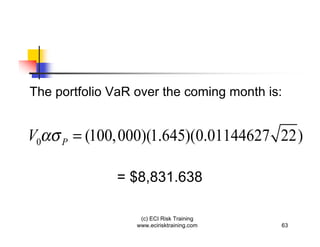
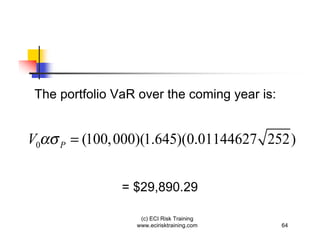
Value at Risk (VaR) is a statistical
technique designed to measure the
maximum loss that a portfolio of assets
could suffer over a given time horizon
with a specified level of confidence


                (c) ECI Risk Training
               www.ecirisktraining.com    2
Value at Risk was originally used to
measure market risk

It has since been extended to other
types of risk, such as credit risk and
operational risk

                (c) ECI Risk Training
               www.ecirisktraining.com   3
EXAMPLE

Suppose that it is determined that a
$100 million portfolio could potentially
lose $20 million (or more) once every
20 trading days


                 (c) ECI Risk Training
                www.ecirisktraining.com    4
The VaR of this portfolio equals $20
million with a 95% level of confidence
over the coming trading day; 19 out of
20 trading days (95% of the time),
losses are less than $20 million


               (c) ECI Risk Training
              www.ecirisktraining.com    5
At the 95% confidence level, VaR represents
the border of the 5% “left tail” of the normal
distribution, also known as the fifth percentile
or .05 quantile of the normal distribution


                     (c) ECI Risk Training
                    www.ecirisktraining.com    6
(c) ECI Risk Training
www.ecirisktraining.com   7
This diagram shows that:

 95% of the time, the portfolio’s
 value remains above $80 million

 5% of the time, the portfolio’s
 value falls to $80 million or less
               (c) ECI Risk Training
              www.ecirisktraining.com   8
The VaR of this portfolio is therefore

 $100 million - $80 million = $20 million


                  (c) ECI Risk Training
                 www.ecirisktraining.com    9
VaR is based on the assumption that the
rates of return of the assets held in a
portfolio are jointly normally distributed


                  (c) ECI Risk Training
                 www.ecirisktraining.com     10
VaR has the advantage that the risks
of different assets can be combined to
produce a single number that reflects
the risk of a portfolio


                (c) ECI Risk Training
               www.ecirisktraining.com   11
Further, the probability of a given
loss can be calculated using VaR

VaR can also be used to determine
the impact on risk of changes in a
portfolio’s composition

                (c) ECI Risk Training
               www.ecirisktraining.com   12
VaR has the disadvantage that it
is computationally intensive and
requires major adjustments for
non-linear assets, such as options


              (c) ECI Risk Training
             www.ecirisktraining.com   13
COMPUTING VaR

Value-at-Risk is based on the work of
Harry Markowitz, who was awarded
the Nobel Prize in Economics in 1990
for his pioneering research in the area
of portfolio theory


                (c) ECI Risk Training
               www.ecirisktraining.com    14
Portfolio theory shows how
risk can be reduced by holding
a well-diversified set of assets


              (c) ECI Risk Training
             www.ecirisktraining.com   15
A collection of assets is considered to be well-
diversified if the assets are affected differently
by changes in economic variables, such as
interest rates, exchange rates, etc.


                     (c) ECI Risk Training
                    www.ecirisktraining.com    16
As a result, a well-diversified portfolio is
less likely to experience extreme changes
in value; in this way, risk is reduced


                 (c) ECI Risk Training
                www.ecirisktraining.com    17
In statistical terms, a well-diversified portfolio
contains assets whose rates of return have
very low or negative correlations with each
other


                      (c) ECI Risk Training
                     www.ecirisktraining.com     18
EXAMPLE

A portfolio consisting exclusively of oil
stocks would not be well-diversified, since
changes in the price of oil would have a
huge impact on the portfolio’s value


                  (c) ECI Risk Training
                 www.ecirisktraining.com      19
A portfolio invested in both oil stocks
and automotive stocks would be far
more diversified:


                (c) ECI Risk Training
               www.ecirisktraining.com    20
Rising oil prices would hurt the automotive
stocks while helping the oil stocks

Falling oil prices would hurt the oil stocks
while helping the automotive stocks


                  (c) ECI Risk Training
                 www.ecirisktraining.com       21
As a result, the impact of oil price
swings would be offset by changes in
the value of the automotive stocks

On balance, risk would be reduced


             (c) ECI Risk Training
            www.ecirisktraining.com    22
The risk of holding a portfolio containing two
assets, X and Y, is measured by its standard
deviation, as follows:


                   (c) ECI Risk Training
                  www.ecirisktraining.com   23
P   = w
      2
      X
          2
          X   +w   2
                   Y
                         2
                         Y    + 2wX wY   X   Y


               (c) ECI Risk Training
              www.ecirisktraining.com        24
where:


     P  = the standard deviation
    of the returns to the portfolio


               (c) ECI Risk Training
              www.ecirisktraining.com   25
X   =   standard deviation of
        the returns to asset X

Y   =   standard deviation of
        the returns to asset Y


              (c) ECI Risk Training
             www.ecirisktraining.com   26
wX =    weight of asset X
wY =    weight of asset Y

The weights represent the proportion
of the portfolio invested in each asset;
the sum of the weights is one

               (c) ECI Risk Training
              www.ecirisktraining.com      27
NOTE

If short-selling is not possible, then:

         0   wX        1
         0   wY        1

If short-selling is possible, the
weights can be negative
                   (c) ECI Risk Training
                  www.ecirisktraining.com   28
= “rho”

this represents the correlation
between the returns to assets
X and Y; -1       1


            (c) ECI Risk Training
           www.ecirisktraining.com   29
The lower is the correlation
between assets, the lower will
be the risk of the portfolio


             (c) ECI Risk Training
            www.ecirisktraining.com   30
The Value at Risk of a
portfolio is a function of:


           (c) ECI Risk Training
          www.ecirisktraining.com   31
the dollar value of the portfolio
the portfolio standard deviation
the confidence level
the time horizon


            (c) ECI Risk Training
           www.ecirisktraining.com   32
COMPUTING VaR FOR
A SINGLE ASSET

For a single asset, using daily
returns data at a confidence level
of c, the VaR is computed as:


        V0
              (c) ECI Risk Training
             www.ecirisktraining.com   33
where:

    V0 = initial value of the asset

         = standard deviation of the
           asset’s daily returns


                     (c) ECI Risk Training
                    www.ecirisktraining.com   34
= the number of standard deviations
 below the mean corresponding to
 the (1-c) quantile of the standard
 normal distribution


             (c) ECI Risk Training
            www.ecirisktraining.com   35
EXAMPLE
For a 95% confidence level, c = 0.95

(1-c) is the fifth quantile (1-.95 = .05 =
5%) of the standard normal distribution

The corresponding value of                is 1.645

                 (c) ECI Risk Training
                www.ecirisktraining.com              36
(c) ECI Risk Training
www.ecirisktraining.com   37
The value of corresponding to any
confidence level can be found with a
normal table or with the Excel function
NORMSINV


                (c) ECI Risk Training
               www.ecirisktraining.com    38
EXAMPLE

For a 99% confidence level, the value
of can be determined as follows:


               (c) ECI Risk Training
              www.ecirisktraining.com   39
c = 0.99
(1-c) = 0.01 = 1%
NORMSINV(0.01) = -2.33
  = 2.33


      (c) ECI Risk Training
     www.ecirisktraining.com   40
(c) ECI Risk Training
www.ecirisktraining.com   41
EXAMPLE

Suppose that an investor’s portfolio consists
entirely of $10,000 worth of IBM stock.

Since the portfolio only contains IBM stock,
it can be thought of as a single asset


                  (c) ECI Risk Training
                 www.ecirisktraining.com   42
Assume that the standard deviation of the
stock’s returns are 0.0189 (1.89%) per day


                 (c) ECI Risk Training
                www.ecirisktraining.com   43
If the investor wants to know his
portfolio’s VaR over the coming
trading day at the 95% confidence
level, this would be calculated as
follows:


             (c) ECI Risk Training
            www.ecirisktraining.com   44
V0   = (10,000)(1.645)(0.0189)

         = $310.905


            (c) ECI Risk Training
           www.ecirisktraining.com   45
This means that over the coming day,
there is a 5% chance that the investor’s
losses could reach $310.905 or more
(i.e., the portfolio’s value could fall to
$9,689.095 or less)


                 (c) ECI Risk Training
                www.ecirisktraining.com      46
NOTE
VaR can be extended to different
time horizons by applying the square
root of time rule


               (c) ECI Risk Training
              www.ecirisktraining.com   47
According to this rule, the standard
deviation increases in proportion to
the square root of time:


    t periods   = t                1 period


                 (c) ECI Risk Training
                www.ecirisktraining.com       48
If the investor wants to know his
portfolio’s VaR over the coming
month at the 95% confidence level,
based on the assumption that there
are 22 trading days in a month, this
would be calculated as follows:


              (c) ECI Risk Training
             www.ecirisktraining.com   49
V0   = (10, 000)(1.645)(0.0189 22)


(10, 000)(1.645)(0.0189 22) = $1, 458.27


                (c) ECI Risk Training
               www.ecirisktraining.com   50
Similarly, if the investor wants to know
what his portfolio’s VaR is over the coming
year, assuming that there are 252 trading
days in a year, the calculations would be:


                  (c) ECI Risk Training
                 www.ecirisktraining.com   51
V0    = (10, 000)(1.645)(0.0189 252)


(10, 000)(1.645)(0.0189 252) = $4,935.46


                 (c) ECI Risk Training
                www.ecirisktraining.com   52
COMPUTING PORTFOLIO VaR

 In order to compute the Value at
 Risk of a portfolio of two or more
 assets, the correlations among the
 assets must be explicitly considered

 The lower these correlations, the
 lower will be the resulting VaR

               (c) ECI Risk Training
              www.ecirisktraining.com   53
The Value at Risk of a portfolio
is calculated by determining the:

weight (proportion of the total
invested) of each asset in the
portfolio


              (c) ECI Risk Training
             www.ecirisktraining.com   54
standard deviation of each asset’s
rate of return in the portfolio

correlations among the assets’ rates
of return in the portfolio


               (c) ECI Risk Training
              www.ecirisktraining.com   55
Once a confidence level and a time
horizon have been chosen, the
weights, volatilities and correlations
can be combined using Markowitz’s
approach to derive the portfolio’s VaR


                (c) ECI Risk Training
               www.ecirisktraining.com   56
EXAMPLE
Assume that a $100,000 portfolio
contains $60,000 worth of Stock X
and $40,000 worth of Stock Y.


               (c) ECI Risk Training
              www.ecirisktraining.com   57
Given the following data, compute
the VaR of this portfolio with a 95%
confidence level over the coming:


               (c) ECI Risk Training
              www.ecirisktraining.com   58
day
  month
  year


 (c) ECI Risk Training
www.ecirisktraining.com   59
DATA
wX = 0.60     wY = 0.40
 X = 0.016284  Y = 0.015380
  = -0.19055


           (c) ECI Risk Training
          www.ecirisktraining.com   60
P   = (0.6) (0.016284) + (0.4) (0.015380) +
            2               2                2   2


2(0.6)(0.4)( 0.19055)(0.016284)(0.015380)


          = 0.01144627 = 1.144627%

                    (c) ECI Risk Training
                   www.ecirisktraining.com           61
The portfolio VaR over the coming day is:


V0   P   = (100,000)(1.645)(0.01144627)

             = $1,882.91

                   (c) ECI Risk Training
                  www.ecirisktraining.com   62
The portfolio VaR over the coming month is:


V0   P   = (100, 000)(1.645)(0.01144627 22)

               = $8,831.638

                   (c) ECI Risk Training
                  www.ecirisktraining.com   63
The portfolio VaR over the coming year is:


V0   P   = (100, 000)(1.645)(0.01144627 252)


                = $29,890.29

                    (c) ECI Risk Training
                   www.ecirisktraining.com    64

Introduction To Value At Risk

  • 1.
    INTRODUCTION TO VALUE ATRISK (VaR) ALAN ANDERSON, Ph.D. ECI Risk Training www.ecirisktraining.com
  • 2.
    Value at Risk(VaR) is a statistical technique designed to measure the maximum loss that a portfolio of assets could suffer over a given time horizon with a specified level of confidence (c) ECI Risk Training www.ecirisktraining.com 2
  • 3.
    Value at Riskwas originally used to measure market risk It has since been extended to other types of risk, such as credit risk and operational risk (c) ECI Risk Training www.ecirisktraining.com 3
  • 4.
    EXAMPLE Suppose that itis determined that a $100 million portfolio could potentially lose $20 million (or more) once every 20 trading days (c) ECI Risk Training www.ecirisktraining.com 4
  • 5.
    The VaR ofthis portfolio equals $20 million with a 95% level of confidence over the coming trading day; 19 out of 20 trading days (95% of the time), losses are less than $20 million (c) ECI Risk Training www.ecirisktraining.com 5
  • 6.
    At the 95%confidence level, VaR represents the border of the 5% “left tail” of the normal distribution, also known as the fifth percentile or .05 quantile of the normal distribution (c) ECI Risk Training www.ecirisktraining.com 6
  • 7.
    (c) ECI RiskTraining www.ecirisktraining.com 7
  • 8.
    This diagram showsthat: 95% of the time, the portfolio’s value remains above $80 million 5% of the time, the portfolio’s value falls to $80 million or less (c) ECI Risk Training www.ecirisktraining.com 8
  • 9.
    The VaR ofthis portfolio is therefore $100 million - $80 million = $20 million (c) ECI Risk Training www.ecirisktraining.com 9
  • 10.
    VaR is basedon the assumption that the rates of return of the assets held in a portfolio are jointly normally distributed (c) ECI Risk Training www.ecirisktraining.com 10
  • 11.
    VaR has theadvantage that the risks of different assets can be combined to produce a single number that reflects the risk of a portfolio (c) ECI Risk Training www.ecirisktraining.com 11
  • 12.
    Further, the probabilityof a given loss can be calculated using VaR VaR can also be used to determine the impact on risk of changes in a portfolio’s composition (c) ECI Risk Training www.ecirisktraining.com 12
  • 13.
    VaR has thedisadvantage that it is computationally intensive and requires major adjustments for non-linear assets, such as options (c) ECI Risk Training www.ecirisktraining.com 13
  • 14.
    COMPUTING VaR Value-at-Risk isbased on the work of Harry Markowitz, who was awarded the Nobel Prize in Economics in 1990 for his pioneering research in the area of portfolio theory (c) ECI Risk Training www.ecirisktraining.com 14
  • 15.
    Portfolio theory showshow risk can be reduced by holding a well-diversified set of assets (c) ECI Risk Training www.ecirisktraining.com 15
  • 16.
    A collection ofassets is considered to be well- diversified if the assets are affected differently by changes in economic variables, such as interest rates, exchange rates, etc. (c) ECI Risk Training www.ecirisktraining.com 16
  • 17.
    As a result,a well-diversified portfolio is less likely to experience extreme changes in value; in this way, risk is reduced (c) ECI Risk Training www.ecirisktraining.com 17
  • 18.
    In statistical terms,a well-diversified portfolio contains assets whose rates of return have very low or negative correlations with each other (c) ECI Risk Training www.ecirisktraining.com 18
  • 19.
    EXAMPLE A portfolio consistingexclusively of oil stocks would not be well-diversified, since changes in the price of oil would have a huge impact on the portfolio’s value (c) ECI Risk Training www.ecirisktraining.com 19
  • 20.
    A portfolio investedin both oil stocks and automotive stocks would be far more diversified: (c) ECI Risk Training www.ecirisktraining.com 20
  • 21.
    Rising oil priceswould hurt the automotive stocks while helping the oil stocks Falling oil prices would hurt the oil stocks while helping the automotive stocks (c) ECI Risk Training www.ecirisktraining.com 21
  • 22.
    As a result,the impact of oil price swings would be offset by changes in the value of the automotive stocks On balance, risk would be reduced (c) ECI Risk Training www.ecirisktraining.com 22
  • 23.
    The risk ofholding a portfolio containing two assets, X and Y, is measured by its standard deviation, as follows: (c) ECI Risk Training www.ecirisktraining.com 23
  • 24.
    P = w 2 X 2 X +w 2 Y 2 Y + 2wX wY X Y (c) ECI Risk Training www.ecirisktraining.com 24
  • 25.
    where: P = the standard deviation of the returns to the portfolio (c) ECI Risk Training www.ecirisktraining.com 25
  • 26.
    X = standard deviation of the returns to asset X Y = standard deviation of the returns to asset Y (c) ECI Risk Training www.ecirisktraining.com 26
  • 27.
    wX = weight of asset X wY = weight of asset Y The weights represent the proportion of the portfolio invested in each asset; the sum of the weights is one (c) ECI Risk Training www.ecirisktraining.com 27
  • 28.
    NOTE If short-selling isnot possible, then: 0 wX 1 0 wY 1 If short-selling is possible, the weights can be negative (c) ECI Risk Training www.ecirisktraining.com 28
  • 29.
    = “rho” this representsthe correlation between the returns to assets X and Y; -1 1 (c) ECI Risk Training www.ecirisktraining.com 29
  • 30.
    The lower isthe correlation between assets, the lower will be the risk of the portfolio (c) ECI Risk Training www.ecirisktraining.com 30
  • 31.
    The Value atRisk of a portfolio is a function of: (c) ECI Risk Training www.ecirisktraining.com 31
  • 32.
    the dollar valueof the portfolio the portfolio standard deviation the confidence level the time horizon (c) ECI Risk Training www.ecirisktraining.com 32
  • 33.
    COMPUTING VaR FOR ASINGLE ASSET For a single asset, using daily returns data at a confidence level of c, the VaR is computed as: V0 (c) ECI Risk Training www.ecirisktraining.com 33
  • 34.
    where: V0 = initial value of the asset = standard deviation of the asset’s daily returns (c) ECI Risk Training www.ecirisktraining.com 34
  • 35.
    = the numberof standard deviations below the mean corresponding to the (1-c) quantile of the standard normal distribution (c) ECI Risk Training www.ecirisktraining.com 35
  • 36.
    EXAMPLE For a 95%confidence level, c = 0.95 (1-c) is the fifth quantile (1-.95 = .05 = 5%) of the standard normal distribution The corresponding value of is 1.645 (c) ECI Risk Training www.ecirisktraining.com 36
  • 37.
    (c) ECI RiskTraining www.ecirisktraining.com 37
  • 38.
    The value ofcorresponding to any confidence level can be found with a normal table or with the Excel function NORMSINV (c) ECI Risk Training www.ecirisktraining.com 38
  • 39.
    EXAMPLE For a 99%confidence level, the value of can be determined as follows: (c) ECI Risk Training www.ecirisktraining.com 39
  • 40.
    c = 0.99 (1-c)= 0.01 = 1% NORMSINV(0.01) = -2.33 = 2.33 (c) ECI Risk Training www.ecirisktraining.com 40
  • 41.
    (c) ECI RiskTraining www.ecirisktraining.com 41
  • 42.
    EXAMPLE Suppose that aninvestor’s portfolio consists entirely of $10,000 worth of IBM stock. Since the portfolio only contains IBM stock, it can be thought of as a single asset (c) ECI Risk Training www.ecirisktraining.com 42
  • 43.
    Assume that thestandard deviation of the stock’s returns are 0.0189 (1.89%) per day (c) ECI Risk Training www.ecirisktraining.com 43
  • 44.
    If the investorwants to know his portfolio’s VaR over the coming trading day at the 95% confidence level, this would be calculated as follows: (c) ECI Risk Training www.ecirisktraining.com 44
  • 45.
    V0 = (10,000)(1.645)(0.0189) = $310.905 (c) ECI Risk Training www.ecirisktraining.com 45
  • 46.
    This means thatover the coming day, there is a 5% chance that the investor’s losses could reach $310.905 or more (i.e., the portfolio’s value could fall to $9,689.095 or less) (c) ECI Risk Training www.ecirisktraining.com 46
  • 47.
    NOTE VaR can beextended to different time horizons by applying the square root of time rule (c) ECI Risk Training www.ecirisktraining.com 47
  • 48.
    According to thisrule, the standard deviation increases in proportion to the square root of time: t periods = t 1 period (c) ECI Risk Training www.ecirisktraining.com 48
  • 49.
    If the investorwants to know his portfolio’s VaR over the coming month at the 95% confidence level, based on the assumption that there are 22 trading days in a month, this would be calculated as follows: (c) ECI Risk Training www.ecirisktraining.com 49
  • 50.
    V0 = (10, 000)(1.645)(0.0189 22) (10, 000)(1.645)(0.0189 22) = $1, 458.27 (c) ECI Risk Training www.ecirisktraining.com 50
  • 51.
    Similarly, if theinvestor wants to know what his portfolio’s VaR is over the coming year, assuming that there are 252 trading days in a year, the calculations would be: (c) ECI Risk Training www.ecirisktraining.com 51
  • 52.
    V0 = (10, 000)(1.645)(0.0189 252) (10, 000)(1.645)(0.0189 252) = $4,935.46 (c) ECI Risk Training www.ecirisktraining.com 52
  • 53.
    COMPUTING PORTFOLIO VaR In order to compute the Value at Risk of a portfolio of two or more assets, the correlations among the assets must be explicitly considered The lower these correlations, the lower will be the resulting VaR (c) ECI Risk Training www.ecirisktraining.com 53
  • 54.
    The Value atRisk of a portfolio is calculated by determining the: weight (proportion of the total invested) of each asset in the portfolio (c) ECI Risk Training www.ecirisktraining.com 54
  • 55.
    standard deviation ofeach asset’s rate of return in the portfolio correlations among the assets’ rates of return in the portfolio (c) ECI Risk Training www.ecirisktraining.com 55
  • 56.
    Once a confidencelevel and a time horizon have been chosen, the weights, volatilities and correlations can be combined using Markowitz’s approach to derive the portfolio’s VaR (c) ECI Risk Training www.ecirisktraining.com 56
  • 57.
    EXAMPLE Assume that a$100,000 portfolio contains $60,000 worth of Stock X and $40,000 worth of Stock Y. (c) ECI Risk Training www.ecirisktraining.com 57
  • 58.
    Given the followingdata, compute the VaR of this portfolio with a 95% confidence level over the coming: (c) ECI Risk Training www.ecirisktraining.com 58
  • 59.
    day month year (c) ECI Risk Training www.ecirisktraining.com 59
  • 60.
    DATA wX = 0.60 wY = 0.40 X = 0.016284 Y = 0.015380 = -0.19055 (c) ECI Risk Training www.ecirisktraining.com 60
  • 61.
    P = (0.6) (0.016284) + (0.4) (0.015380) + 2 2 2 2 2(0.6)(0.4)( 0.19055)(0.016284)(0.015380) = 0.01144627 = 1.144627% (c) ECI Risk Training www.ecirisktraining.com 61
  • 62.
    The portfolio VaRover the coming day is: V0 P = (100,000)(1.645)(0.01144627) = $1,882.91 (c) ECI Risk Training www.ecirisktraining.com 62
  • 63.
    The portfolio VaRover the coming month is: V0 P = (100, 000)(1.645)(0.01144627 22) = $8,831.638 (c) ECI Risk Training www.ecirisktraining.com 63
  • 64.
    The portfolio VaRover the coming year is: V0 P = (100, 000)(1.645)(0.01144627 252) = $29,890.29 (c) ECI Risk Training www.ecirisktraining.com 64