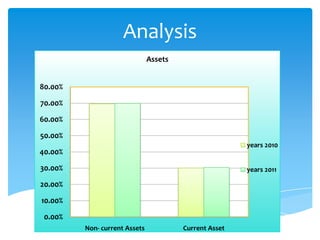
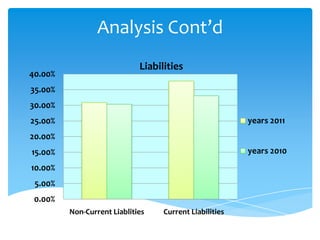
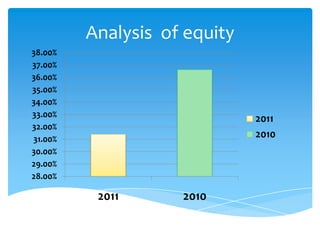
Common size statement
Analysis of Financial statement
Marria Pirwani (5183)
Qurat –Ul – Ain Malik (4488)
Introduction (Unilever)
“No matter who you are, or where in the world you are,
the chances are that our products are a familiar part of
your daily routine. Every day, around the world, people
reach for Unilever products”
Introduction cont’d
 Unilever Pakistan (70.4% Unilever equity) is the largest
FMCG Company in Pakistan, as well as one of the
largest multinationals operating in the country.
 Unilever is one of the world’s leading suppliers of
fast-moving consumer goods.
 Unilever Pakistan began its operations in 1948
Vision (Unilever)
 Better future
 Get more out of life
 Big difference
 Developing
Purpose and principles
 Always working with integrity
 Positive impact
 Continuous commitment
 Setting out our aspirations
 Working with others
Common size statement
A company financial statement that displays all items
as percentages of a common base figure. This type of
financial statement allows for easy analysis between
companies or between time periods of a company.
Types of Common Size Financial Statement:
(1)Common Size Balance Sheet
(2)Common Size Income Statement:
Common size Income statement
An income statement in which each
account is expressed as a percentage
of the value of sales. Common size income
statement analysis allows an analyst to
determine how the various components of the
income statement affect a company's profit.
Common size Balance sheet
A company balance sheet that displays all
items as percentages of a common base
figure. This type of financial statement can
be used to allow for easy analysis between
companies or between time periods of
a company.
Analysis
0.00%
10.00%
20.00%
30.00%
40.00%
50.00%
60.00%
70.00%
80.00%
Non- current Assets Current Asset
Assets
years 2010
years 2011
Assets Analysis
 The non-current asset in 2010 was 69.56% as it increases to
69.92% in 2011. The element in balance sheet which increases
and decreases in the balance sheet of 2011
• the company’s intangible assets increases by 2.41% in
2011, deferred tax assets which decreases by
0.58%, Property, plant and equipment decreases by
0.61%, the company’s goodwill also decreases in year 2011 by
0.57% and its financial assets also decreases by in 2011 by
0.23%.
 In current assets fundamentals also fluctuate in year 2011 as
inventories decreases by 0.78%, the cash and cash
equivalents increases in 2011 and its other financial assets
also increases
Analysis Cont’d
0.00%
5.00%
10.00%
15.00%
20.00%
25.00%
30.00%
35.00%
40.00%
Non-Current Liablities Current Liabilities
Liabilities
years 2011
years 2010
Analysis
Current liabilities: A balance sheet item which equals the sum
of all money owed by a company and due within one year also
called payables or current debt.
Non – current liabilities: Debt not due to be paid within the
next year.
The non-current liabilities increases in 2011 by 0.53% and the
current liabilities are increases by 4.69% because the
company’s current financial debts are increased by 6.76% in
2011.
Analysis of equity
28.00%
29.00%
30.00%
31.00%
32.00%
33.00%
34.00%
35.00%
36.00%
37.00%
38.00%
2011 2010
2011
2010
Analysis
Equity is the residual claim or interest of the most junior
class of investors in assets, after all liabilities are paid. If
liability exceeds assets, negative equity exists. In an
accounting context, Shareholders' equity (or
stockholders' equity, shareholders' funds, shareholders'
capital or similar terms) represents the remaining interest
in assets of a company, spread among
individual shareholders of common or preferred stock.
The company’s equity decreases by 5.22% in the year
2011, because the company’s shareholder equity
decreases.
Conclusion
The common size statement helps to do the
analysis of the company, at what position the
company stands on the basis of shareholders
performance and its profit oriented area. As
unilever is the multinational company, which makes
so may brands, above we have done the analysis
that at what stage company stands.
Presentation on Common Size statement

Presentation on Common Size statement

  • 1.
    Common size statement Analysisof Financial statement Marria Pirwani (5183) Qurat –Ul – Ain Malik (4488)
  • 2.
    Introduction (Unilever) “No matterwho you are, or where in the world you are, the chances are that our products are a familiar part of your daily routine. Every day, around the world, people reach for Unilever products”
  • 3.
    Introduction cont’d  UnileverPakistan (70.4% Unilever equity) is the largest FMCG Company in Pakistan, as well as one of the largest multinationals operating in the country.  Unilever is one of the world’s leading suppliers of fast-moving consumer goods.  Unilever Pakistan began its operations in 1948
  • 4.
    Vision (Unilever)  Betterfuture  Get more out of life  Big difference  Developing
  • 5.
    Purpose and principles Always working with integrity  Positive impact  Continuous commitment  Setting out our aspirations  Working with others
  • 6.
    Common size statement Acompany financial statement that displays all items as percentages of a common base figure. This type of financial statement allows for easy analysis between companies or between time periods of a company. Types of Common Size Financial Statement: (1)Common Size Balance Sheet (2)Common Size Income Statement:
  • 7.
    Common size Incomestatement An income statement in which each account is expressed as a percentage of the value of sales. Common size income statement analysis allows an analyst to determine how the various components of the income statement affect a company's profit.
  • 8.
    Common size Balancesheet A company balance sheet that displays all items as percentages of a common base figure. This type of financial statement can be used to allow for easy analysis between companies or between time periods of a company.
  • 9.
  • 10.
    Assets Analysis  Thenon-current asset in 2010 was 69.56% as it increases to 69.92% in 2011. The element in balance sheet which increases and decreases in the balance sheet of 2011 • the company’s intangible assets increases by 2.41% in 2011, deferred tax assets which decreases by 0.58%, Property, plant and equipment decreases by 0.61%, the company’s goodwill also decreases in year 2011 by 0.57% and its financial assets also decreases by in 2011 by 0.23%.  In current assets fundamentals also fluctuate in year 2011 as inventories decreases by 0.78%, the cash and cash equivalents increases in 2011 and its other financial assets also increases
  • 11.
  • 12.
    Analysis Current liabilities: Abalance sheet item which equals the sum of all money owed by a company and due within one year also called payables or current debt. Non – current liabilities: Debt not due to be paid within the next year. The non-current liabilities increases in 2011 by 0.53% and the current liabilities are increases by 4.69% because the company’s current financial debts are increased by 6.76% in 2011.
  • 13.
  • 14.
    Analysis Equity is theresidual claim or interest of the most junior class of investors in assets, after all liabilities are paid. If liability exceeds assets, negative equity exists. In an accounting context, Shareholders' equity (or stockholders' equity, shareholders' funds, shareholders' capital or similar terms) represents the remaining interest in assets of a company, spread among individual shareholders of common or preferred stock. The company’s equity decreases by 5.22% in the year 2011, because the company’s shareholder equity decreases.
  • 15.
    Conclusion The common sizestatement helps to do the analysis of the company, at what position the company stands on the basis of shareholders performance and its profit oriented area. As unilever is the multinational company, which makes so may brands, above we have done the analysis that at what stage company stands.