Download as PDF, PPTX

![Copyright @ 2014 Abbott, Stringham & Lynch. All rights reserved.
26
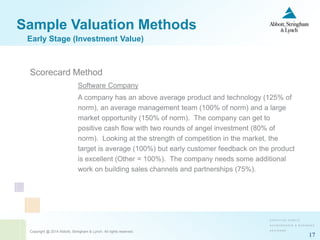
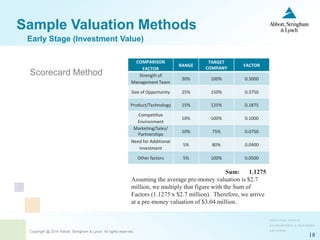
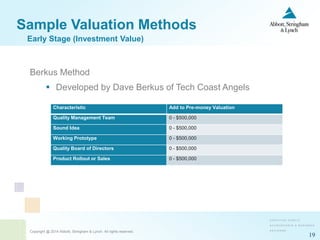
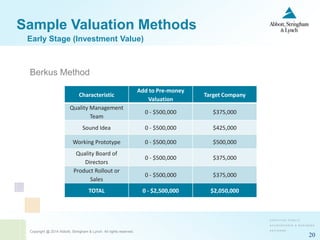
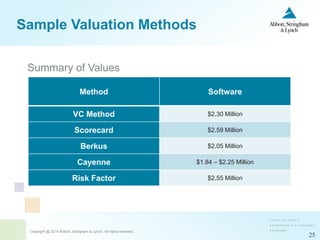
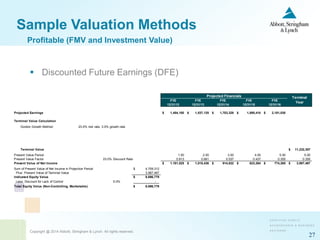
Sample Valuation Methods
Discounted Cash Flow (DCF) – [exit multiples]
Projected Financials
FYE FYE FYE FYE FYE
12/31/12 12/31/13 12/31/14 12/31/15 12/31/16
Projected Earnings (9.238)$ (5.235)$ 1.528$ 6.859$ 10.537$
Terminal Value Calculation
Revenue Multiple 12/31/16 165.526$ 2.7
Terminal Value 430.37$
Present Value Period 1.00 2.00 3.00 4.00 5.00 5.50
Present Value Factor (3)
60.0% Discount Rate 0.624 0.390 0.244 0.152 0.095 0.075
Present Value of Debt-free Cash Flow (5.782)$ (2.042)$ 0.373$ 1.045$ 1.004$ 32.406$
Sum of Present Value of Debt-free Cash Flow in Projection Period (5.403)$
Plus: Present Value of Terminal Value 32.406
Total Equity Value (Controlling, Marketable) 27.003$
Less: Discount for Lack of Control 0.0% -
Total Equity Value (Non-controlling, Marketable) 27.003$
Less: Discount for Lack of Marketability 35.0% 9.451
Total Equity Value (Non-controlling, Non-marketable) 17.552$
Terminal
Year
Post-Funding (FMV)](https://image.slidesharecdn.com/start-up-valuation-presentation-for-stanford-gsb-by-jeff-faust-of-asl-160219002538/85/Valuations-w-Jeff-Faust-26-320.jpg)


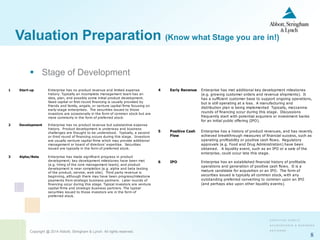
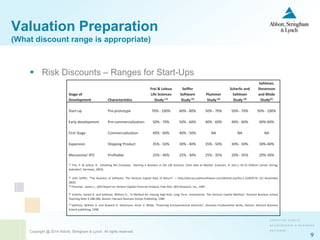
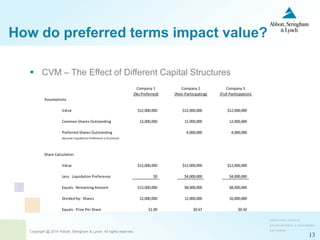
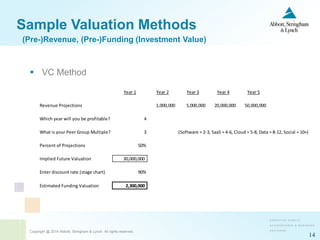
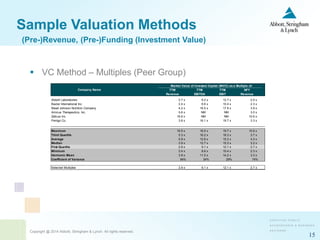
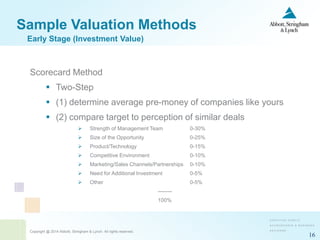
The document discusses start-up valuations, detailing the qualifications of Jeff Faust and various valuation methods, including FMV vs investment value and the 409A overview. It also outlines stages of enterprise development, associated risks, and sample valuation techniques like the VC method and scorecard method. Additionally, it presents how preferred terms impact value and provides a comparison of multiple valuation approaches based on the enterprise's stage and market conditions.


