Downloaded 267 times

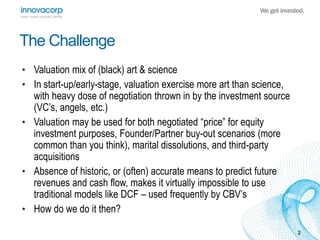
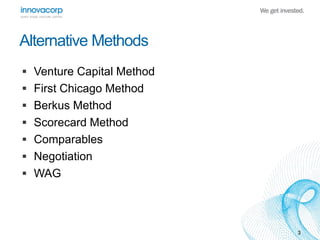
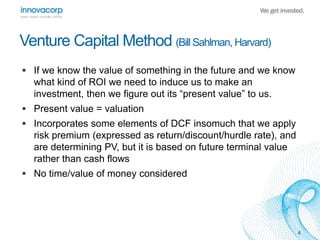
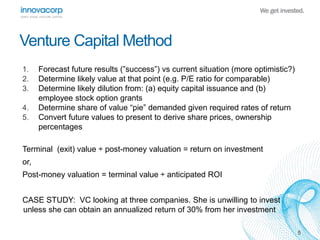
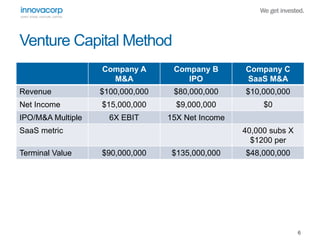
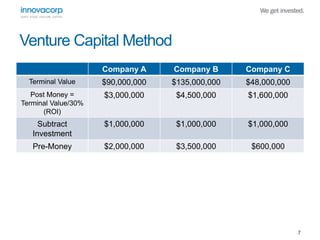
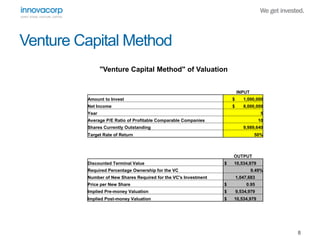
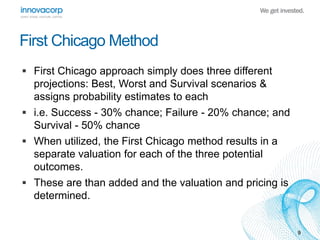
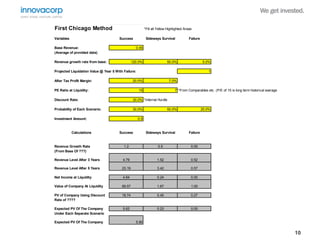
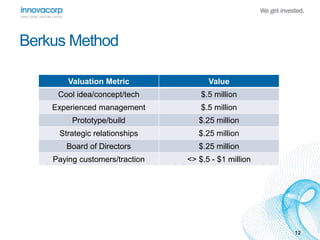


The document discusses various methods for valuing early-stage, knowledge-based, or tech companies, emphasizing that valuation involves both art and science due to the challenges of predicting future cash flows. It presents methods such as the venture capital method, first Chicago method, and Berkus method, each offering different approaches to assess company value under various scenarios. Furthermore, it highlights the importance of negotiation as an essential component in the valuation process.


