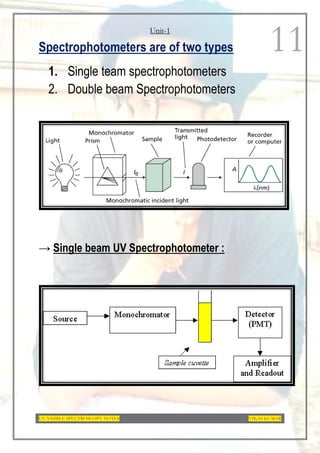
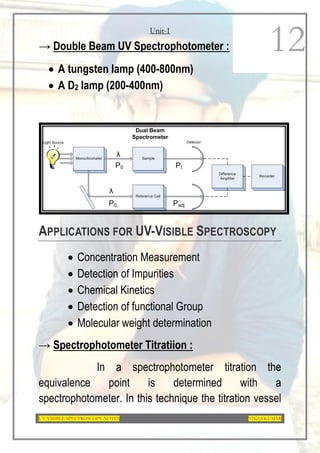
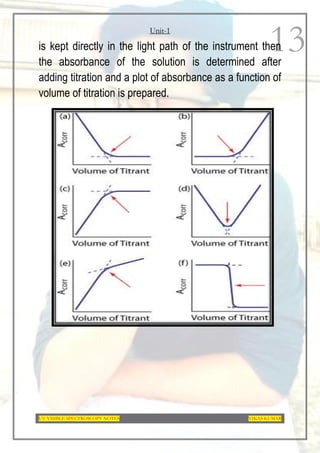
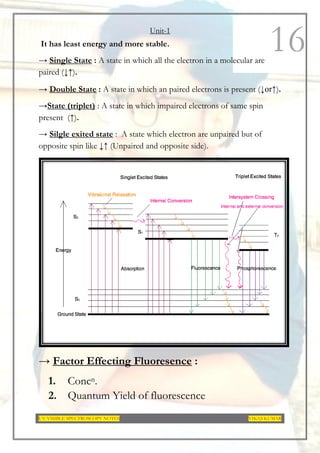
Unit-1
UV-VISIBLE SPECTROSCOPY NOTES VIKAS KUMAR
1
UV Visible Spectroscopy
Spectroscopy:- Spectroscopy is the branch of science dealing the
study of intraction of electromagnetic radiation with matter
Principle Of Spectroscopy :- The principle is based on the
measurement of spectrum of a sample containing atoms.
 Spectrum is a graph of intensity of absorbed or emitted radiation by
sample verses frequency (V) or wavelength (λ).
 Spectrometer is an instrument design to measure the Spectrum of
a compound.
Absorption Spectroscopy :- An analytical technique which concerns
with the measurement of absorption of electromagnetic radiation. Eg
UV (185-400nm) / Visible (400-800nm) spectroscopy. IR Spectroscopy
(0.76-15µm).
Emission Spectroscopy :-An analytical technique which emission of a
particle or radiation is dispersed according to some property of the
emission & the amount of dispersion is measured eg. Mass
spectroscopy.
Electromegnetic Radiation:-
Electromegnetic radiation consist of discrete packets of energy which
called as photons.
Unit-1
UV-VISIBLE SPECTROSCOPY NOTES VIKAS KUMAR
2
A photons consists of an oscillating electric field (E) & An oscillating
magnetic field (M) which are perpendicular to each other.
Properties of electromagnetic radiation:-
1) Wavelength:- it is distance b/w two successive maxima on an
electromagnetic wave. Unit are m,cm,mm,nm and micrometer.
2) Frequency:- Number of wavelength units pass time is called as
frequency. It is denoted by “V” and units are cycle per sec. Hertz.
3) Wavelength:-
𝒗 =
𝟏
𝒘𝒂𝒗𝒆𝒍𝒆𝒏𝒈𝒕𝒉
As the number of waves per cm in vaccum.
Unit-1
UV-VISIBLE SPECTROSCOPY NOTES VIKAS KUMAR
3
4) Vilocity:- it is the product of wavelength and frequency and is
equal to the velocity of the wave in the medium.
𝑣 = 𝑛 ∗λ
 The relationship b/w wavelwngth & frequency can be written
as
C=Vλ
 As photons is subjected to energy.
So 𝐄 = 𝐡𝐯 =
𝐡𝐜
𝛌
Electronic Transition:-
1) σ → σ* transition:
 The energy required is large.
 For exp. Methane (which has only C-H bonds and can only
undergo σ → σ* transition Transition) shows an absorbance
maximum at 125nm.
 Absorption maxima due to σ →σ transition are not seen in
typical UV-Vis Spectra (200-700nm) but in UV- region (125-
135nm).
2) n→σ* Transition:-
 These transition Usually need less energy then n→σ* transition.
 They can be initiated by light whose wavelength is in the range
150-250nm.
 The number of organic functional groups with n →σ* peaks in the
UV region in small.
3) π →π* Transition:-
 Π electron in a bonding orbital is exaited to corresponding
antibonding orbital π* and obserbed in conjugated compounds
Unit-1
UV-VISIBLE SPECTROSCOPY NOTES VIKAS KUMAR
4
 Eg. Alkenes generally absorb in the regin 170 to 205 nm.
4) n→π* transition:-
 n→π9 transition require minimum energy and show absorption at
longer wavelength around 300nm.
Terms Used In UV/Visible Spectroscopy
Chromophore:- The part of a molecule responsible for
imparting color are called as chromospheres.
The functional group comtaining multiple bonds capable
of absorbing radiations above 200nm due to n→π* &
Unit-1
UV-VISIBLE SPECTROSCOPY NOTES VIKAS KUMAR
5
π→π* transitions eg. NO2 , N=O, C=N, C≡N, C=C,
C=S etc.
Auxochrome:- The functional group with non bonding
electrons that dose not absorb radiation in near UV
region but when attached to a chromophore alters the
wavelength & intensity of absorption.
Eg. Benzene λmax=255nm.
Phenol λmax=270nm.
Aniline λmax=280nm.
UV Visible Spectroscopy
Theory involved :
When a beam of light falls on a solution or homogenes
media a surface of the media a portion is absorbed with
in the medium and remaining is transmitted through the
medium
Unit-1
UV-VISIBLE SPECTROSCOPY NOTES VIKAS KUMAR
6
Thus if I0 is the intensity of radiation falling on the
media.
Ir is the amount of radiations reflucted
Ia is the amount of radiation absorbed
It is the amount of radiation transmitted
Then I0=Ir+Ia+It
Law involved
1. Beer’s law
2. Lambert’s law
3. Beer- Lambert’s law
1. Beer’s law : When a beam of monochromatic
light I paased through a honogenous absorbing
medium , the rate with decrease of intensity of
radiation with increase in the concn (c) of absorbing
species is directly proportional to the intensity (I) of
incident light radiation.
Unit-1
UV-VISIBLE SPECTROSCOPY NOTES VIKAS KUMAR
7
-dI/dc=KI
-dI/I=Kdc
On integration of above equation
-In I=KC+B--------------------eq(1)
When concn =0 then there is no absorbance
Here I=I0
Therefore substituting in equation (1)
-In I=k *0+b
-In I=b
Substituting the value of b in equation (1)
-InI=Kc-In I0
In I0-InI=kc
In I0/InI=Kc (Since logA-logB=logAB)
I0/I=ekc (remaining natural logarithm)
I/I0 =e-kc (Inverse both side)
I=I0 e-kc---------------------------(2)
Unit-1
UV-VISIBLE SPECTROSCOPY NOTES VIKAS KUMAR
8
Lambeart’s law :- when a beam of monochromatic light
is passed through a homogenous absorbing medium the
ratio of decrease of intensity of radiation with thickness
of absorbing medium is directly proportional to the
intensity of the incident light (radiation)
dI/dt=KI
I=intensity of incident light of wavelength λ&
t= Thickness of medium.
Since I=I0e-kt------------------------(3)
Now combine the eq (2) and eq(3) we get
I=I0e-kct
Converting natural logarithm to base 10
I=I0 10-kct
Inverse on both side
I0I=10kct
Taking log on both side
logI0/I=Kct--------------------------(4)
Unit-1
UV-VISIBLE SPECTROSCOPY NOTES VIKAS KUMAR
9
Here transmittance (T)=I/I0 and Absorbance
(A)=logI/T
Hence, A=logI0/I-------------------------(5)
Using eq. (4) and(5)
A=Kct
Instead of K we can use E, the above equation will be
as followes
A=Ect
This is mathematical equation for beer’s Lambert’s
Law
A=Ect
Where :
A= Absorbance
E= Molecular extinction coefficient
c= Concn of sample
t= path length (normally 10mm or 1cm)
Unit-1
UV-VISIBLE SPECTROSCOPY NOTES VIKAS KUMAR
10
E can be expressed as follows
𝐸 = 𝐸1%
1𝑐𝑚 ∗ 𝑚𝑜𝑙𝑒𝑐𝑢𝑙𝑎𝑟
𝑤𝑒𝑖𝑔ℎ𝑡
10
Instrumentation :-
1. Radiation sourse :- Both the tungsten and D2
lamp are present in the UV-VS.
2. Wavwlength Selector :-
A) Filter →Absorption and interference filter are
mainly used.
B) Monochromator → It gives the desired
wavelength in the entire UV or Visible region.
C) Slits → There are two slits ie →entrance slit
And exit slit.
3. Cell or Cuvettes :- For holding the sample
solution and the pure solvent.
4. Detector :- The most commonly used detectors
are photo emissive cell or phototubes and
photomultiplier tube
5. Recording System :- Recording is done by
recorder pen.
6. Power Supply
Unit-1
UV-VISIBLE SPECTROSCOPY NOTES VIKAS KUMAR
11
Spectrophotometers are of two types
1. Single team spectrophotometers
2. Double beam Spectrophotometers
→ Single beam UV Spectrophotometer :
Unit-1
UV-VISIBLE SPECTROSCOPY NOTES VIKAS KUMAR
12
→ Double Beam UV Spectrophotometer :
 A tungsten lamp (400-800nm)
 A D2 lamp (200-400nm)
APPLICATIONS FOR UV-VISIBLE SPECTROSCOPY
 Concentration Measurement
 Detection of Impurities
 Chemical Kinetics
 Detection of functional Group
 Molecular weight determination
→ Spectrophotometer Titratiion :
In a spectrophotometer titration the
equivalence point is determined with a
spectrophotometer. In this technique the titration vessel
Unit-1
UV-VISIBLE SPECTROSCOPY NOTES VIKAS KUMAR
13
is kept directly in the light path of the instrument then
the absorbance of the solution is determined after
adding titration and a plot of absorbance as a function of
volume of titration is prepared.
Unit-1
UV-VISIBLE SPECTROSCOPY NOTES VIKAS KUMAR
14
Single Component Analysis Methods
1. Direct Analysis : essentially all compounds containing conjugated
double bond or aromatic rings and many inorganic species absorb
light in the UV Visible region.
2. Indirect Analysis : This method involves analysis after addition
of some reasen. Chemical derivation may be adopted for any of
the several reasons.
1. If the analyte absorbs weekly in the UV-region
2. This technique can be used to improve the selectivity of the
assay in presence of other UV radiation absorbing substance.
3. Cost.
Methods of calculating concentration in
single compartment analysis
1. By using the relationship A=abc
2. By using the formula Cu=(Au/As)*Cs
3. By using the equation Y= mx+c
4. By using the Beer’s Curve
Multicomponents analysis methods
UV Spectrophotometric techniques are mainly used for multicomponent
analysis, thus minimizing the cumbersome task of seprating interferents
and allowing the determination of an increasing number of analytes
consequently redusing analysis time and cost.
Unit-1
UV-VISIBLE SPECTROSCOPY NOTES VIKAS KUMAR
15
Multicomponent UC Spectrophotometric method are based on
recording and mathmetically processing absorption Spectra.
Advantages :
1. Avoid prior spectration technique and clean up steps that might be
required.
2. Spectral data are readily acquired with ease.
3. The process is fast accurate and simple.
4. Wide applicability to both organic and inorganic systems.
5. Typical detection limits of 10-4
to 10-5
m and moderate to high
selectivity.
Different UV Spectrophotometric multicomponent analysis
method include.
1. Difference Spectrophotometry.
2. Derivative Spectrophotomerty.
3. Absorbance ratio spectra method.
4. Derivative ratio spectra method.
5. Dual wavelength method.
Fluorimetry
It is the measurement of fuoressence intensity at a particular wavelength
with the help of a filter fluorimeter or a spectrofluorimeter.
PRINCIPAL : Molecular contain (σ electron) (π electron) and non
bonding n electron
The electron may be prevent in bonding molecular orbital also
called highest occupied molecular orbital (HOMO).
Unit-1
UV-VISIBLE SPECTROSCOPY NOTES VIKAS KUMAR
16
It has least energy and more stable.
→ Single State : A state in which all the electron in a molecular are
paired (↓↑).
→ Double State : A state in which an paired electrons is present (↓or↑).
→State (triplet) : A state in which impaired electrons of same spin
present (↑).
→ Silgle exited state : A state which electron are unpaired but of
opposite spin like ↓↑ (Unpaired and opposite side).
→ Factor Effecting Fluoresence :
1. Concn.
2. Quantum Yield of fluorescence
Unit-1
UV-VISIBLE SPECTROSCOPY NOTES VIKAS KUMAR
17
3. Intansity of incident light
4. Oxygen
5. pH
6. Temprature
7. Absorbance
Instrumentation :
Fluoracence in the instrument measuring fluorescence
intensity (F) is includes the Following Components.
1. Light sources
2. Monochromators/Filter.
3. Sample cells (Cuvetts).
4. Detectors
5. Polarisers
Source collimator Monochromotar(P1) Sample Detector Amplifire
Slit Monochromator(P2)
→ Instruments :→
1. Singe Beam (Filter) Fluorimeter
2. Double Beam (Filter) Fluorimeter
3. Spectrofluorimeter (Double Beam)
Unit-1
UV-VISIBLE SPECTROSCOPY NOTES VIKAS KUMAR
18
→ Singl Beam Fluorimeter :
Single beam instruments are simple in construction
cheaper and easy to operate.
→ Double Beam Fluorimeter :
Unit-1
UV-VISIBLE SPECTROSCOPY NOTES VIKAS KUMAR
19
→ Conclusion :
1. Fluorimetric method are not usefull in qualitative analysis
vand much use in quantitative analysis.
2. Fluorience is the most sensitive analytical techniques.
3. Detection studies will increase the development of flaurence
field.
→ Application :
1. Determination of ruthenium.
2. Determination of vanadium.
3. Determination of boron in steel.
4. Determination of aluminium in alloys.
5. Determination of chrominium and manganese.
6. Determination of uranium salts.
Thank You
Made by DRx Vikas

UV-Visible Spectroscopy

  • 1.
    Unit-1 UV-VISIBLE SPECTROSCOPY NOTESVIKAS KUMAR 1 UV Visible Spectroscopy Spectroscopy:- Spectroscopy is the branch of science dealing the study of intraction of electromagnetic radiation with matter Principle Of Spectroscopy :- The principle is based on the measurement of spectrum of a sample containing atoms.  Spectrum is a graph of intensity of absorbed or emitted radiation by sample verses frequency (V) or wavelength (λ).  Spectrometer is an instrument design to measure the Spectrum of a compound. Absorption Spectroscopy :- An analytical technique which concerns with the measurement of absorption of electromagnetic radiation. Eg UV (185-400nm) / Visible (400-800nm) spectroscopy. IR Spectroscopy (0.76-15µm). Emission Spectroscopy :-An analytical technique which emission of a particle or radiation is dispersed according to some property of the emission & the amount of dispersion is measured eg. Mass spectroscopy. Electromegnetic Radiation:- Electromegnetic radiation consist of discrete packets of energy which called as photons.
  • 2.
    Unit-1 UV-VISIBLE SPECTROSCOPY NOTESVIKAS KUMAR 2 A photons consists of an oscillating electric field (E) & An oscillating magnetic field (M) which are perpendicular to each other. Properties of electromagnetic radiation:- 1) Wavelength:- it is distance b/w two successive maxima on an electromagnetic wave. Unit are m,cm,mm,nm and micrometer. 2) Frequency:- Number of wavelength units pass time is called as frequency. It is denoted by “V” and units are cycle per sec. Hertz. 3) Wavelength:- 𝒗 = 𝟏 𝒘𝒂𝒗𝒆𝒍𝒆𝒏𝒈𝒕𝒉 As the number of waves per cm in vaccum.
  • 3.
    Unit-1 UV-VISIBLE SPECTROSCOPY NOTESVIKAS KUMAR 3 4) Vilocity:- it is the product of wavelength and frequency and is equal to the velocity of the wave in the medium. 𝑣 = 𝑛 ∗λ  The relationship b/w wavelwngth & frequency can be written as C=Vλ  As photons is subjected to energy. So 𝐄 = 𝐡𝐯 = 𝐡𝐜 𝛌 Electronic Transition:- 1) σ → σ* transition:  The energy required is large.  For exp. Methane (which has only C-H bonds and can only undergo σ → σ* transition Transition) shows an absorbance maximum at 125nm.  Absorption maxima due to σ →σ transition are not seen in typical UV-Vis Spectra (200-700nm) but in UV- region (125- 135nm). 2) n→σ* Transition:-  These transition Usually need less energy then n→σ* transition.  They can be initiated by light whose wavelength is in the range 150-250nm.  The number of organic functional groups with n →σ* peaks in the UV region in small. 3) π →π* Transition:-  Π electron in a bonding orbital is exaited to corresponding antibonding orbital π* and obserbed in conjugated compounds
  • 4.
    Unit-1 UV-VISIBLE SPECTROSCOPY NOTESVIKAS KUMAR 4  Eg. Alkenes generally absorb in the regin 170 to 205 nm. 4) n→π* transition:-  n→π9 transition require minimum energy and show absorption at longer wavelength around 300nm. Terms Used In UV/Visible Spectroscopy Chromophore:- The part of a molecule responsible for imparting color are called as chromospheres. The functional group comtaining multiple bonds capable of absorbing radiations above 200nm due to n→π* &
  • 5.
    Unit-1 UV-VISIBLE SPECTROSCOPY NOTESVIKAS KUMAR 5 π→π* transitions eg. NO2 , N=O, C=N, C≡N, C=C, C=S etc. Auxochrome:- The functional group with non bonding electrons that dose not absorb radiation in near UV region but when attached to a chromophore alters the wavelength & intensity of absorption. Eg. Benzene λmax=255nm. Phenol λmax=270nm. Aniline λmax=280nm. UV Visible Spectroscopy Theory involved : When a beam of light falls on a solution or homogenes media a surface of the media a portion is absorbed with in the medium and remaining is transmitted through the medium
  • 6.
    Unit-1 UV-VISIBLE SPECTROSCOPY NOTESVIKAS KUMAR 6 Thus if I0 is the intensity of radiation falling on the media. Ir is the amount of radiations reflucted Ia is the amount of radiation absorbed It is the amount of radiation transmitted Then I0=Ir+Ia+It Law involved 1. Beer’s law 2. Lambert’s law 3. Beer- Lambert’s law 1. Beer’s law : When a beam of monochromatic light I paased through a honogenous absorbing medium , the rate with decrease of intensity of radiation with increase in the concn (c) of absorbing species is directly proportional to the intensity (I) of incident light radiation.
  • 7.
    Unit-1 UV-VISIBLE SPECTROSCOPY NOTESVIKAS KUMAR 7 -dI/dc=KI -dI/I=Kdc On integration of above equation -In I=KC+B--------------------eq(1) When concn =0 then there is no absorbance Here I=I0 Therefore substituting in equation (1) -In I=k *0+b -In I=b Substituting the value of b in equation (1) -InI=Kc-In I0 In I0-InI=kc In I0/InI=Kc (Since logA-logB=logAB) I0/I=ekc (remaining natural logarithm) I/I0 =e-kc (Inverse both side) I=I0 e-kc---------------------------(2)
  • 8.
    Unit-1 UV-VISIBLE SPECTROSCOPY NOTESVIKAS KUMAR 8 Lambeart’s law :- when a beam of monochromatic light is passed through a homogenous absorbing medium the ratio of decrease of intensity of radiation with thickness of absorbing medium is directly proportional to the intensity of the incident light (radiation) dI/dt=KI I=intensity of incident light of wavelength λ& t= Thickness of medium. Since I=I0e-kt------------------------(3) Now combine the eq (2) and eq(3) we get I=I0e-kct Converting natural logarithm to base 10 I=I0 10-kct Inverse on both side I0I=10kct Taking log on both side logI0/I=Kct--------------------------(4)
  • 9.
    Unit-1 UV-VISIBLE SPECTROSCOPY NOTESVIKAS KUMAR 9 Here transmittance (T)=I/I0 and Absorbance (A)=logI/T Hence, A=logI0/I-------------------------(5) Using eq. (4) and(5) A=Kct Instead of K we can use E, the above equation will be as followes A=Ect This is mathematical equation for beer’s Lambert’s Law A=Ect Where : A= Absorbance E= Molecular extinction coefficient c= Concn of sample t= path length (normally 10mm or 1cm)
  • 10.
    Unit-1 UV-VISIBLE SPECTROSCOPY NOTESVIKAS KUMAR 10 E can be expressed as follows 𝐸 = 𝐸1% 1𝑐𝑚 ∗ 𝑚𝑜𝑙𝑒𝑐𝑢𝑙𝑎𝑟 𝑤𝑒𝑖𝑔ℎ𝑡 10 Instrumentation :- 1. Radiation sourse :- Both the tungsten and D2 lamp are present in the UV-VS. 2. Wavwlength Selector :- A) Filter →Absorption and interference filter are mainly used. B) Monochromator → It gives the desired wavelength in the entire UV or Visible region. C) Slits → There are two slits ie →entrance slit And exit slit. 3. Cell or Cuvettes :- For holding the sample solution and the pure solvent. 4. Detector :- The most commonly used detectors are photo emissive cell or phototubes and photomultiplier tube 5. Recording System :- Recording is done by recorder pen. 6. Power Supply
  • 11.
    Unit-1 UV-VISIBLE SPECTROSCOPY NOTESVIKAS KUMAR 11 Spectrophotometers are of two types 1. Single team spectrophotometers 2. Double beam Spectrophotometers → Single beam UV Spectrophotometer :
  • 12.
    Unit-1 UV-VISIBLE SPECTROSCOPY NOTESVIKAS KUMAR 12 → Double Beam UV Spectrophotometer :  A tungsten lamp (400-800nm)  A D2 lamp (200-400nm) APPLICATIONS FOR UV-VISIBLE SPECTROSCOPY  Concentration Measurement  Detection of Impurities  Chemical Kinetics  Detection of functional Group  Molecular weight determination → Spectrophotometer Titratiion : In a spectrophotometer titration the equivalence point is determined with a spectrophotometer. In this technique the titration vessel
  • 13.
    Unit-1 UV-VISIBLE SPECTROSCOPY NOTESVIKAS KUMAR 13 is kept directly in the light path of the instrument then the absorbance of the solution is determined after adding titration and a plot of absorbance as a function of volume of titration is prepared.
  • 14.
    Unit-1 UV-VISIBLE SPECTROSCOPY NOTESVIKAS KUMAR 14 Single Component Analysis Methods 1. Direct Analysis : essentially all compounds containing conjugated double bond or aromatic rings and many inorganic species absorb light in the UV Visible region. 2. Indirect Analysis : This method involves analysis after addition of some reasen. Chemical derivation may be adopted for any of the several reasons. 1. If the analyte absorbs weekly in the UV-region 2. This technique can be used to improve the selectivity of the assay in presence of other UV radiation absorbing substance. 3. Cost. Methods of calculating concentration in single compartment analysis 1. By using the relationship A=abc 2. By using the formula Cu=(Au/As)*Cs 3. By using the equation Y= mx+c 4. By using the Beer’s Curve Multicomponents analysis methods UV Spectrophotometric techniques are mainly used for multicomponent analysis, thus minimizing the cumbersome task of seprating interferents and allowing the determination of an increasing number of analytes consequently redusing analysis time and cost.
  • 15.
    Unit-1 UV-VISIBLE SPECTROSCOPY NOTESVIKAS KUMAR 15 Multicomponent UC Spectrophotometric method are based on recording and mathmetically processing absorption Spectra. Advantages : 1. Avoid prior spectration technique and clean up steps that might be required. 2. Spectral data are readily acquired with ease. 3. The process is fast accurate and simple. 4. Wide applicability to both organic and inorganic systems. 5. Typical detection limits of 10-4 to 10-5 m and moderate to high selectivity. Different UV Spectrophotometric multicomponent analysis method include. 1. Difference Spectrophotometry. 2. Derivative Spectrophotomerty. 3. Absorbance ratio spectra method. 4. Derivative ratio spectra method. 5. Dual wavelength method. Fluorimetry It is the measurement of fuoressence intensity at a particular wavelength with the help of a filter fluorimeter or a spectrofluorimeter. PRINCIPAL : Molecular contain (σ electron) (π electron) and non bonding n electron The electron may be prevent in bonding molecular orbital also called highest occupied molecular orbital (HOMO).
  • 16.
    Unit-1 UV-VISIBLE SPECTROSCOPY NOTESVIKAS KUMAR 16 It has least energy and more stable. → Single State : A state in which all the electron in a molecular are paired (↓↑). → Double State : A state in which an paired electrons is present (↓or↑). →State (triplet) : A state in which impaired electrons of same spin present (↑). → Silgle exited state : A state which electron are unpaired but of opposite spin like ↓↑ (Unpaired and opposite side). → Factor Effecting Fluoresence : 1. Concn. 2. Quantum Yield of fluorescence
  • 17.
    Unit-1 UV-VISIBLE SPECTROSCOPY NOTESVIKAS KUMAR 17 3. Intansity of incident light 4. Oxygen 5. pH 6. Temprature 7. Absorbance Instrumentation : Fluoracence in the instrument measuring fluorescence intensity (F) is includes the Following Components. 1. Light sources 2. Monochromators/Filter. 3. Sample cells (Cuvetts). 4. Detectors 5. Polarisers Source collimator Monochromotar(P1) Sample Detector Amplifire Slit Monochromator(P2) → Instruments :→ 1. Singe Beam (Filter) Fluorimeter 2. Double Beam (Filter) Fluorimeter 3. Spectrofluorimeter (Double Beam)
  • 18.
    Unit-1 UV-VISIBLE SPECTROSCOPY NOTESVIKAS KUMAR 18 → Singl Beam Fluorimeter : Single beam instruments are simple in construction cheaper and easy to operate. → Double Beam Fluorimeter :
  • 19.
    Unit-1 UV-VISIBLE SPECTROSCOPY NOTESVIKAS KUMAR 19 → Conclusion : 1. Fluorimetric method are not usefull in qualitative analysis vand much use in quantitative analysis. 2. Fluorience is the most sensitive analytical techniques. 3. Detection studies will increase the development of flaurence field. → Application : 1. Determination of ruthenium. 2. Determination of vanadium. 3. Determination of boron in steel. 4. Determination of aluminium in alloys. 5. Determination of chrominium and manganese. 6. Determination of uranium salts. Thank You Made by DRx Vikas