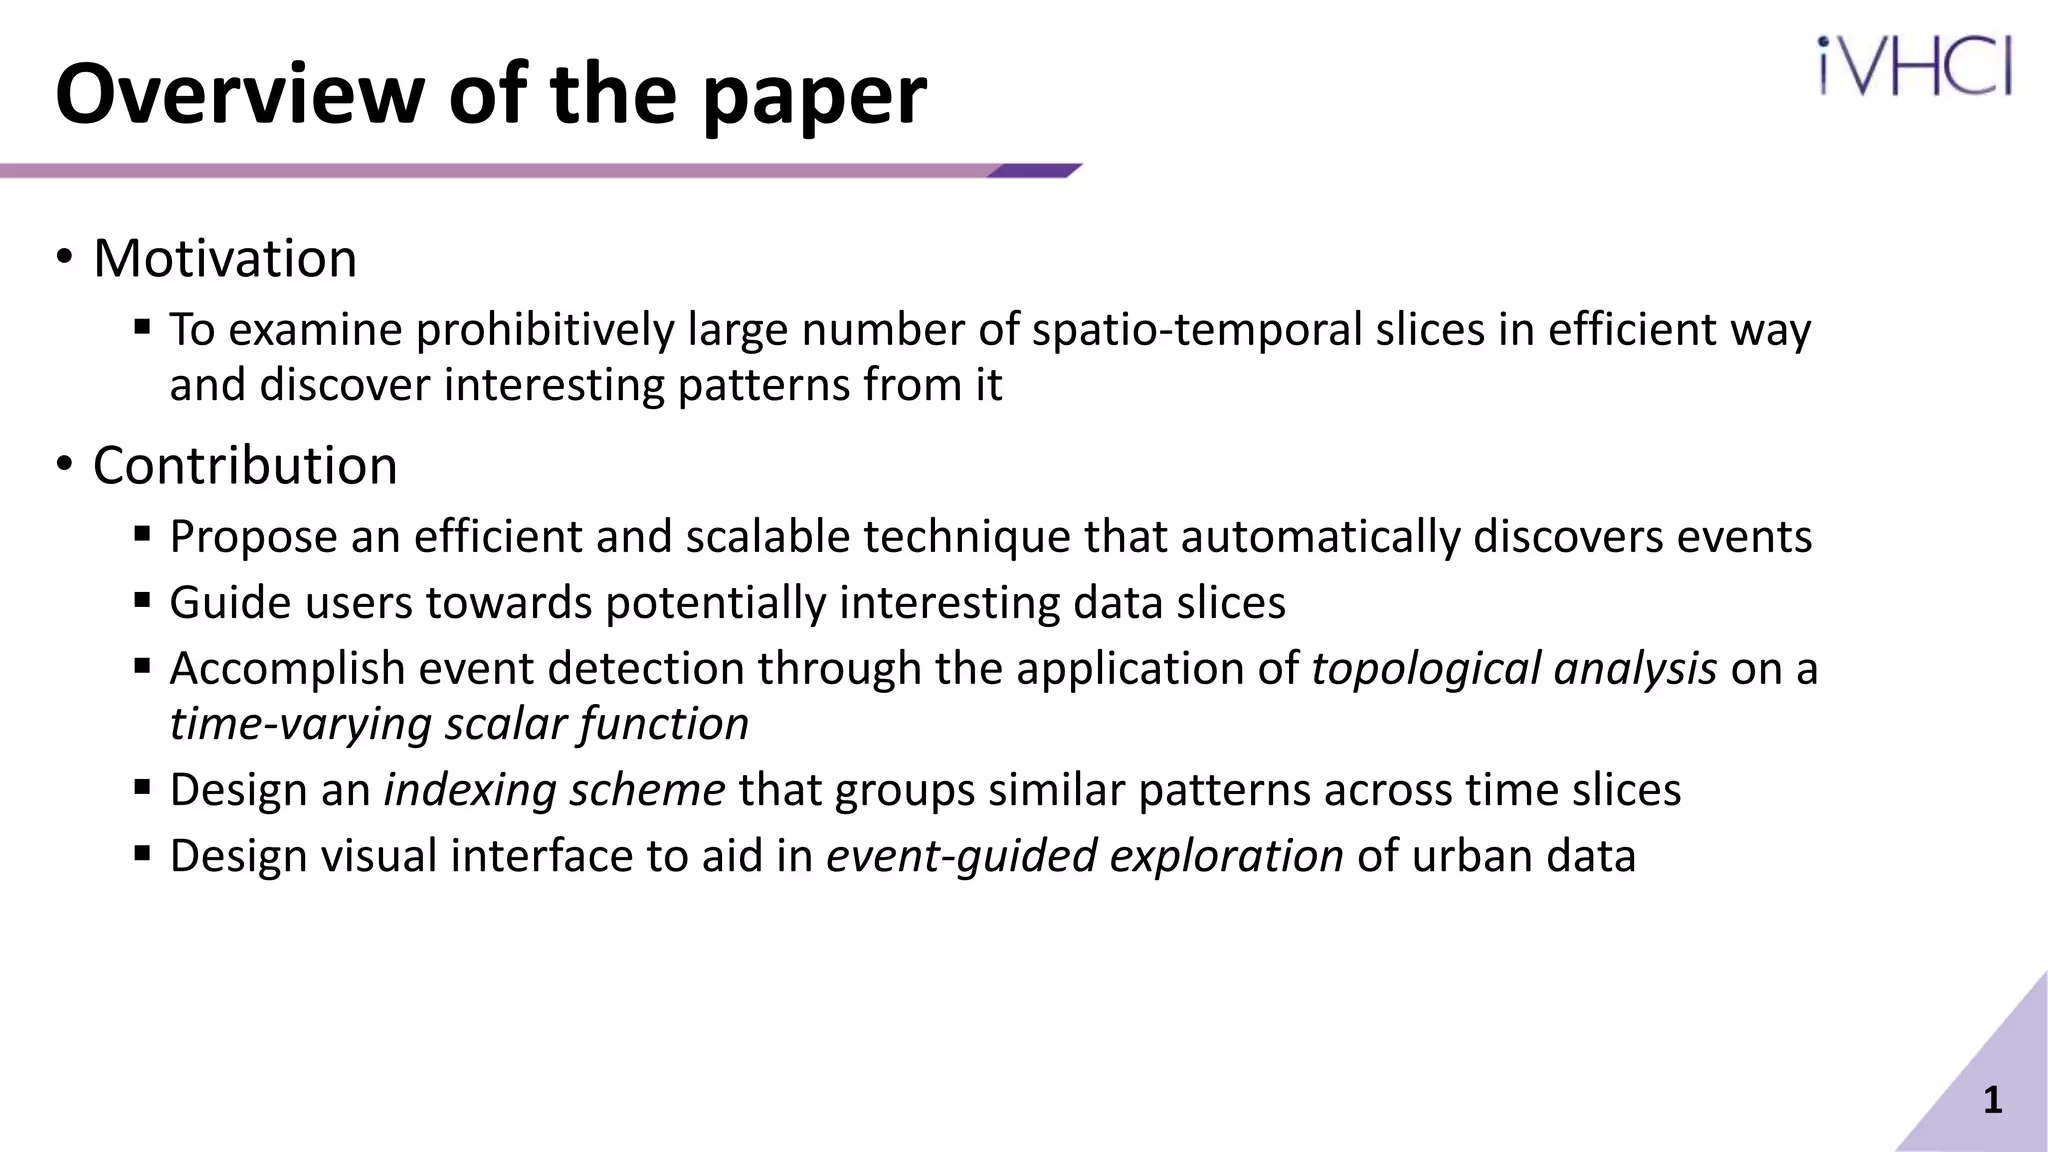
1) The paper proposes a technique to efficiently analyze large spatio-temporal urban data sets and automatically detect meaningful events using topological analysis.
2) It designs an indexing scheme to group similar event patterns across time slices and a visual interface to guide exploratory analysis.
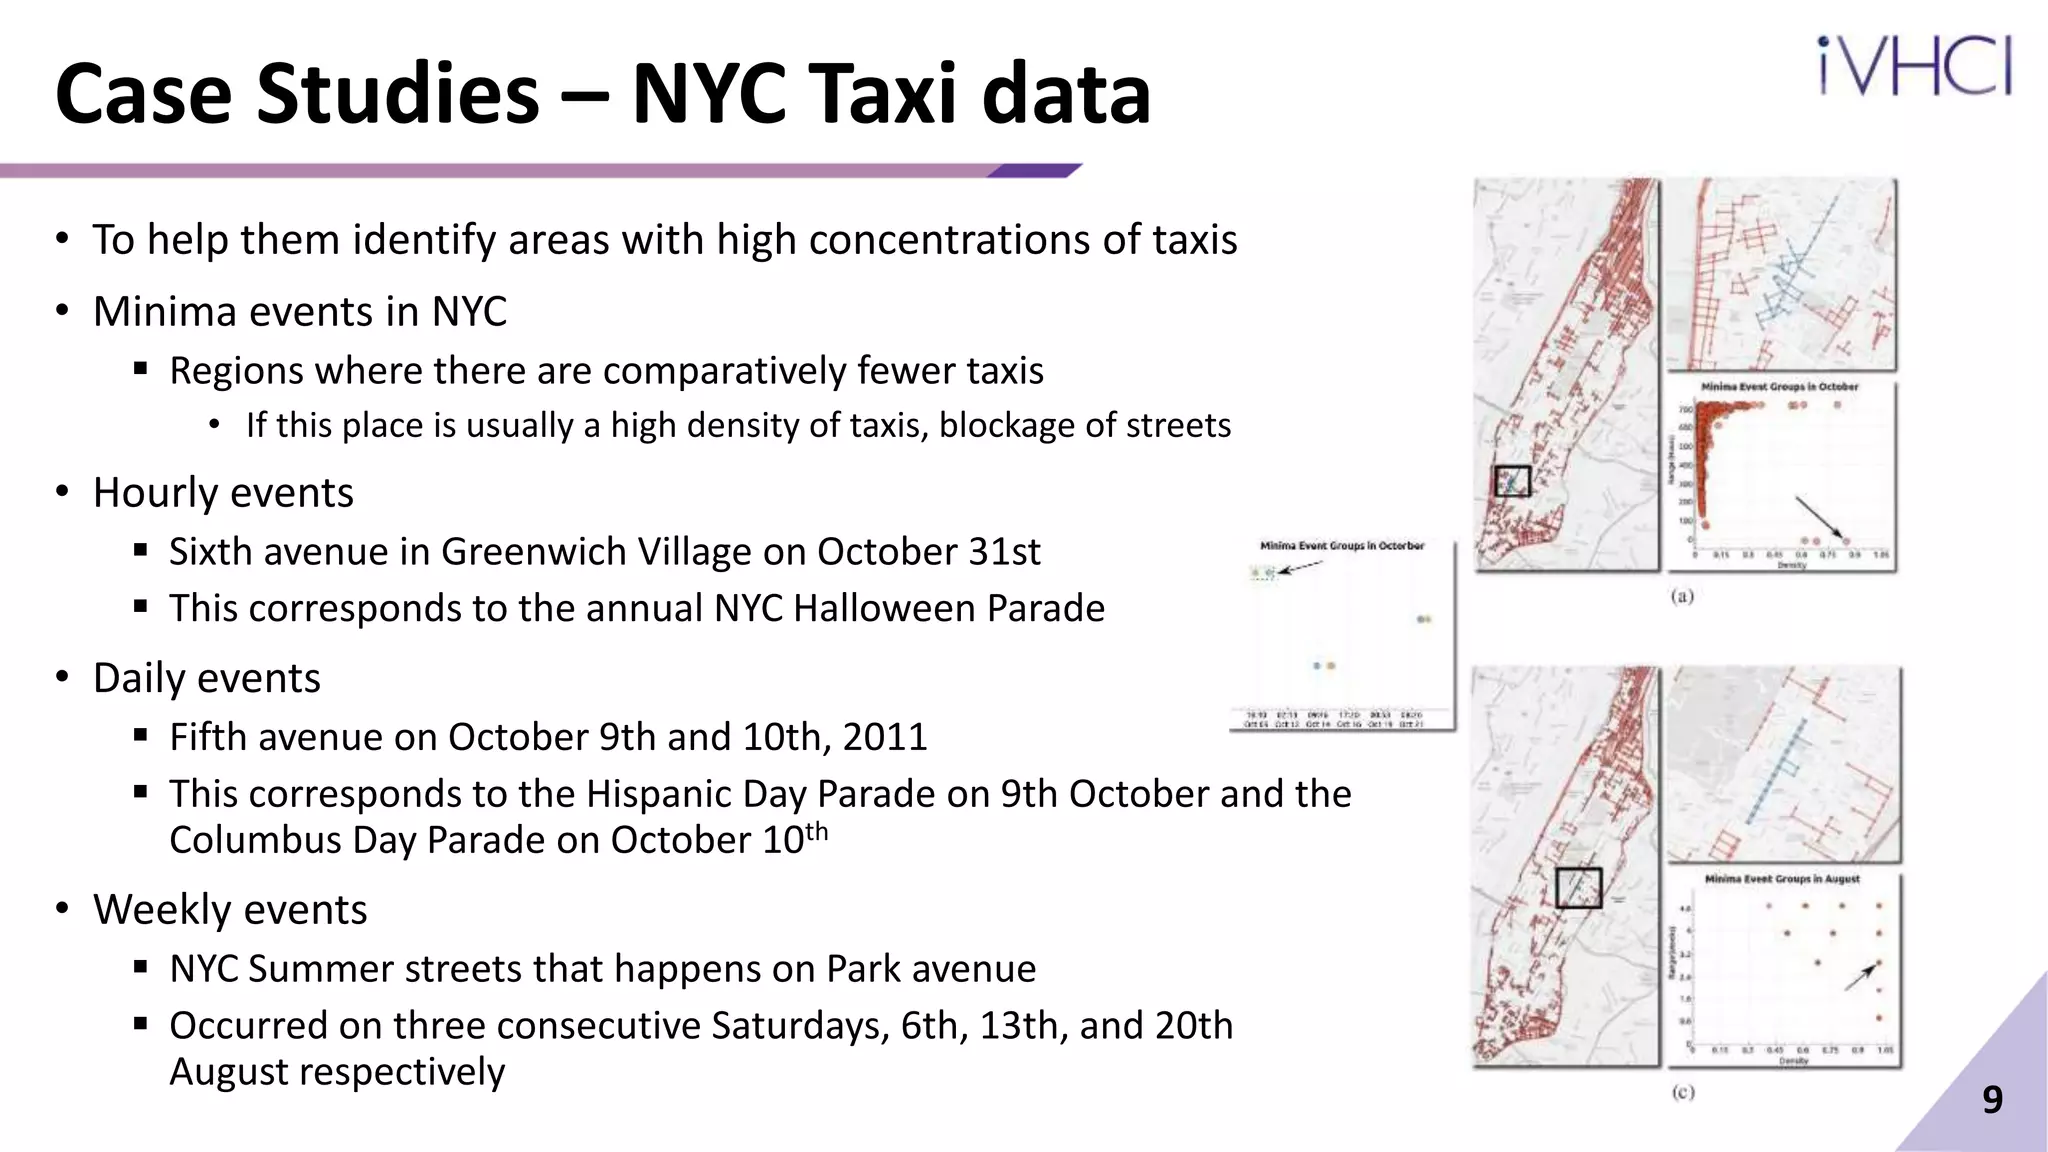
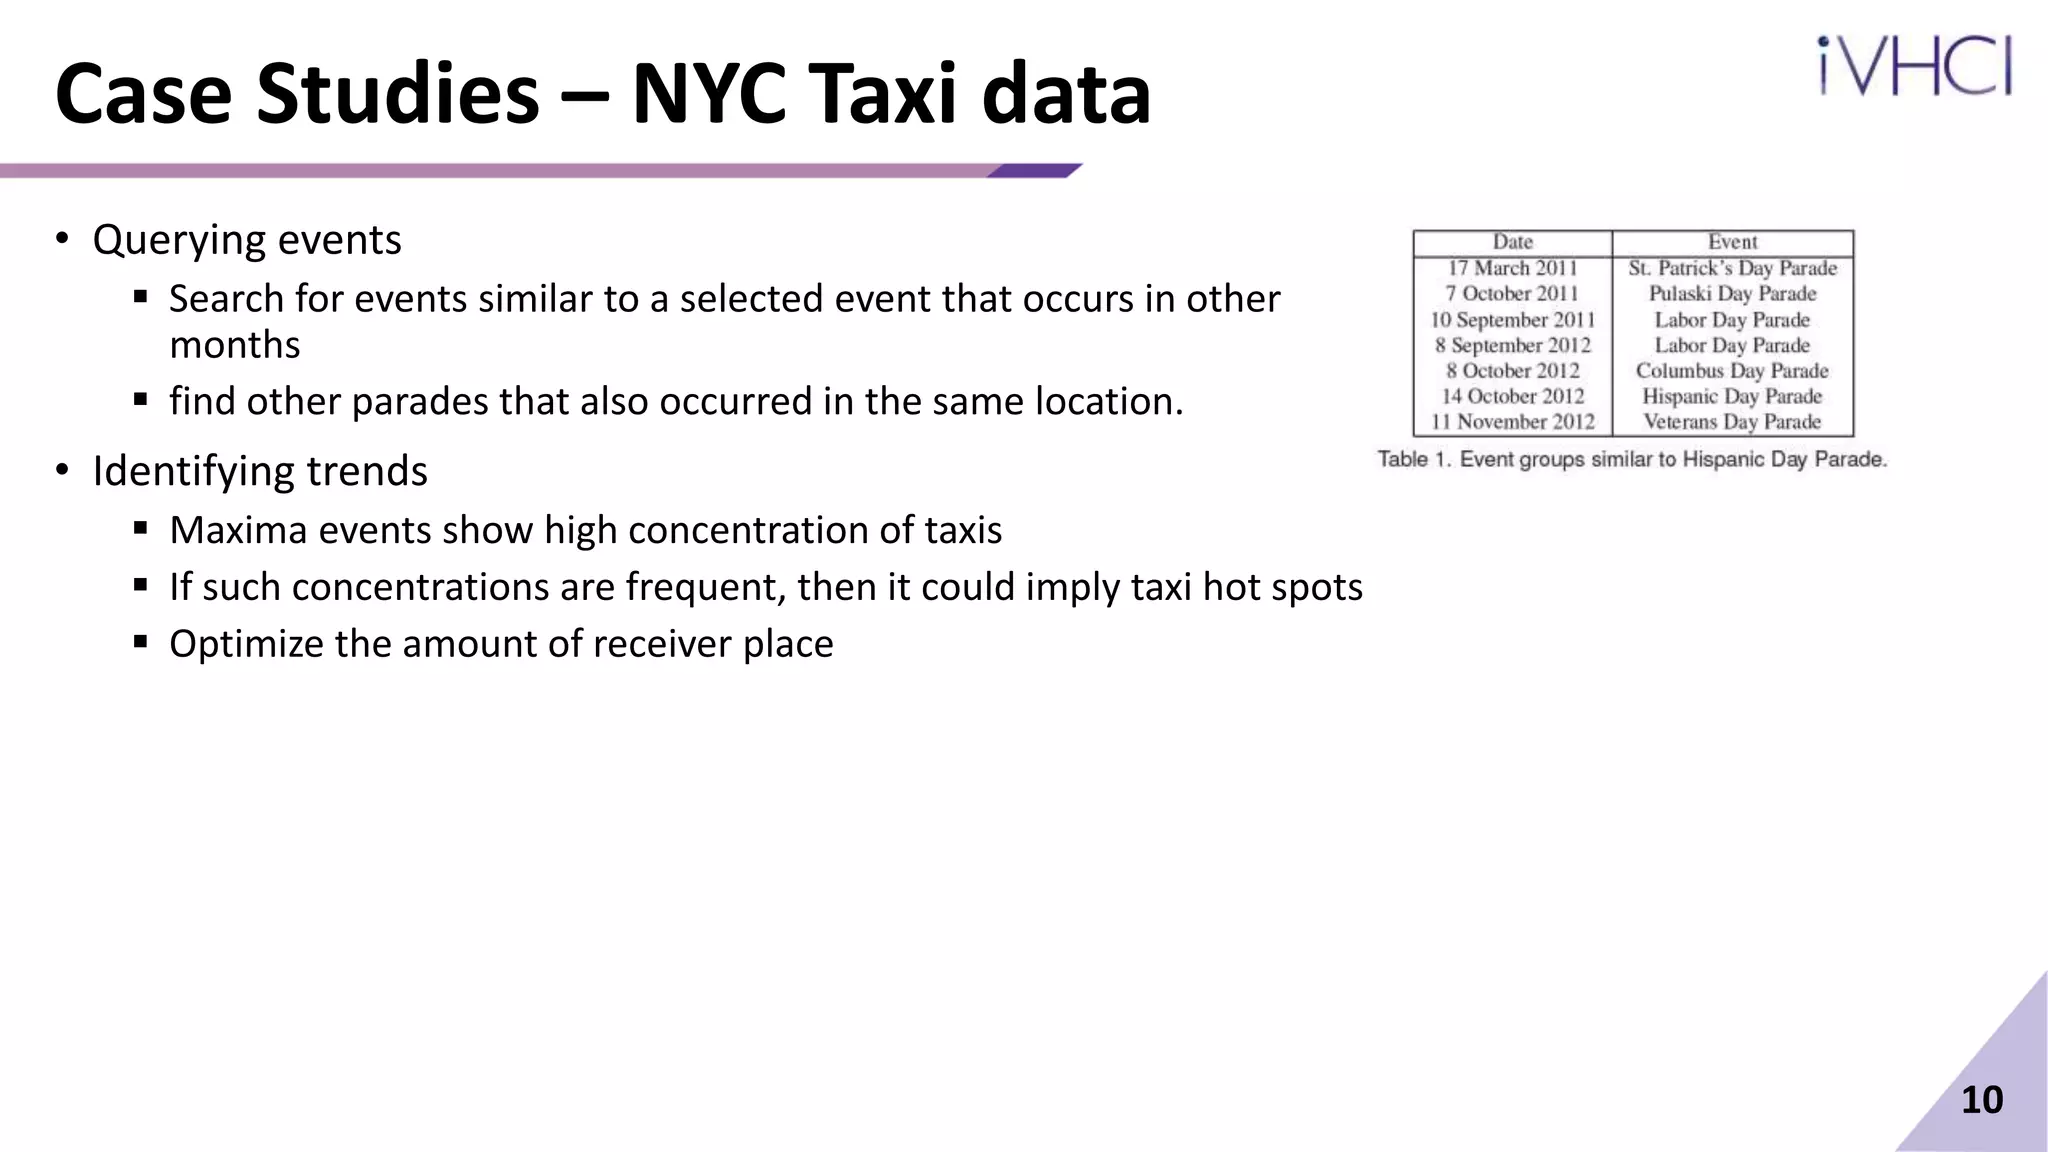
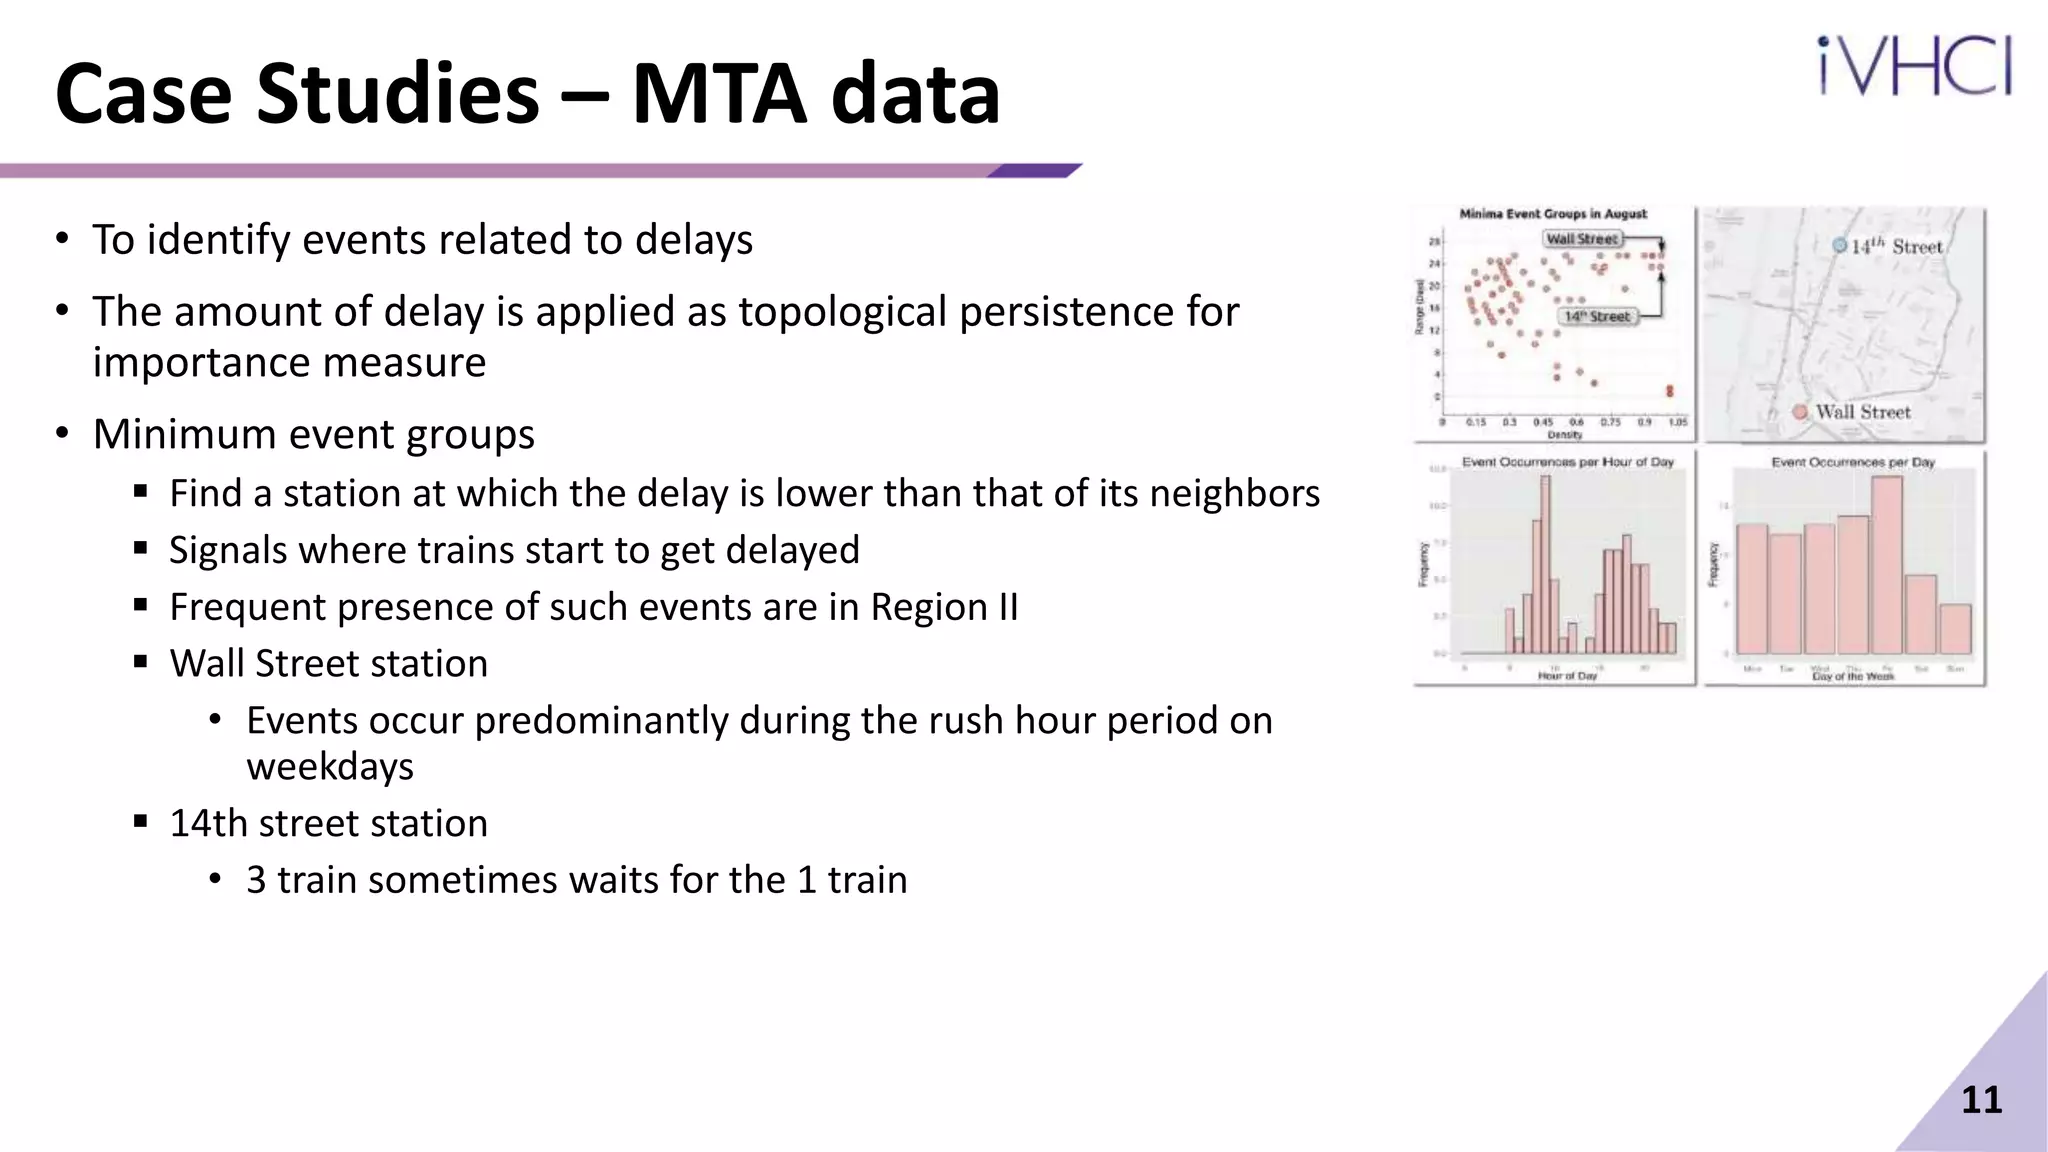
3) Case studies on NYC taxi and subway data demonstrate how the technique can identify irregular traffic events like parades as well as regular hot spots and delay patterns to support analysis of these urban systems.
![Background
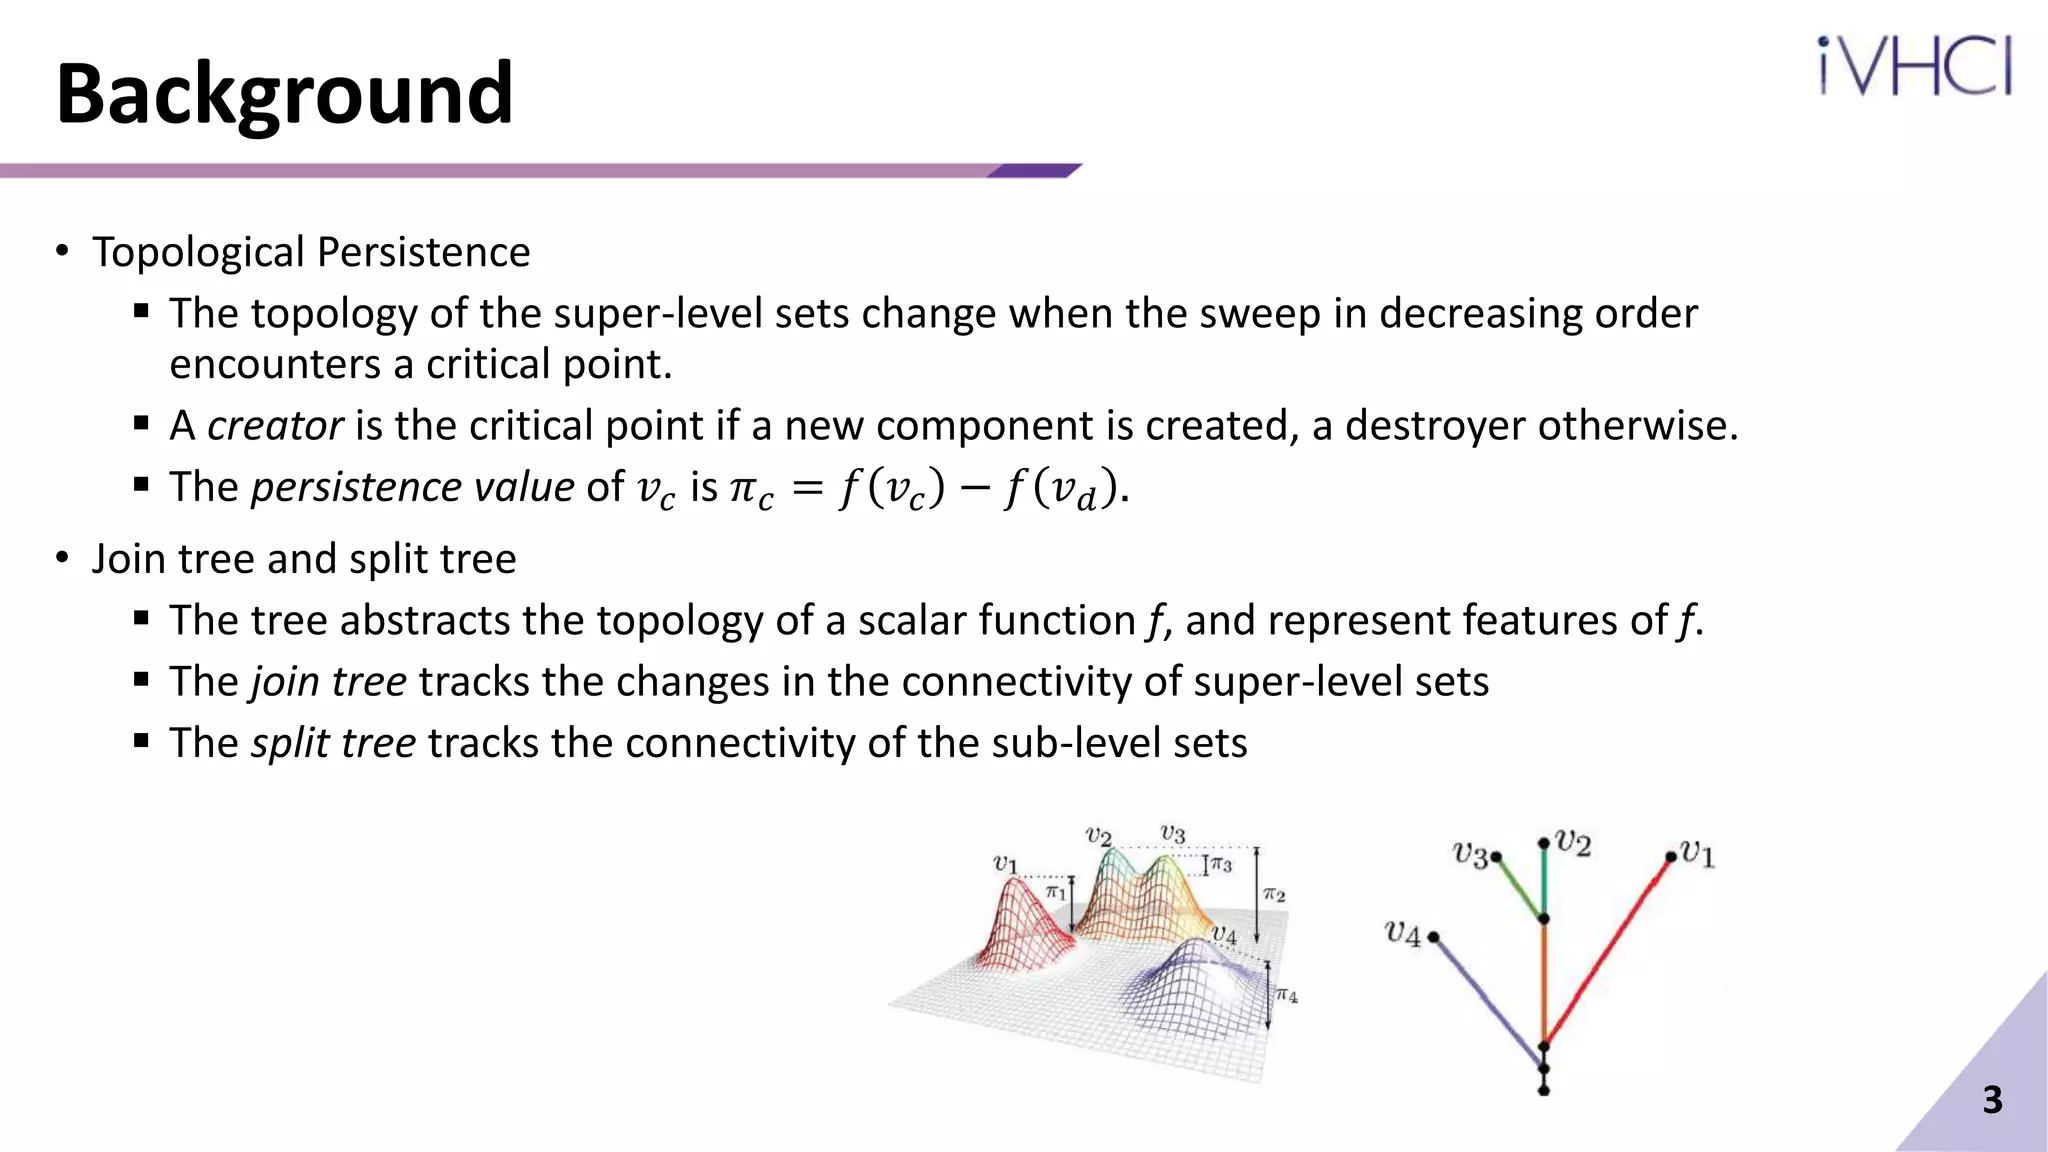
• A scalar function maps points in a spatial domain.
The function value at each point on this graph is equal to the point’s y-coordinate.
• A super-level set of a real value a is the pre-image of the interval [a,+∞).
• A sub-level set of a is the pre-image of the interval (−∞,a].
• Critical points of a smooth real-valued function are exactly where the gradient becomes zero.
Topological changes occur at critical points.
A maximum captures a peak of the function, where the function value is higher than its
neighborhood.
A minimum captures a valley of the function.
• Regular points are the points that are not critical.
Topology of the super-level (sub-level) set is preserved across regular points.
2](https://image.slidesharecdn.com/usingtopologicalanalysistosupportevent-guidedexplorationinurbandata-210226045805/75/Using-topological-analysis-to-support-event-guided-exploration-in-urban-data-3-2048.jpg)
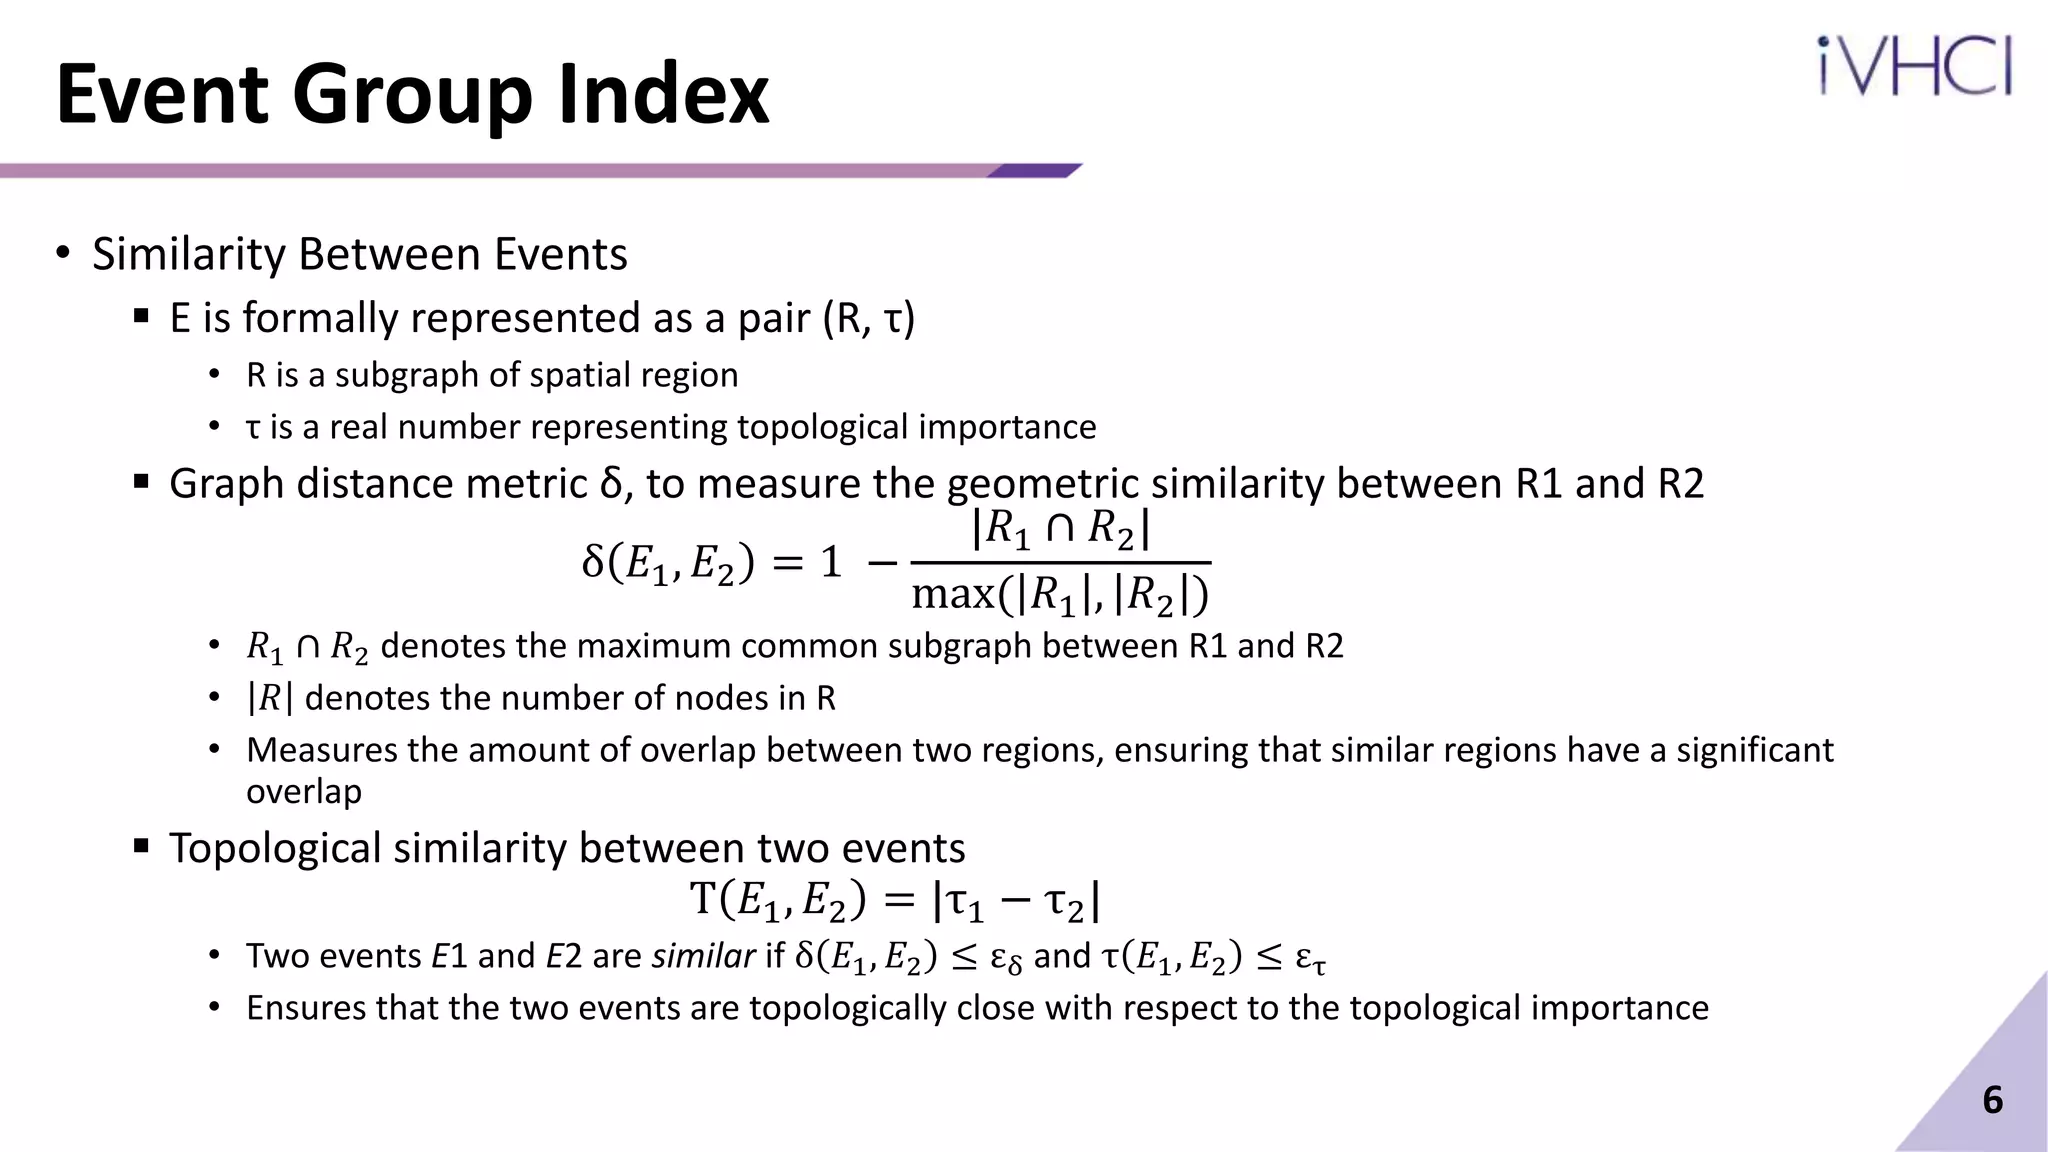
![Event Group and Event Group Key
• Use a time period equal to one month
not to miss periodic events
not to create a computational bottleneck
• Given an event group Σ = 𝐸1, 𝐸2, … , 𝐸𝑘 , define the event group key of Σ as (𝑅Σ, τΣ)
𝑅Σ =
𝑖∈[1,𝑘]
𝑅𝑖 𝑎𝑛𝑑 τΣ =
𝑖=1
𝑘
τ𝑖/𝑘
• 𝑅𝛴 is the maximum common subgraph of the geometric regions overlap for similarity condition
• τΣ captures average of the topological importance
• Follows definition of geometric and topological similarity measures
• The definition of event group key helps in using a consistent definition for the similarity between event
groups
• When two similar event groups are found, they are merged into a single group
• With given query, perform a linear search over the set to find events
7](https://image.slidesharecdn.com/usingtopologicalanalysistosupportevent-guidedexplorationinurbandata-210226045805/75/Using-topological-analysis-to-support-event-guided-exploration-in-urban-data-8-2048.jpg)


![[Seminar] hyunwook 0624](https://cdn.slidesharecdn.com/ss_thumbnails/seminarhyunwook0624-200725001151-thumbnail.jpg?width=640&height=640&fit=bounds)


![Vibe Coding vs. Spec-Driven Development [Free Meetup]](https://cdn.slidesharecdn.com/ss_thumbnails/vibecodingvsspecdrivendevelopment-251209105622-43f455e7-thumbnail.jpg?width=640&height=640&fit=bounds)


