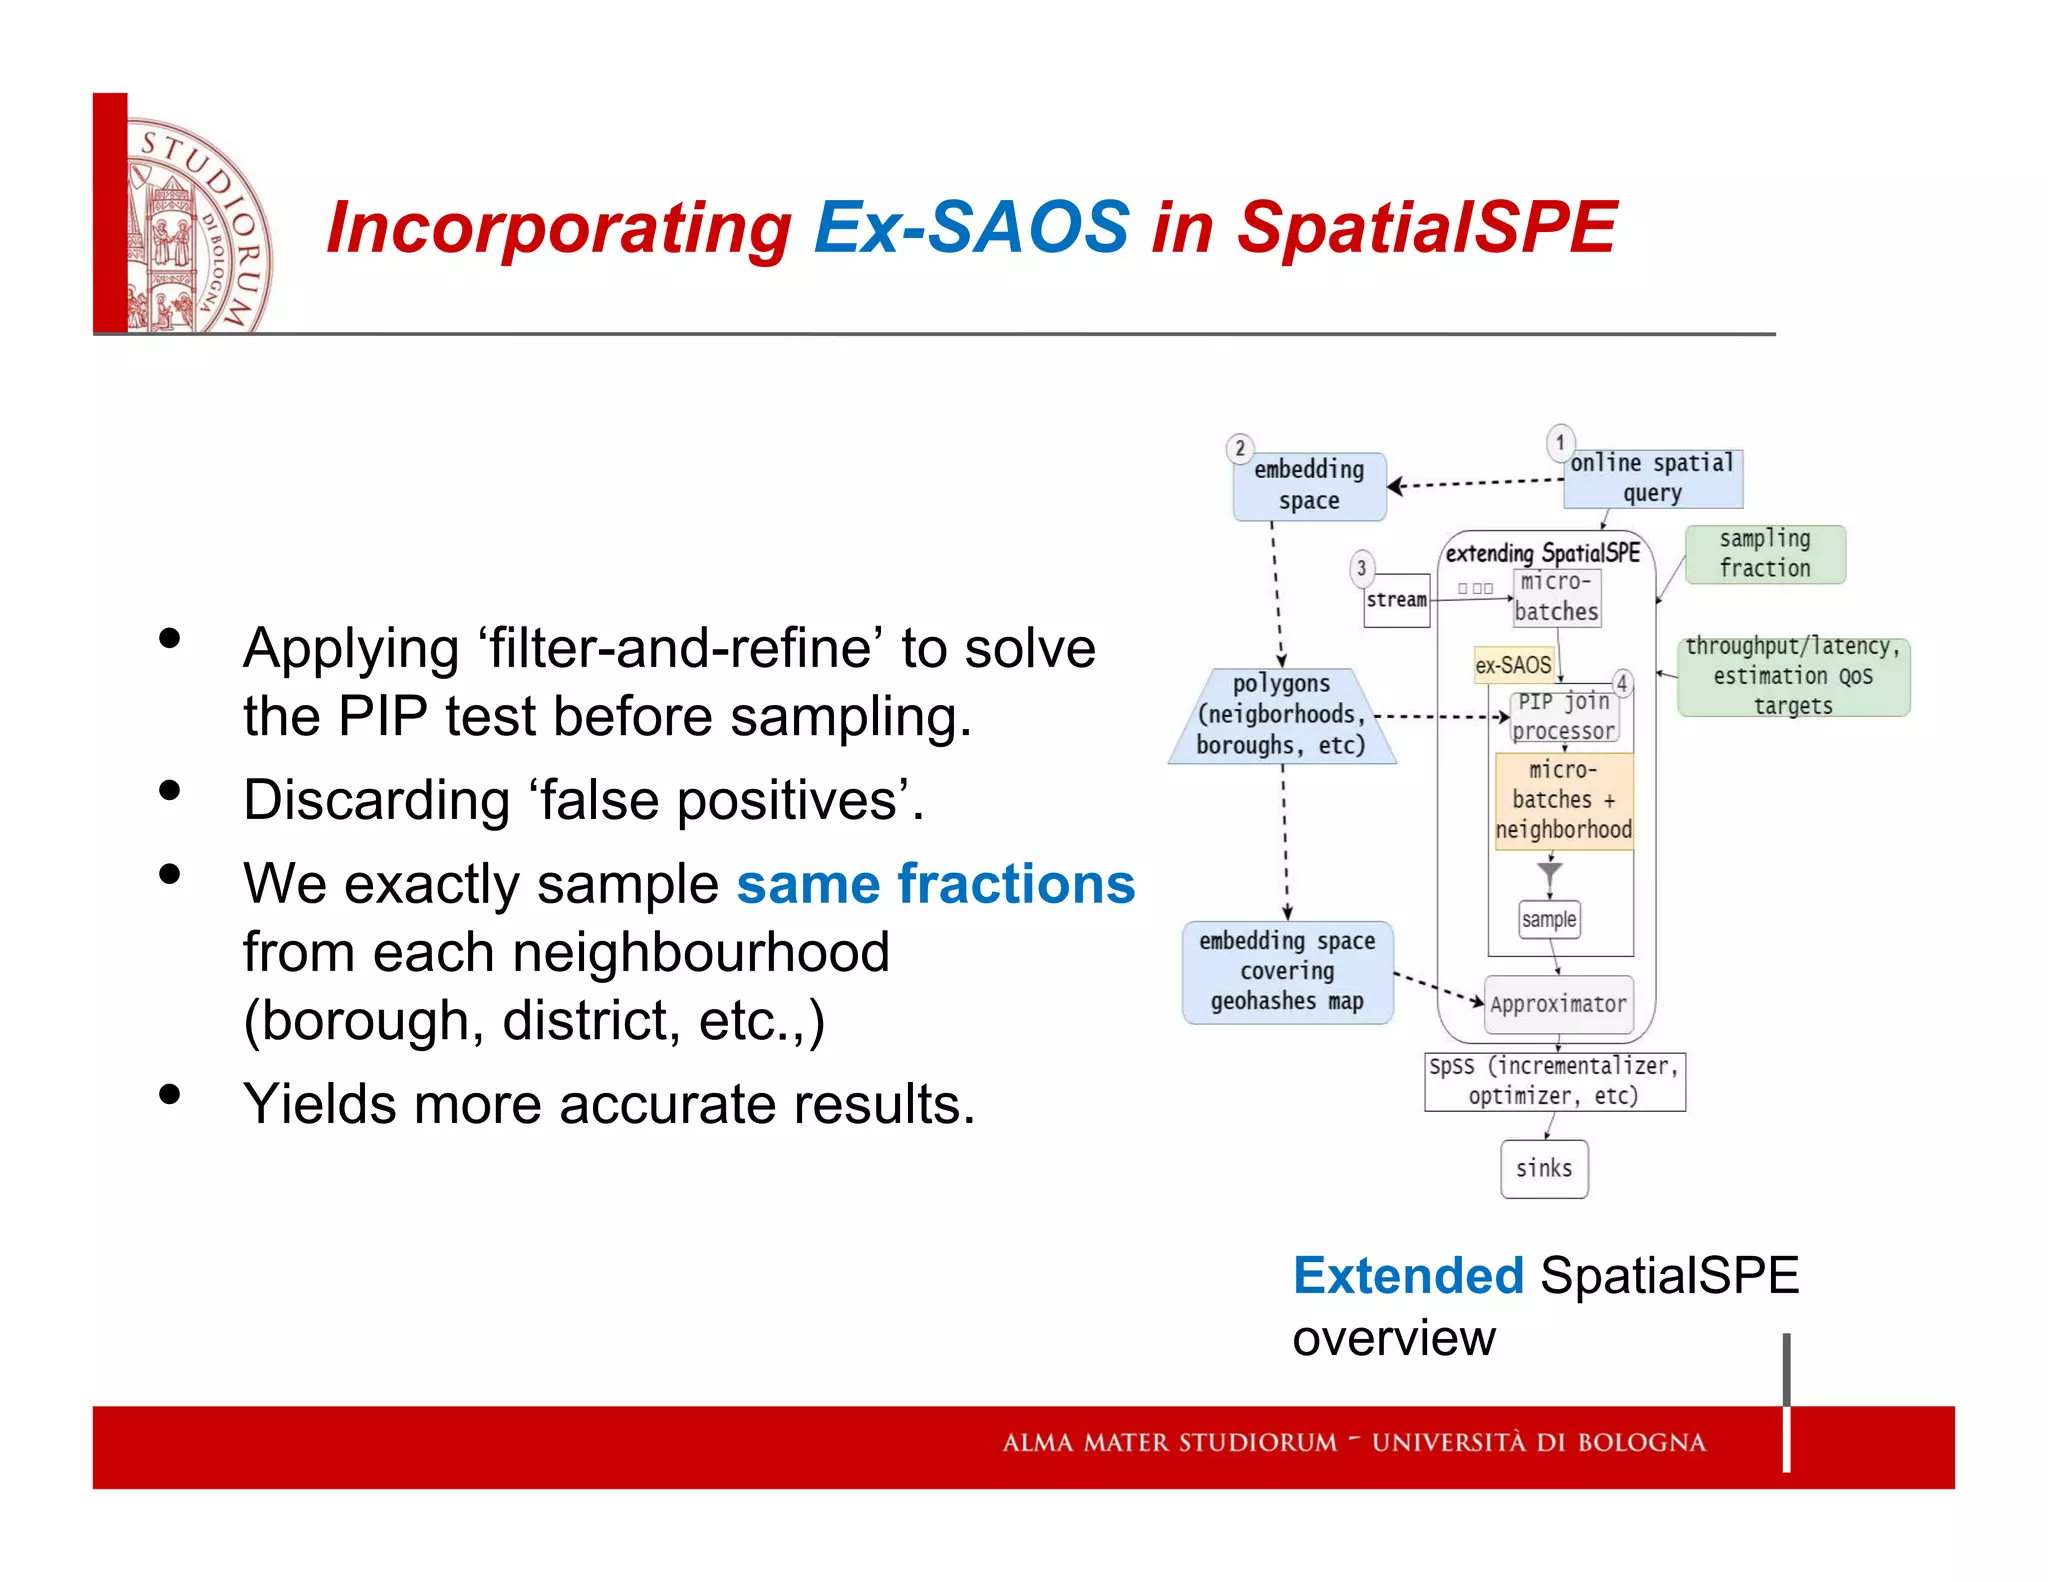
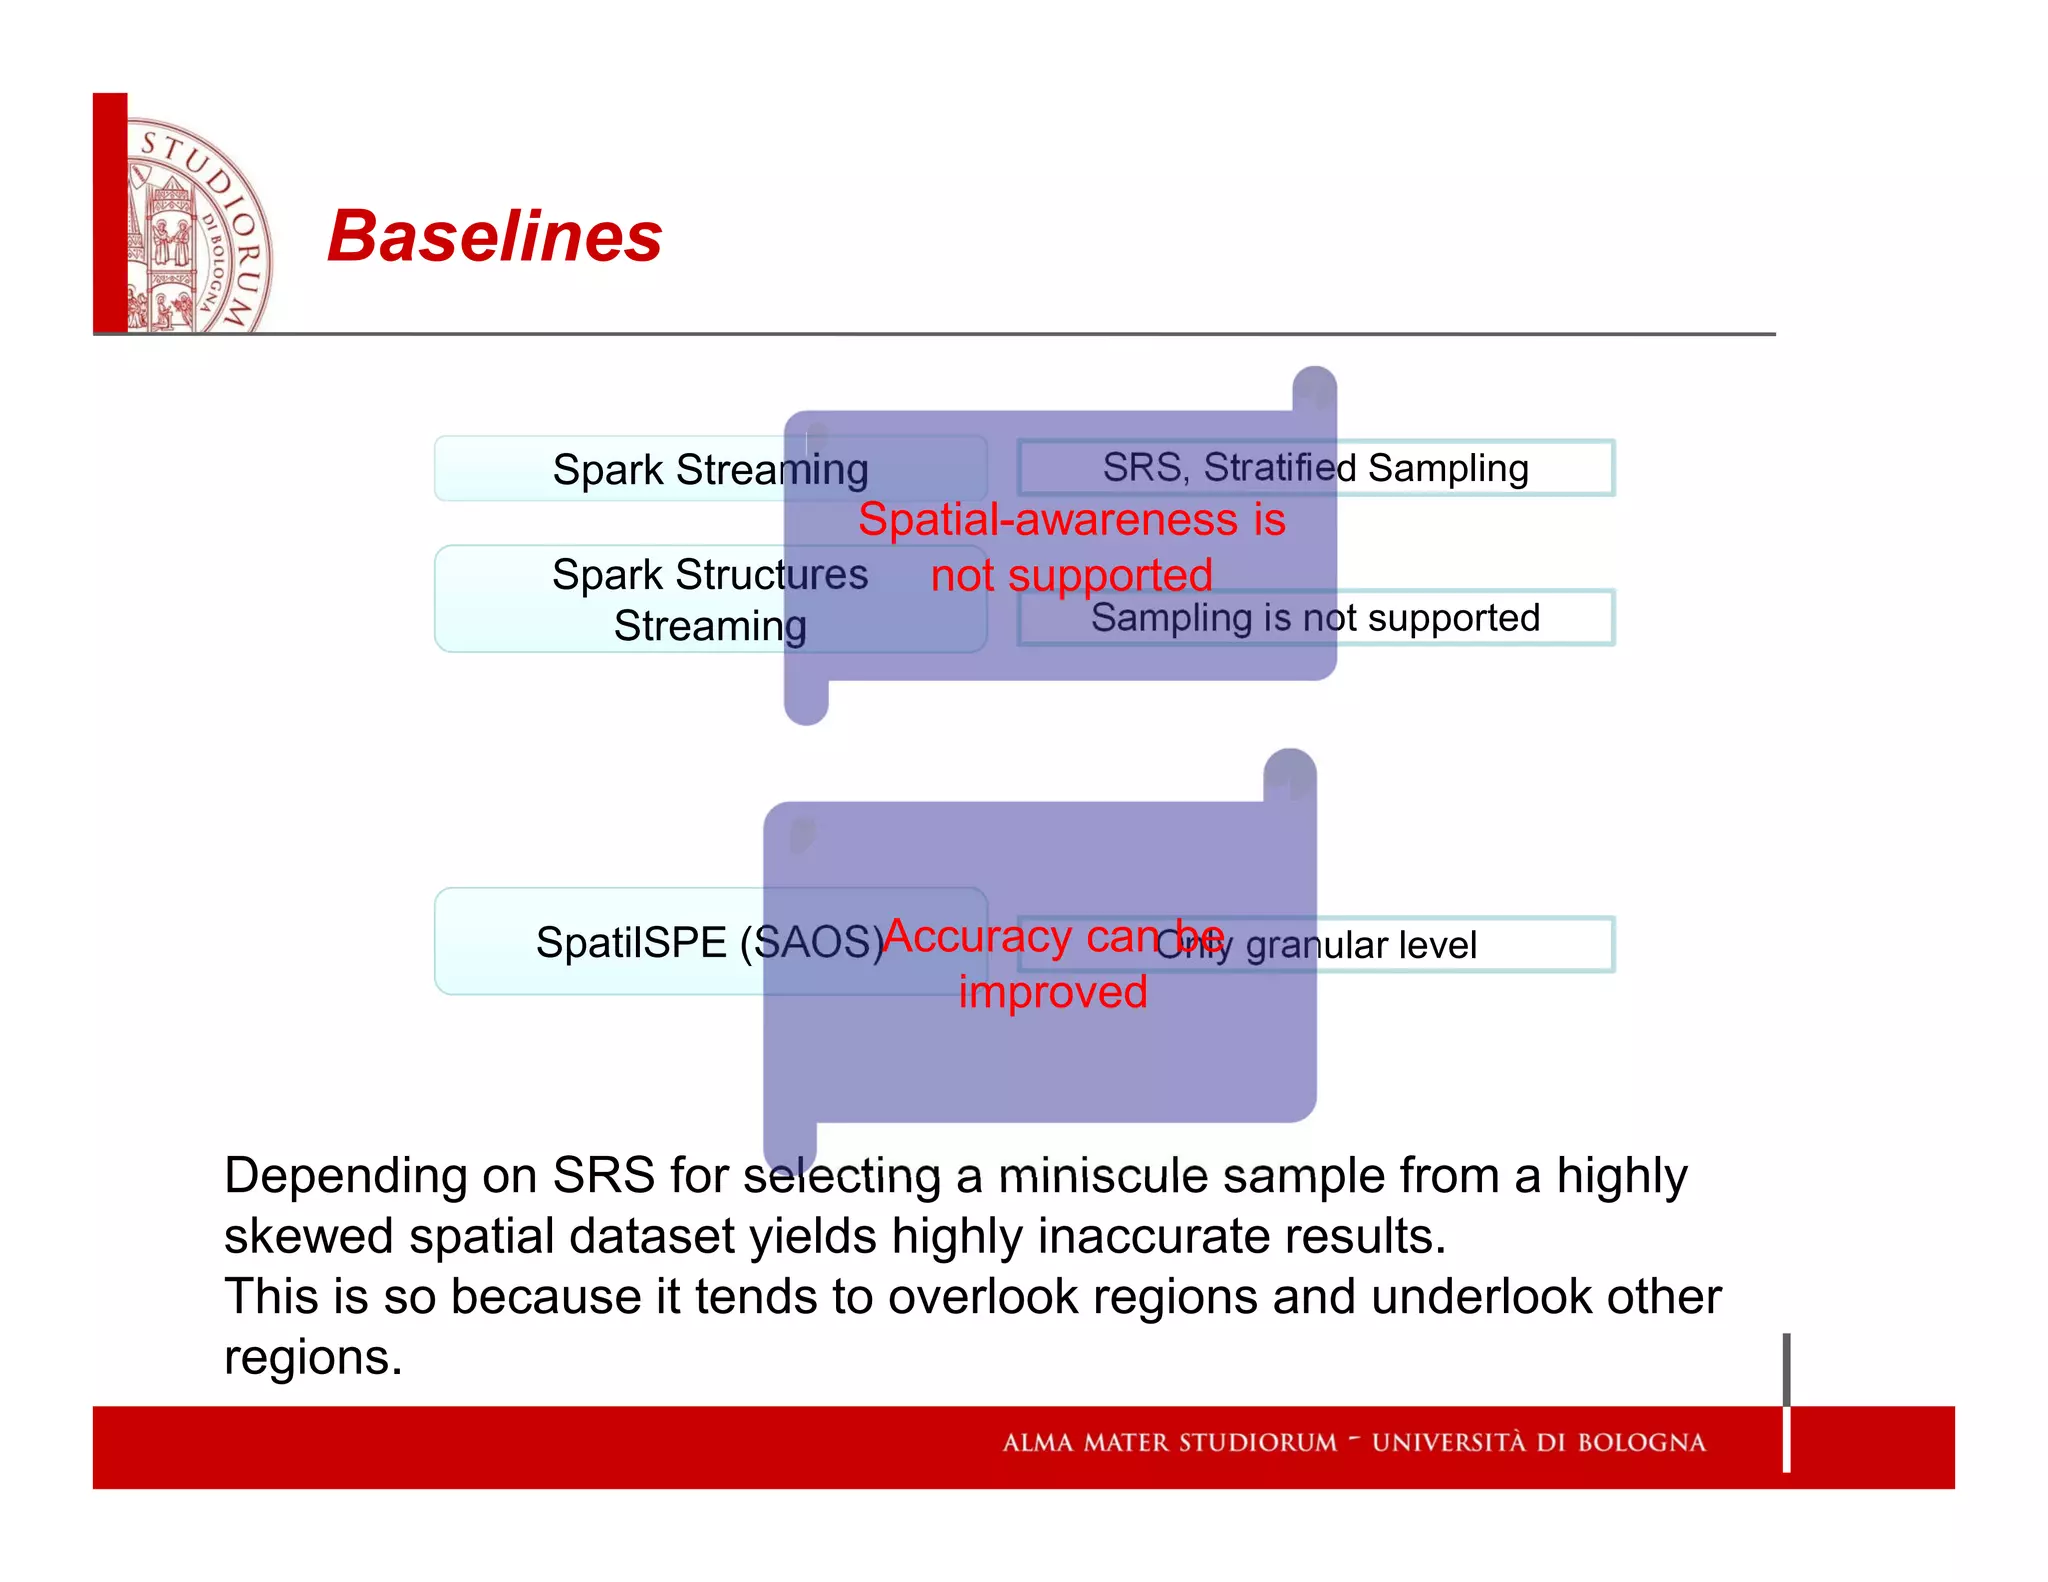
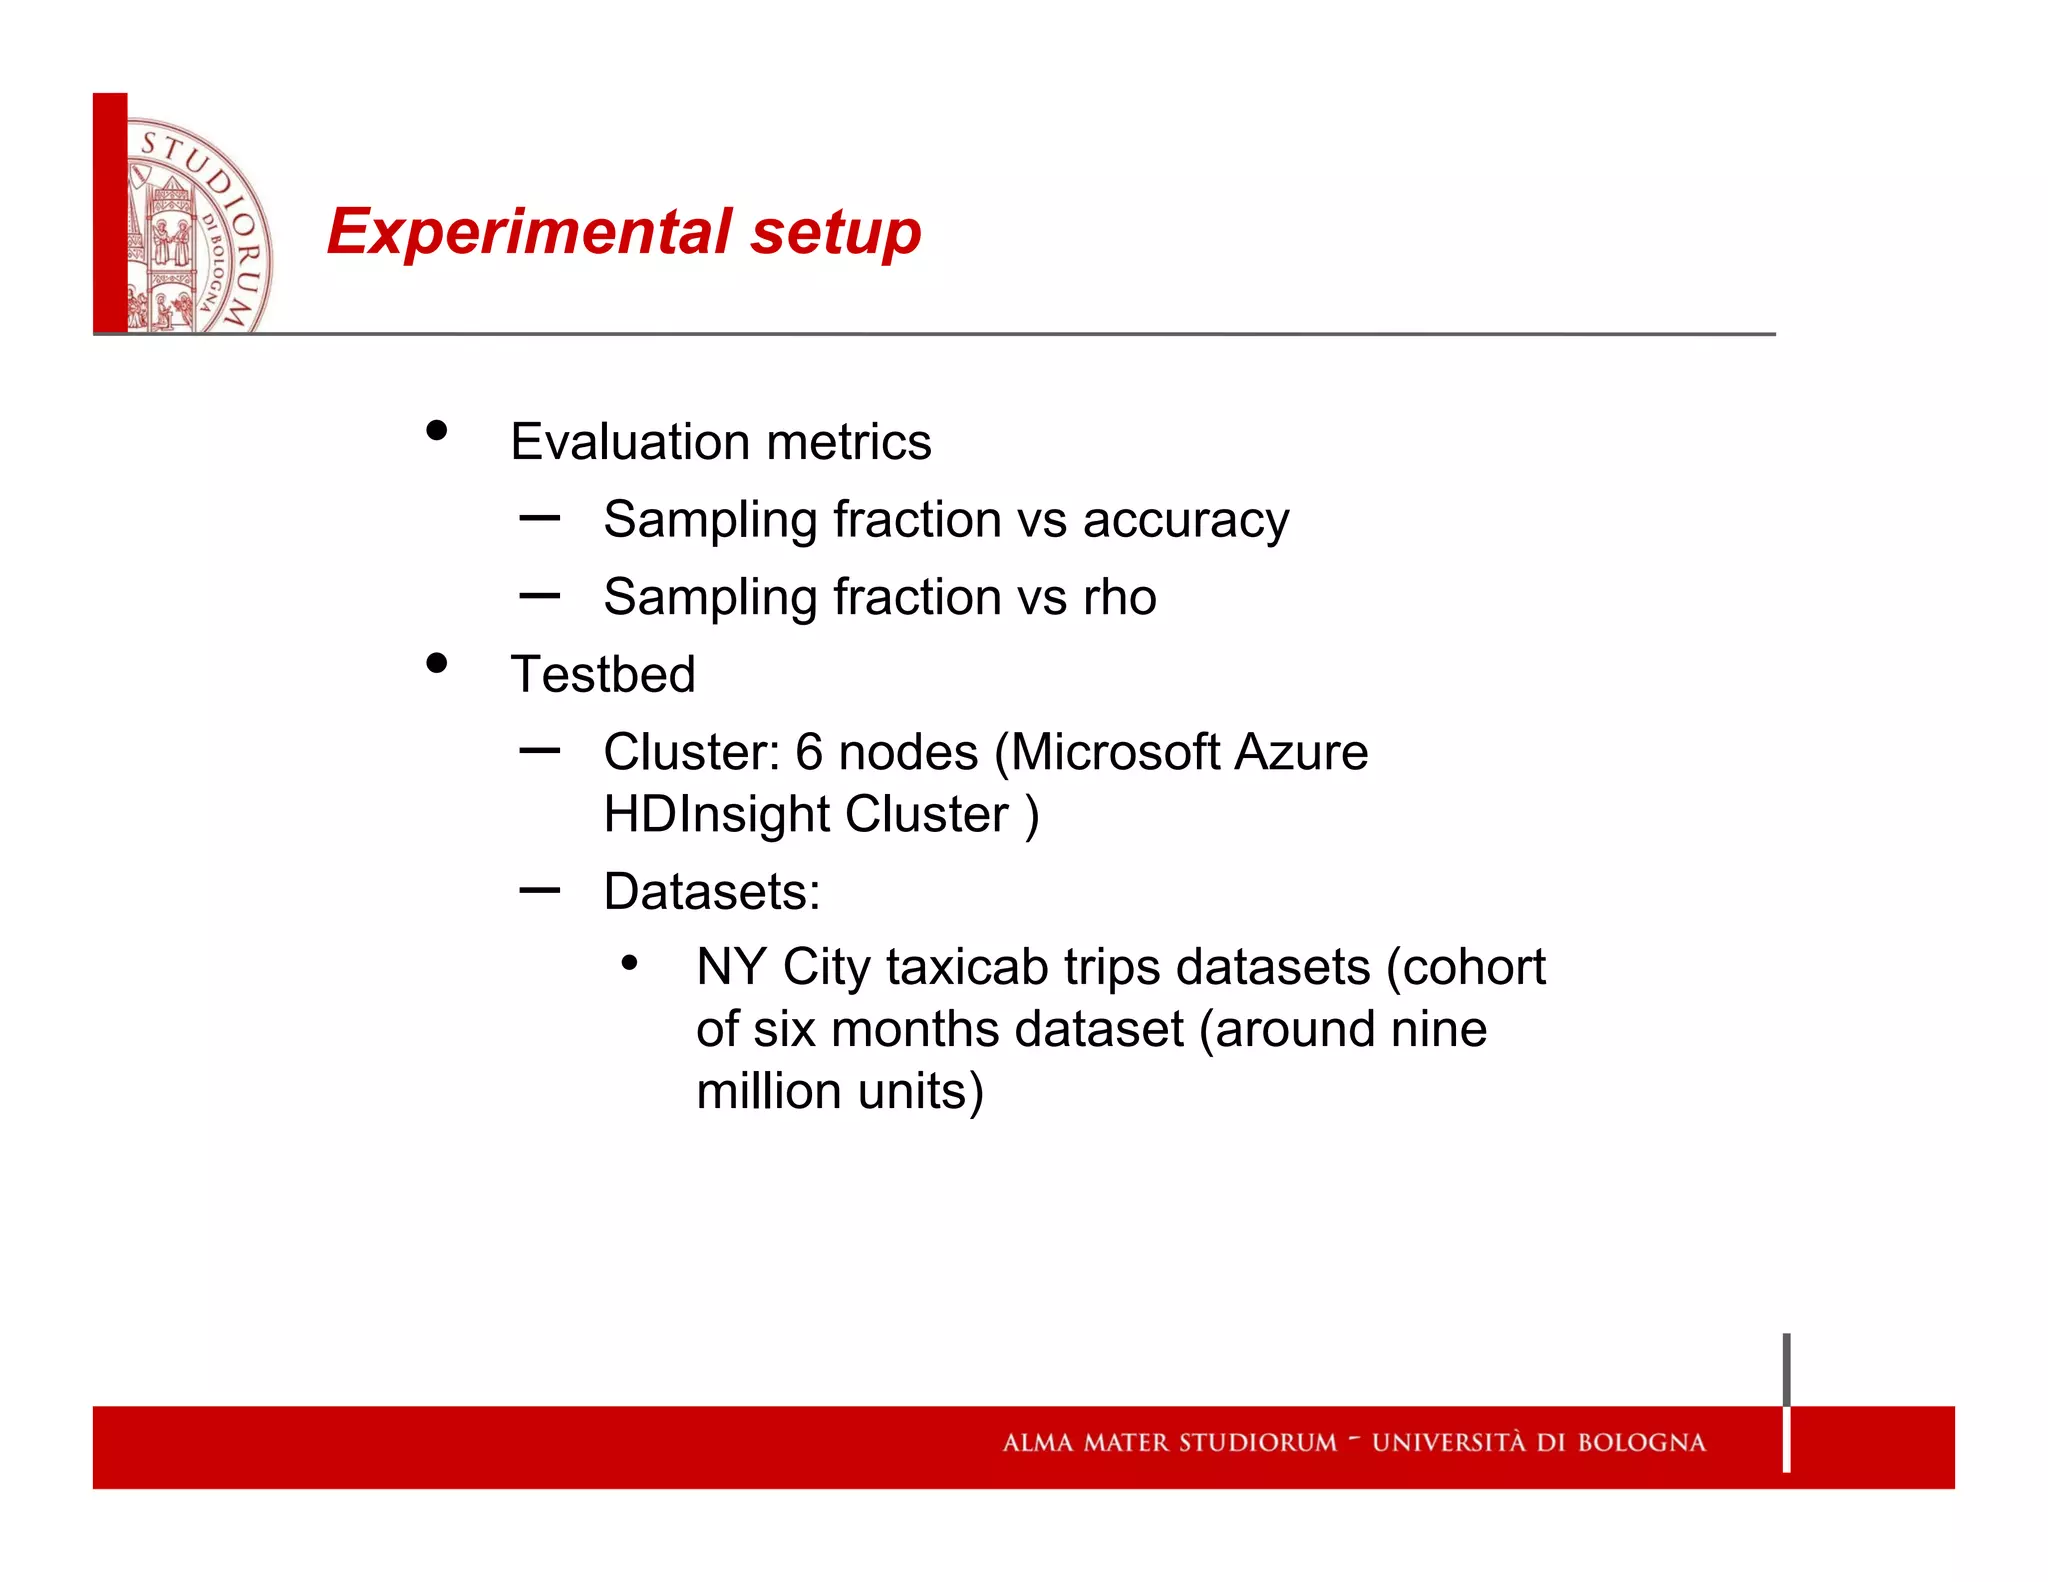
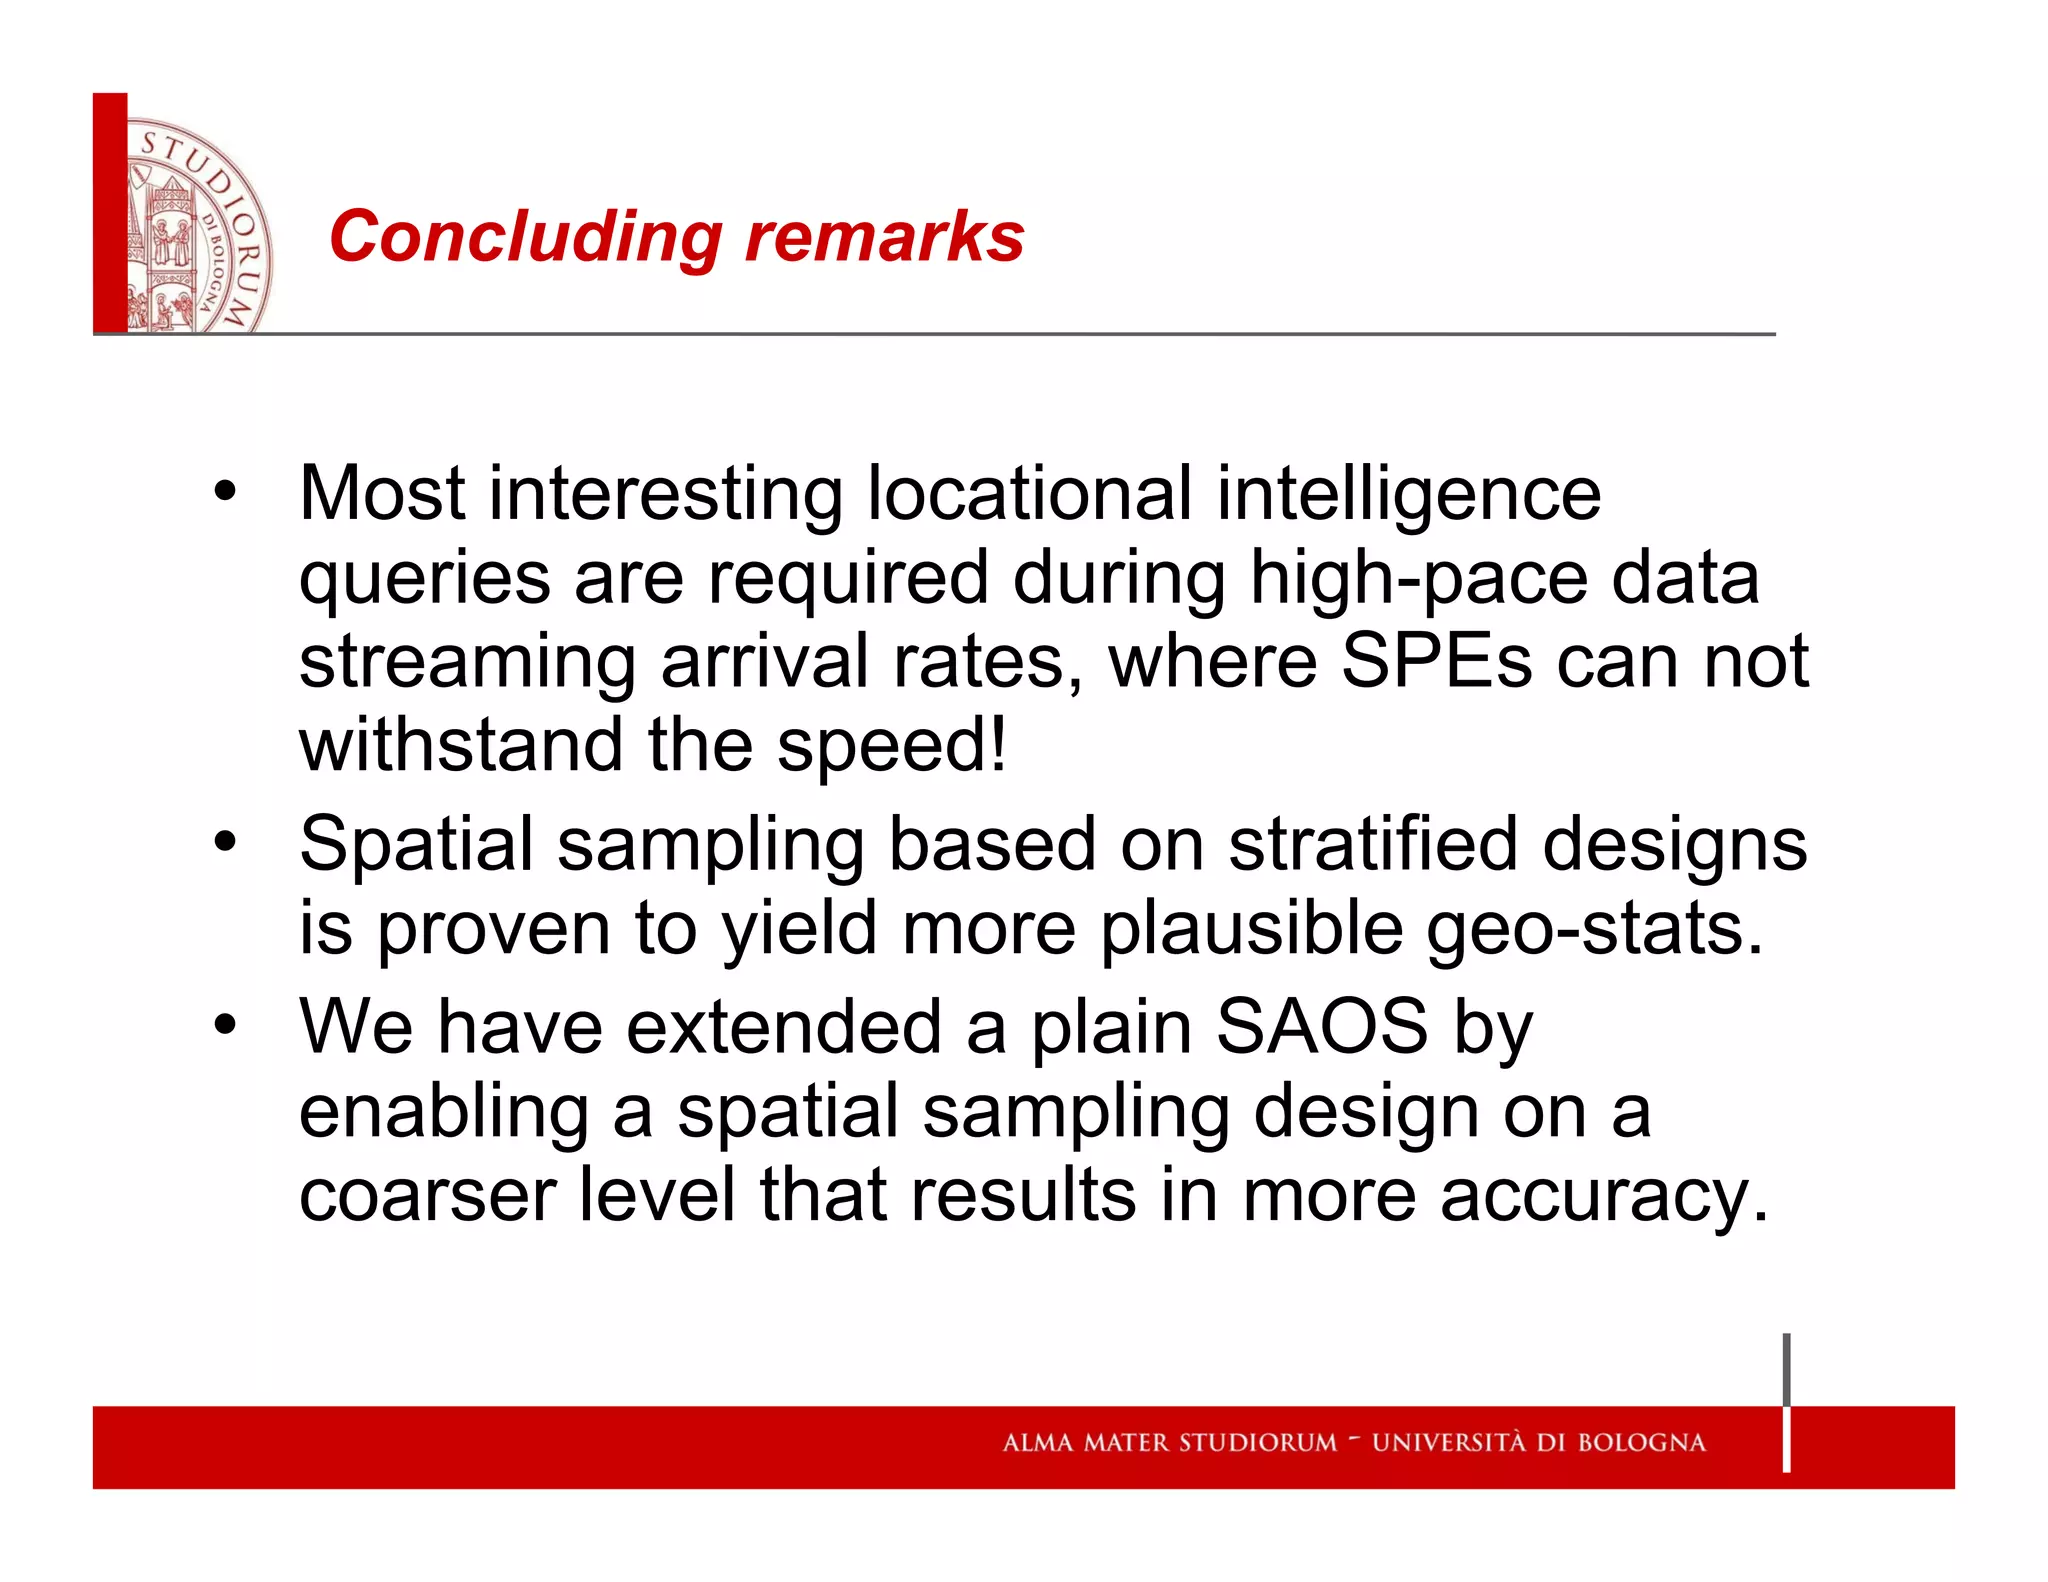
Department of Computer Science and Engineering - DISI
University of Bologna, Italy
{isam.aljawarneh3, luca.Foschini, paolo.bellavista,
antonio.corradi,Rebecca.montanari}@unibo.it,
Spatially Representative Online Big
Data Sampling for Smart Cities
Isam Mashhour Al Jawarneh, Luca Foschini ,
Paolo Bellavista, Antonio Corradi, Rebecca Montanari
IEEE CAMAD 2020
14-16 September Session 6 Next Generation Networks
Agenda
➢ Spatial Approximate Query Processing: Background and Motivations
➢ QoS-aware Spatial Sampling
○ Ex-SAOS spatial online sampling
○ Supported interactive spatial queries
➢ Ex-SAOS Deployment
○ Baselines
○ Testing setup
➢ Results and Discussion
○ Azure Cloud Spark Test
➢ Concluding remarks
Motivating Application Scenario: Smart
Cities
patient
Community
volunteers
A mixed-workload scenario requiring at least:
• Traffic Light Controller. Actuator decides to
change lights consistently for ambulance to
pass
• Smart Real-time Pathfinder. Interactive
navigation map for ambulances and other
vehicles
• Real-time Community Detector. Identify
volunteers' communities in the surroundings
of the patient
participatory healthcare
 geospatial queries (expensive!)
– Proximity queries
– Spatial join
– Spatial clustering
– Spatial geo-statistics.
– k-Nearest Neighborhoods
© 2020 Isam Al Jawarneh
 Data arrives fast during peak hours
 Exceeds the capacity of ingestion and processing
systems
● Spatial Approximate Query Processing (SAQP) is
the key.
QoS Tension for achieving SLAs
latency
Spatial (Approximate) Query Processing (S(A)QP)
Throughput
Accuracy
Tension
4
● Exactness is not necessary for
decision making in smart
cities!
 After 1 second, we obtain a
99.5 accurate early result,
which is satisfactory for
decision making, which then
makes the final exact result not
needed.
Spatial Approximate Query Processing
(SAQP)
• SAQP employs a spatial sampling
design aiming at resolving gracefully
the tension between low-latency and
high-accuracy QoS goals.
• Spatial sampling. Selecting a
miniscule version of the population
to compute geo-statistics: mean,
range, total.
– Based on the fact that decision
makers are can withstand a tiny
loss in error-bounded
accuracy in exchange for a
plausible latency gain.
– In streaming settings, data
keeps arriving, the ‘population’
metaphor vanishes.
Spatial Sampling
Spatial
sample
Incrementalizing
results w/ rigorous
Error bounds
Incrementalizing
results w/ rigorous
Error bounds
SAQP
Relying on samples for computing geo-
stats
Input
Stream
SLA:
Latency/throughput
QoS goals
Spatial Aware Online Sampling (SAOS):
overview
SAOS
%
Granular
• Nearby points share the same geohash prefixes
• Only the ‘filter’ stage of the ‘filter-and-refine’!
• SAOS focuses on SDL preservation, but with ‘false positives’
• ‘False positives’ are those tuples that have the same geohash, but do
not belong to the same neighborhood
• Geohash indexing. An ordering (string
representation) imposed on grid
surface earth planar representation.
• Nearby spatial objects share a pairwise
relationship
– spatially well-balanced
representative samples  are
known to yield better results for geo-
stats (average, median, etc.) in terms
of accuracy.
• Example online spatial query. “what is the
average trip distance travelled by taxis from
each neighbourhood in the city of Rome,
Italy”
• By sampling the same fraction from each
geohash, we approximately guarantee that
each neighborhood (stratum in statistics
parlance) is fairly represented
• Continuous results are updated by
incrementalization.
Plain SpatialSPE
SpatialSPE overview
• Geohash indexing. An ordering (string
representation) imposed on grid surface earth
planar representation.
Extended Spatial Aware Online Sampling
(SAOS): overview
Ex-SAOS
%
Coarser
• Applying all stages of ‘filter-and-refine’!
• Ex-SAOS focuses on SDL preservation, without ‘false positives’
• More accurate.
• Applying ‘filter-and-refine’ to solve
the PIP test before sampling.
• Discarding ‘false positives’.
• We exactly sample same fractions
from each neighbourhood
(borough, district, etc.,)
• Yields more accurate results.
Incorporating Ex-SAOS in SpatialSPE
Extended SpatialSPE
overview
Extended Spatial Aware Online Sampling
(EX-SAOS)
• Sampling proportionally
balanced tuples from each
administrative division
(neighborhood, district, borough,
etc.,) independently.
• ‘Filter-and-refine’ spatial join for
resolving the Point-in-Polygon
(PIP).
heuristic overview
Producing faster
than consuming
 Congestion!
Typical pipeline architecture w/o SAOS or Ex-
SAOS
Same
serving
speed, but
serving less
data!
The improved architecture w/ Ex-SAOS
SQL-alike
continuous
geospatial query
Supported Queries
“average trip distance
travelled by taxis in Rome,
Italy during the last three
months”
Online
continuous
query
Incremental
geo-stats
error bounds (e.g., relative error RE)
and spearman’s rho
̂
N
=
̂
N
=
( )
=
/ ( )
Single
queries
Stateful
aggregation
“top-3 boroughs in Bologna
city in Italy where people
tend to check out shared
bikes”.
Top-N online aggregation function
( , )
=
( , )
No pre-knowledge on the streaming geo-statistics is required, we
depends on incrementalization
Baselines
Spark Structures
Streaming Sampling is not supported
Spark Streaming SRS, Stratified Sampling
Depending on SRS for selecting a miniscule sample from a highly
skewed spatial dataset yields highly inaccurate results.
This is so because it tends to overlook regions and underlook other
regions.
SpatilSPE (SAOS) Only granular level
Spatial-awareness is
not supported
Accuracy can be
improved
Experimental setup
• Evaluation metrics
– Sampling fraction vs accuracy
– Sampling fraction vs rho
• Testbed
– Cluster: 6 nodes (Microsoft Azure
HDInsight Cluster )
– Datasets:
• NY City taxicab trips datasets (cohort
of six months dataset (around nine
million units)
Sampling fraction vs Accuracy
• We define the accuracy loss as accLoss = |estimatedMean – trueMean| / trueMean.
• ex-SAOS outperforms SpSS-based SRS in addition to SAOS for all geohash values
for all measures, accuracy loss and relative error.
• Ex-SAOS has lower accuracy loss compared to all geohash precisions applied to
SAOS (30 & 35)
0.00%
0.02%
0.04%
0.06%
0.08%
0.10%
0.12%
0.00%
0.10%
0.20%
0.30%
0.40%
0.50%
20% 40% 60% 80%
Accuracy
Loss
(lower
is
better)
Relative
Error(lower
is
better)
sampling fraction
95CI_SAOS_RE 95CI_ex-SAOS_RE
SAOS_loss ex-SAOS_loss
SAOS_loss35 SRS_loss
Spearman’s rho vs Sampling fraction
• rho is a measure for statistical dependency between the
ranking of two variables in a dataset.
• Ranking precision of ex-SAOS outperforms those for
SAOS( with all precisions 30 & 35) in addition to SRS.
0.75
0.8
0.85
0.9
0.95
1
1.05
0.8
0.85
0.9
0.95
1
1.05
20% 40% 60% 80%
rho
35
(higher
better)
rho
30
(higher
better)
sampling rate
SAOS_30 SRS ex-SAOS SAOS_35
Concluding remarks
• Most interesting locational intelligence
queries are required during high-pace data
streaming arrival rates, where SPEs can not
withstand the speed!
• Spatial sampling based on stratified designs
is proven to yield more plausible geo-stats.
• We have extended a plain SAOS by
enabling a spatial sampling design on a
coarser level that results in more accuracy.
Q&A and Contacts
Isam Al Jawarneh
Email: isam.aljawarneh3@unibo.it
Luca Foschini
Email: luca.foschini@unibo.it
Thanks for your attention!
Questions time...
IEEE CAMAD 2020
14-16 September

IEEE Camad20 presentation - Isam Al Jawarneh

  • 1.
    Department of ComputerScience and Engineering - DISI University of Bologna, Italy {isam.aljawarneh3, luca.Foschini, paolo.bellavista, antonio.corradi,Rebecca.montanari}@unibo.it, Spatially Representative Online Big Data Sampling for Smart Cities Isam Mashhour Al Jawarneh, Luca Foschini , Paolo Bellavista, Antonio Corradi, Rebecca Montanari IEEE CAMAD 2020 14-16 September Session 6 Next Generation Networks
  • 2.
    Agenda ➢ Spatial ApproximateQuery Processing: Background and Motivations ➢ QoS-aware Spatial Sampling ○ Ex-SAOS spatial online sampling ○ Supported interactive spatial queries ➢ Ex-SAOS Deployment ○ Baselines ○ Testing setup ➢ Results and Discussion ○ Azure Cloud Spark Test ➢ Concluding remarks
  • 3.
    Motivating Application Scenario:Smart Cities patient Community volunteers A mixed-workload scenario requiring at least: • Traffic Light Controller. Actuator decides to change lights consistently for ambulance to pass • Smart Real-time Pathfinder. Interactive navigation map for ambulances and other vehicles • Real-time Community Detector. Identify volunteers' communities in the surroundings of the patient participatory healthcare  geospatial queries (expensive!) – Proximity queries – Spatial join – Spatial clustering – Spatial geo-statistics. – k-Nearest Neighborhoods © 2020 Isam Al Jawarneh  Data arrives fast during peak hours  Exceeds the capacity of ingestion and processing systems ● Spatial Approximate Query Processing (SAQP) is the key.
  • 4.
    QoS Tension forachieving SLAs latency Spatial (Approximate) Query Processing (S(A)QP) Throughput Accuracy Tension 4
  • 5.
    ● Exactness isnot necessary for decision making in smart cities!  After 1 second, we obtain a 99.5 accurate early result, which is satisfactory for decision making, which then makes the final exact result not needed. Spatial Approximate Query Processing (SAQP)
  • 6.
    • SAQP employsa spatial sampling design aiming at resolving gracefully the tension between low-latency and high-accuracy QoS goals. • Spatial sampling. Selecting a miniscule version of the population to compute geo-statistics: mean, range, total. – Based on the fact that decision makers are can withstand a tiny loss in error-bounded accuracy in exchange for a plausible latency gain. – In streaming settings, data keeps arriving, the ‘population’ metaphor vanishes. Spatial Sampling Spatial sample Incrementalizing results w/ rigorous Error bounds Incrementalizing results w/ rigorous Error bounds SAQP Relying on samples for computing geo- stats Input Stream SLA: Latency/throughput QoS goals
  • 7.
    Spatial Aware OnlineSampling (SAOS): overview SAOS % Granular • Nearby points share the same geohash prefixes • Only the ‘filter’ stage of the ‘filter-and-refine’! • SAOS focuses on SDL preservation, but with ‘false positives’ • ‘False positives’ are those tuples that have the same geohash, but do not belong to the same neighborhood • Geohash indexing. An ordering (string representation) imposed on grid surface earth planar representation.
  • 8.
    • Nearby spatialobjects share a pairwise relationship – spatially well-balanced representative samples  are known to yield better results for geo- stats (average, median, etc.) in terms of accuracy. • Example online spatial query. “what is the average trip distance travelled by taxis from each neighbourhood in the city of Rome, Italy” • By sampling the same fraction from each geohash, we approximately guarantee that each neighborhood (stratum in statistics parlance) is fairly represented • Continuous results are updated by incrementalization. Plain SpatialSPE SpatialSPE overview • Geohash indexing. An ordering (string representation) imposed on grid surface earth planar representation.
  • 9.
    Extended Spatial AwareOnline Sampling (SAOS): overview Ex-SAOS % Coarser • Applying all stages of ‘filter-and-refine’! • Ex-SAOS focuses on SDL preservation, without ‘false positives’ • More accurate.
  • 10.
    • Applying ‘filter-and-refine’to solve the PIP test before sampling. • Discarding ‘false positives’. • We exactly sample same fractions from each neighbourhood (borough, district, etc.,) • Yields more accurate results. Incorporating Ex-SAOS in SpatialSPE Extended SpatialSPE overview
  • 11.
    Extended Spatial AwareOnline Sampling (EX-SAOS) • Sampling proportionally balanced tuples from each administrative division (neighborhood, district, borough, etc.,) independently. • ‘Filter-and-refine’ spatial join for resolving the Point-in-Polygon (PIP). heuristic overview
  • 12.
    Producing faster than consuming Congestion! Typical pipeline architecture w/o SAOS or Ex- SAOS
  • 13.
    Same serving speed, but serving less data! Theimproved architecture w/ Ex-SAOS SQL-alike continuous geospatial query
  • 14.
    Supported Queries “average tripdistance travelled by taxis in Rome, Italy during the last three months” Online continuous query Incremental geo-stats error bounds (e.g., relative error RE) and spearman’s rho ̂ N = ̂ N = ( ) = / ( ) Single queries Stateful aggregation “top-3 boroughs in Bologna city in Italy where people tend to check out shared bikes”. Top-N online aggregation function ( , ) = ( , ) No pre-knowledge on the streaming geo-statistics is required, we depends on incrementalization
  • 15.
    Baselines Spark Structures Streaming Samplingis not supported Spark Streaming SRS, Stratified Sampling Depending on SRS for selecting a miniscule sample from a highly skewed spatial dataset yields highly inaccurate results. This is so because it tends to overlook regions and underlook other regions. SpatilSPE (SAOS) Only granular level Spatial-awareness is not supported Accuracy can be improved
  • 16.
    Experimental setup • Evaluationmetrics – Sampling fraction vs accuracy – Sampling fraction vs rho • Testbed – Cluster: 6 nodes (Microsoft Azure HDInsight Cluster ) – Datasets: • NY City taxicab trips datasets (cohort of six months dataset (around nine million units)
  • 17.
    Sampling fraction vsAccuracy • We define the accuracy loss as accLoss = |estimatedMean – trueMean| / trueMean. • ex-SAOS outperforms SpSS-based SRS in addition to SAOS for all geohash values for all measures, accuracy loss and relative error. • Ex-SAOS has lower accuracy loss compared to all geohash precisions applied to SAOS (30 & 35) 0.00% 0.02% 0.04% 0.06% 0.08% 0.10% 0.12% 0.00% 0.10% 0.20% 0.30% 0.40% 0.50% 20% 40% 60% 80% Accuracy Loss (lower is better) Relative Error(lower is better) sampling fraction 95CI_SAOS_RE 95CI_ex-SAOS_RE SAOS_loss ex-SAOS_loss SAOS_loss35 SRS_loss
  • 18.
    Spearman’s rho vsSampling fraction • rho is a measure for statistical dependency between the ranking of two variables in a dataset. • Ranking precision of ex-SAOS outperforms those for SAOS( with all precisions 30 & 35) in addition to SRS. 0.75 0.8 0.85 0.9 0.95 1 1.05 0.8 0.85 0.9 0.95 1 1.05 20% 40% 60% 80% rho 35 (higher better) rho 30 (higher better) sampling rate SAOS_30 SRS ex-SAOS SAOS_35
  • 19.
    Concluding remarks • Mostinteresting locational intelligence queries are required during high-pace data streaming arrival rates, where SPEs can not withstand the speed! • Spatial sampling based on stratified designs is proven to yield more plausible geo-stats. • We have extended a plain SAOS by enabling a spatial sampling design on a coarser level that results in more accuracy.
  • 20.
    Q&A and Contacts IsamAl Jawarneh Email: isam.aljawarneh3@unibo.it Luca Foschini Email: luca.foschini@unibo.it Thanks for your attention! Questions time... IEEE CAMAD 2020 14-16 September