Download to read offline


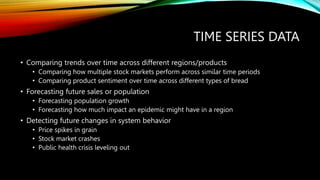
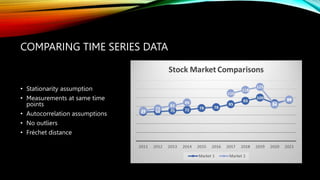


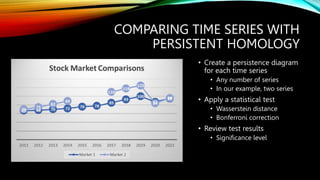


The document discusses the application of topological data analysis to time series data, emphasizing the importance of comparing trends and forecasting across various domains such as stock markets and public health. It details concepts such as stationarity, autocorrelation, and persistent homology, which help in understanding the underlying structures of time series data. The use of statistical tests and R code for analyzing datasets, particularly from stock exchanges, is also covered.