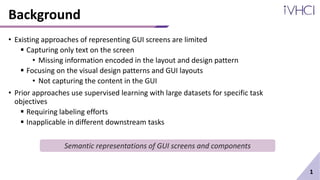
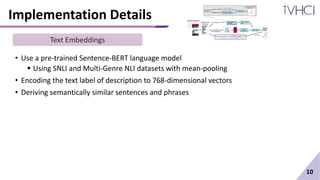
Screen2Vec: Semantic Embedding of GUI
Screens and GUI Components
Toby Li, Lindsay Popowski, Tom M Mitchell, Brad A. Myers
2021 CHI Conference on Human Factors in Computing Systems
Background
• Existing approaches of representing GUI screens are limited
 Capturing only text on the screen
• Missing information encoded in the layout and design pattern
 Focusing on the visual design patterns and GUI layouts
• Not capturing the content in the GUI
• Prior approaches use supervised learning with large datasets for specific task
objectives
 Requiring labeling efforts
 Inapplicable in different downstream tasks
1
Semantic representations of GUI screens and components
Contribution
• Presenting a self-supervised technique, not requiring human-labeled data
• Generating more comprehensive semantic embeddings of GUI screens and
components using
 Textual content
 Visual design
 Layout patterns
 App meta-data
• Training an open-sourced GUI embedding model using Screen2Vec with RICO
dataset
• Providing sample downstream tasks such as
 Nearest neighbor retrieval
 Composability-based retrieval
 Representing mobile tasks
2
Architecture of Screen2Vec
3
GUI Component level
GUI Screen Level
• Two-level architecture
Architecture of Screen2Vec
• Input
 768-dimensional embedding vector of the text label of the GUI component
• Encoded using a pre-trained Sentence-BERT
 6-dimensional class embedding vector
• Representing the class type of the GUI component
• Optimizing weights in the class embeddings and weights in the linear layer (text + class)
• Output
 768-dimensional embedding vector
4
GUI Component Level
Architecture of Screen2Vec
1) Collection of GUI component embedding vector
 Combined into a 768-dimensional vector using RNN
2) 64-dimensional layout embedding vector
 Encoding the screen’s visual layout
3) 768-dimensional embedding vector of the textual App Store description
 Encoded with a pre-trained Sentence-BERT model
• GUI(1) and layout(2) vectors are combined using a linear layer  768-dimensional
embedding vector
• After training, description(3) vector is concatenated  1536-dimensional embedding
vector
• Weights of RNN and weights of the linear layer trained on a Continuous Bag of Word
prediction 5
GUI Screen Level
Dataset
• RICO Dataset
 Containing interaction traces on 66,261 unique GUI screens
 From 9,384 free Android apps
• Specifics
 Each dataset with a screenshot image
 Screen’s “view hierarchy” (e.g., DOM tree in HTML) in a JSON file
• Each node including
• Class type
• Textual content
• Location as the bounding box on the screen
• Properties such as whether it is clickable, focused, or scrollable
 Each interaction trace represented as a sequence of GUI screens
• Which location is clicked or swiped
6
Implementation Details
• Encoding 26 class categories into a vector space
• Mapping each of the categories into a continuous 6-dimensional vector
• Optimizing embedding vector value by training GUI component prediction task
 Categories semantically similar, close in the vector space
7
GUI Class Type Embeddings
Implementation Details
• Defining the context of a component as its 16 nearest components
• Measures of screen distance for determining the context
 Euclidean : straight-line minimal distance on the screen
• In pixel
 Hierarchical : distance between 2 GUI components on the hierarchical view tree
• Parent and children : 1
8
GUI Component Context
Implementation Details
• Combining multiple vectors into a lower-dimension vector
• GUI component level
 Concatenating 768-dimension with 6-dimension
 Shrinking down to 768-dimension
 Creating 774 x 768 weights
• GUI screen level
 Combining 768-dimension and 64-dimension
 Producing 768-dimension for screen content and layout
9
Linear Layer
Implementation Details
• Use a pre-trained Sentence-BERT language model
 Using SNLI and Multi-Genre NLI datasets with mean-pooling
• Encoding the text label of description to 768-dimensional vectors
• Deriving semantically similar sentences and phrases
10
Text Embeddings
Implementation Details
• Extracting the layout from a screenshot
• Differentiating between text and non-text GUI components
• Using autoencoder to encode each image into 64-dimensional embedding vector
• Encoder’s input dimension : 11,200
• Two hidden layers of 2,048 and 256
• Applying RLU to eliminate negative input
• Loss determined by MSE
11
Layout Embeddings
Implementation Details
• Combining embedding vectors of multiple GUI components
• GUI components embeddings fed into the RNN
 In the pre-order traversal order of hierarchy tree
• Starting with hidden state of zero, fed into a linear layer with 𝑛 − 1 𝑡ℎ output
12
GUI Embedding Combining Layer
Training Configuration
• Training: 90% of the data; validation: 10%
• Cross entropy loss function with Adam optimizer
• Learning rate: 0.001; batch size: 256
• GUI component model: 120 epochs; GUI screen model: 80-120 epochs
• Total loss
 Component
• Total Loss = Loss(text prediction) + Loss(class type prediction)
 Screen
• Negative sampling
• Prediction compared to the correct screen and a sample of negative data
• Random sampling of other screens with size 128 on the same app
• To differentiate different screens on the same app
13
Baselines
• Text Embedding Only (similar textual context)
 Screen embedding method used in SOVITE
 Computed by averaging the text embedding vectors for all the text in the screen
• Layout Embedding Only (similar layout)
 Screen embedding method used in the original RICO paper
 Computed by the layout autoencoder to represent the screen
• Visual Embedding Only (similar visual)
 Direct screen shot of image instead of layout
 Inspired by VASTA, Sikuli, and HILC
14
Results
• Predicting each GUI screen in all the GUI interaction traces in the RICO dataset using its
context
 3 versions to compare
• EUCLIDEAN with locations of GUI components and the screen layouts
• HIERARCHICAL with above spatial info
• EUCLIDEAN without spatial info
15
Sample Downstream Tasks
• The main purpose is to produce distributed vector representations that encode useful
semantic, layout, design properties
• Compare similarity between the nearest neighbor results by different models
Methods
• Select 50 screens from apps and app domains
• Retrieve top-5 most similar screens using each of 3 models
• 79 Mechanical Turk workers participated
• Each worker saw top-5 most similar screens of 5 source screens produced by 3 models
• Questionnaires include followings
 (1) App similarity (2) Screen type similarity (3) Content similarity
16
Nearest Neighbors
Sample Downstream Tasks
Results
• The differences between the mean ratings of the Screen2Vec model and both TextOnly
and LayoutOnly model are significant (non-parametric Mann-Whitney U test)
• Retrieve top-5 most similar screens using each of 3 models
17
Nearest Neighbors
Sample Downstream Tasks
Observation
• Screen2Vec generate more comprehensive
representations
 “Request ride” in Lyft
• “Get direction” in Uber Driver
• “Select navigation type” in Waze app
• “Request ride” in Free Now
 MapView taking majority
 All feature a menu/information card at the
bottom 1/3 – 1/4
• TextOnly generated results are semantically
similar to “payment”
• LayoutOnly generated results show lower score
in the content and app-context similarity
18
Nearest Neighbors
Sample Downstream Tasks
Word2Vec
• “Man is to woman as brother is to sister”
• (brother - man + woman) results in an
embedding vector representing sister
Screen2Vec
• Marriott app ’s “hotel booking” screen +
(Cheapoair app’s “search result” screen
− Cheapoair app’s “hotel booking”
screen))
• The top result is the “search result”
screen in the Marriott app
19
Embedding Composability
Sample Downstream Tasks
• Preliminary evaluation on the effectiveness of embedding mobile tasks as
sequences of Screen2Vec screen embedding vectors
• Recording scripts of completing 10 common smartphone tasks
• Representing each task as the average of Screen2Vec vectors
• Querying for the nearest neighbor within 20 task variations and get 18/20
accuracy
 TextOnly : 14/20 accuracy
20
Screen Embedding Sequences for Representing Mobile Tasks
Potential Application
• Designers query for example designs that display similar content or screens in
apps of a similar domain
• Composability helps to find a specific page for the app
 Suppose a designer searches for checkout page for app A
 A’s order page + (App B’s checkout page – App B’s order page
• LayoutGAN can generate realistic GUI layouts based on user-specified
constraints
 Applying Screen2Vec to incorporate the semantics of GUIs and the context
of user interaction
21
Limitation
• Only trained and test on Android app GUIs
• RICO dataset
 contains interaction traces within single apps  need to generalize multiple app
 Does not contain paid apps
• Screen2Vec does not encode the semantics of graphic icons that have no textual
information
22
Screen2Vec: Semantic Embedding of GUI Screens and GUI Components

Screen2Vec: Semantic Embedding of GUI Screens and GUI Components

  • 1.
    Screen2Vec: Semantic Embeddingof GUI Screens and GUI Components Toby Li, Lindsay Popowski, Tom M Mitchell, Brad A. Myers 2021 CHI Conference on Human Factors in Computing Systems
  • 2.
    Background • Existing approachesof representing GUI screens are limited  Capturing only text on the screen • Missing information encoded in the layout and design pattern  Focusing on the visual design patterns and GUI layouts • Not capturing the content in the GUI • Prior approaches use supervised learning with large datasets for specific task objectives  Requiring labeling efforts  Inapplicable in different downstream tasks 1 Semantic representations of GUI screens and components
  • 3.
    Contribution • Presenting aself-supervised technique, not requiring human-labeled data • Generating more comprehensive semantic embeddings of GUI screens and components using  Textual content  Visual design  Layout patterns  App meta-data • Training an open-sourced GUI embedding model using Screen2Vec with RICO dataset • Providing sample downstream tasks such as  Nearest neighbor retrieval  Composability-based retrieval  Representing mobile tasks 2
  • 4.
    Architecture of Screen2Vec 3 GUIComponent level GUI Screen Level • Two-level architecture
  • 5.
    Architecture of Screen2Vec •Input  768-dimensional embedding vector of the text label of the GUI component • Encoded using a pre-trained Sentence-BERT  6-dimensional class embedding vector • Representing the class type of the GUI component • Optimizing weights in the class embeddings and weights in the linear layer (text + class) • Output  768-dimensional embedding vector 4 GUI Component Level
  • 6.
    Architecture of Screen2Vec 1)Collection of GUI component embedding vector  Combined into a 768-dimensional vector using RNN 2) 64-dimensional layout embedding vector  Encoding the screen’s visual layout 3) 768-dimensional embedding vector of the textual App Store description  Encoded with a pre-trained Sentence-BERT model • GUI(1) and layout(2) vectors are combined using a linear layer  768-dimensional embedding vector • After training, description(3) vector is concatenated  1536-dimensional embedding vector • Weights of RNN and weights of the linear layer trained on a Continuous Bag of Word prediction 5 GUI Screen Level
  • 7.
    Dataset • RICO Dataset Containing interaction traces on 66,261 unique GUI screens  From 9,384 free Android apps • Specifics  Each dataset with a screenshot image  Screen’s “view hierarchy” (e.g., DOM tree in HTML) in a JSON file • Each node including • Class type • Textual content • Location as the bounding box on the screen • Properties such as whether it is clickable, focused, or scrollable  Each interaction trace represented as a sequence of GUI screens • Which location is clicked or swiped 6
  • 8.
    Implementation Details • Encoding26 class categories into a vector space • Mapping each of the categories into a continuous 6-dimensional vector • Optimizing embedding vector value by training GUI component prediction task  Categories semantically similar, close in the vector space 7 GUI Class Type Embeddings
  • 9.
    Implementation Details • Definingthe context of a component as its 16 nearest components • Measures of screen distance for determining the context  Euclidean : straight-line minimal distance on the screen • In pixel  Hierarchical : distance between 2 GUI components on the hierarchical view tree • Parent and children : 1 8 GUI Component Context
  • 10.
    Implementation Details • Combiningmultiple vectors into a lower-dimension vector • GUI component level  Concatenating 768-dimension with 6-dimension  Shrinking down to 768-dimension  Creating 774 x 768 weights • GUI screen level  Combining 768-dimension and 64-dimension  Producing 768-dimension for screen content and layout 9 Linear Layer
  • 11.
    Implementation Details • Usea pre-trained Sentence-BERT language model  Using SNLI and Multi-Genre NLI datasets with mean-pooling • Encoding the text label of description to 768-dimensional vectors • Deriving semantically similar sentences and phrases 10 Text Embeddings
  • 12.
    Implementation Details • Extractingthe layout from a screenshot • Differentiating between text and non-text GUI components • Using autoencoder to encode each image into 64-dimensional embedding vector • Encoder’s input dimension : 11,200 • Two hidden layers of 2,048 and 256 • Applying RLU to eliminate negative input • Loss determined by MSE 11 Layout Embeddings
  • 13.
    Implementation Details • Combiningembedding vectors of multiple GUI components • GUI components embeddings fed into the RNN  In the pre-order traversal order of hierarchy tree • Starting with hidden state of zero, fed into a linear layer with 𝑛 − 1 𝑡ℎ output 12 GUI Embedding Combining Layer
  • 14.
    Training Configuration • Training:90% of the data; validation: 10% • Cross entropy loss function with Adam optimizer • Learning rate: 0.001; batch size: 256 • GUI component model: 120 epochs; GUI screen model: 80-120 epochs • Total loss  Component • Total Loss = Loss(text prediction) + Loss(class type prediction)  Screen • Negative sampling • Prediction compared to the correct screen and a sample of negative data • Random sampling of other screens with size 128 on the same app • To differentiate different screens on the same app 13
  • 15.
    Baselines • Text EmbeddingOnly (similar textual context)  Screen embedding method used in SOVITE  Computed by averaging the text embedding vectors for all the text in the screen • Layout Embedding Only (similar layout)  Screen embedding method used in the original RICO paper  Computed by the layout autoencoder to represent the screen • Visual Embedding Only (similar visual)  Direct screen shot of image instead of layout  Inspired by VASTA, Sikuli, and HILC 14
  • 16.
    Results • Predicting eachGUI screen in all the GUI interaction traces in the RICO dataset using its context  3 versions to compare • EUCLIDEAN with locations of GUI components and the screen layouts • HIERARCHICAL with above spatial info • EUCLIDEAN without spatial info 15
  • 17.
    Sample Downstream Tasks •The main purpose is to produce distributed vector representations that encode useful semantic, layout, design properties • Compare similarity between the nearest neighbor results by different models Methods • Select 50 screens from apps and app domains • Retrieve top-5 most similar screens using each of 3 models • 79 Mechanical Turk workers participated • Each worker saw top-5 most similar screens of 5 source screens produced by 3 models • Questionnaires include followings  (1) App similarity (2) Screen type similarity (3) Content similarity 16 Nearest Neighbors
  • 18.
    Sample Downstream Tasks Results •The differences between the mean ratings of the Screen2Vec model and both TextOnly and LayoutOnly model are significant (non-parametric Mann-Whitney U test) • Retrieve top-5 most similar screens using each of 3 models 17 Nearest Neighbors
  • 19.
    Sample Downstream Tasks Observation •Screen2Vec generate more comprehensive representations  “Request ride” in Lyft • “Get direction” in Uber Driver • “Select navigation type” in Waze app • “Request ride” in Free Now  MapView taking majority  All feature a menu/information card at the bottom 1/3 – 1/4 • TextOnly generated results are semantically similar to “payment” • LayoutOnly generated results show lower score in the content and app-context similarity 18 Nearest Neighbors
  • 20.
    Sample Downstream Tasks Word2Vec •“Man is to woman as brother is to sister” • (brother - man + woman) results in an embedding vector representing sister Screen2Vec • Marriott app ’s “hotel booking” screen + (Cheapoair app’s “search result” screen − Cheapoair app’s “hotel booking” screen)) • The top result is the “search result” screen in the Marriott app 19 Embedding Composability
  • 21.
    Sample Downstream Tasks •Preliminary evaluation on the effectiveness of embedding mobile tasks as sequences of Screen2Vec screen embedding vectors • Recording scripts of completing 10 common smartphone tasks • Representing each task as the average of Screen2Vec vectors • Querying for the nearest neighbor within 20 task variations and get 18/20 accuracy  TextOnly : 14/20 accuracy 20 Screen Embedding Sequences for Representing Mobile Tasks
  • 22.
    Potential Application • Designersquery for example designs that display similar content or screens in apps of a similar domain • Composability helps to find a specific page for the app  Suppose a designer searches for checkout page for app A  A’s order page + (App B’s checkout page – App B’s order page • LayoutGAN can generate realistic GUI layouts based on user-specified constraints  Applying Screen2Vec to incorporate the semantics of GUIs and the context of user interaction 21
  • 23.
    Limitation • Only trainedand test on Android app GUIs • RICO dataset  contains interaction traces within single apps  need to generalize multiple app  Does not contain paid apps • Screen2Vec does not encode the semantics of graphic icons that have no textual information 22

Editor's Notes

  • #17 Correct GUI component is among the top 0.01% in the prediction result Aggregating textual information is useful for representing topic of a screen  good top 0.1% and 1% / NRMSE
  • #20 Textual content, visual design, layout pattern, and app context
  • #21 Add, substract, and average to form meaningful new one
  • #22 Add, substract, and average to form meaningful new one
  • #23 Add, substract, and average to form meaningful new one