Download to read offline

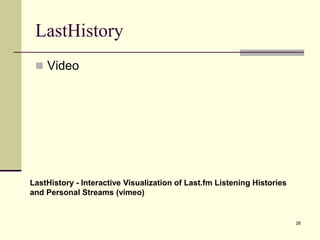
![LastHistory [Dominikus et al.
InfoVis 2010]
25](https://image.slidesharecdn.com/temporal-201116114536/85/Temporal-25-320.jpg)
![28
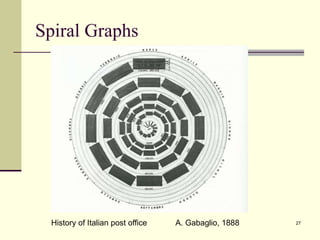
Paper: Visualizing Time-Series on
Spirals [weber et al. Infovis 01]](https://image.slidesharecdn.com/temporal-201116114536/85/Temporal-28-320.jpg)
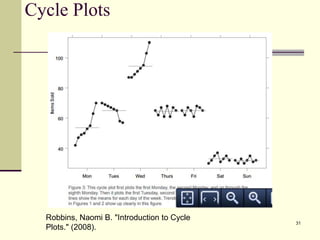
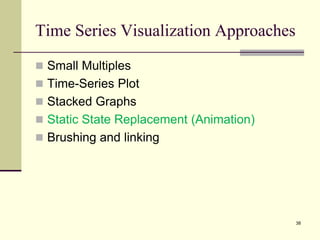
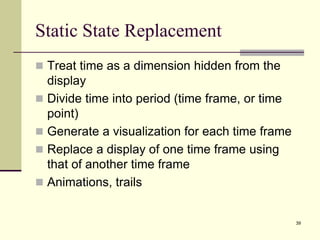
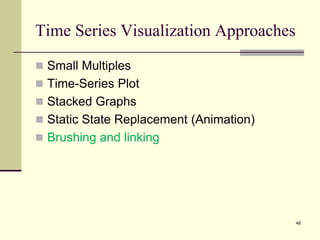
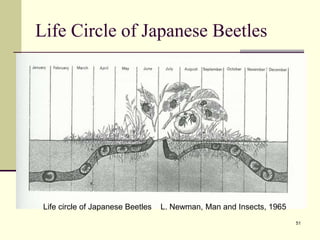
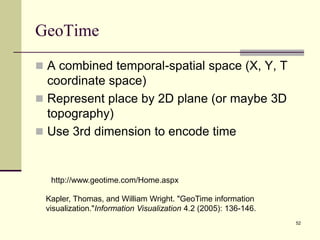
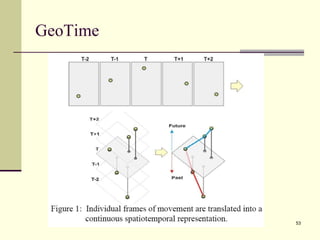
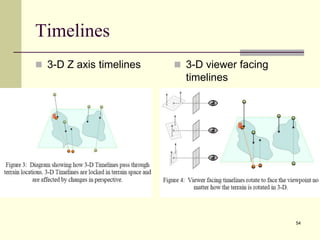
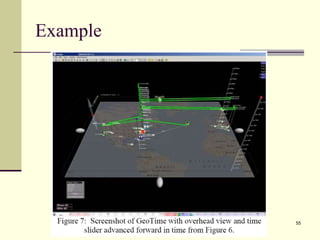

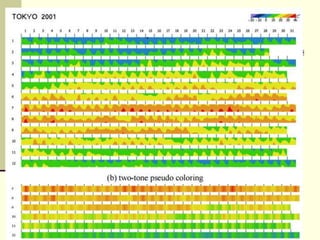
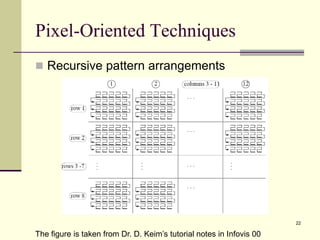
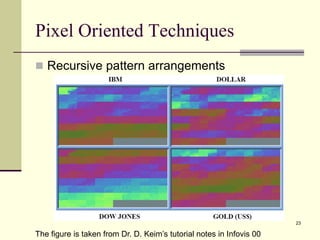
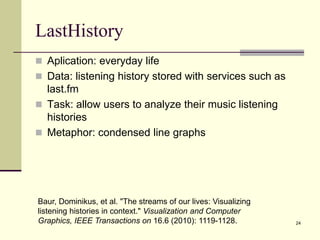
This document discusses various approaches for visualizing time-oriented data and time series data. It describes common datasets that have a temporal component, such as events with associated dates and times. It then covers different visualization techniques including small multiples, time series plots, stacked graphs, static state replacement/animation, and brushing and linking. For each technique, examples are provided such as weather data visualizations, stock market charts, and visualizations of listening histories. The document also discusses combining temporal and spatial data visualization using techniques like GeoTime.


