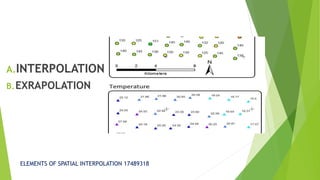
The document discusses spatial interpolation techniques. Spatial interpolation is the process of using points with known values to estimate values at other points, turning raw data into useful information by adding context and values. It can predict unknown values for geographic point data like elevation, rainfall, or chemical concentration. Common uses of spatial interpolation in GIS include calculating properties of a surface at given points, providing contours for graphical displays, and aiding in spatial decision making like terrain analysis and hydrology. Interpolation methods can be classified as global or local, exact or approximate, stochastic or deterministic, and abrupt or smooth.
Interpolation is the process of using points with known values to estimate values at other unknown points. It can be used to predict unknown values for any geographic point data, such as elevation, rainfall, noise levels, atmospheric components and so on.
The Inverse Distance Weighting (IDW) assumes each input point to have a local influence that diminishes with distance. It assumes that closer things are more alike than those that are farther apart. It weights the points closer to the processing cell greater than those further away. A specified number of points, or all points within a specified radius can be used to determine the output value of each location. To predict a value for any unmeasured location, IDW will use the measured values surrounding the prediction location. Those measured values closest to the prediction location will have more influence on the predicted value than those farther away.
Spline estimates values using a mathematical function that minimizes overall surface curvature, resulting in a smooth surface that passes exactly through the input points. This method is best for gently varying surfaces, such as elevation, water table heights, or pollution concentrations. A Regularized method creates a smooth, gradually changing surface with values that may lie outside the sample data range.
Kriging is a geostatistical interpolation technique that considers both the distance and the degree of variation between known data points when estimating values in unknown areas. Kriging assumes that the distance or direction between sample points reflects a spatial correlation that can be used to explain variation in the surface. The Kriging tool fits a mathematical function to a specified number of points, or all points within a specified radius, to determine the output value for each location. Kriging is a multistep process; it includes exploratory statistical analysis of the data, variogram modeling, creating the surface, and (optionally) exploring a variance surface. Kriging is most appropriate when you know there is a spatially correlated distance or directional bias in the data. It is often used in soil science and geology.
Trend is a statistical method that finds the surface that fits the sample points using a least-square regression fit. It fits one polynomial equation to the entire surface. This results in a surface that minimizes surface variance in relation to the input values. The surface is constructed so that for every input point, the total of the differences between the actual values and the estimated values (i.e., the variance) will be as small as possible.
THIS PRESENTATION IS TO HELP YOU PERFORM THE TASK STEP BY STEP.
Spatial analysis & interpolation in ARC GISKU Leuven
In ArcGIS, a data model describes the thematic layers used in the applications (for example, hamburger stands, roads, and counties); their spatial representation (for example, point, line, or polygon); their attributes; their integrity rules and relationships (for example, counties must nest within states).
Modeling Count-based Raster Data with ArcGIS and RAzavea
This presentation outlines the conceptual framework for building regression models of event counts where the unit of analysis is small. It explains how ArcGIS for Desktop can be used to build raster data sets that are modeled as generalized linear models within the open source R package.
International Journal of Engineering Research and Applications (IJERA) is an open access online peer reviewed international journal that publishes research and review articles in the fields of Computer Science, Neural Networks, Electrical Engineering, Software Engineering, Information Technology, Mechanical Engineering, Chemical Engineering, Plastic Engineering, Food Technology, Textile Engineering, Nano Technology & science, Power Electronics, Electronics & Communication Engineering, Computational mathematics, Image processing, Civil Engineering, Structural Engineering, Environmental Engineering, VLSI Testing & Low Power VLSI Design etc.
Jennifer Schaus and Associates hosts a complimentary webinar series on The FAR in 2024. Join the webinars on Wednesdays and Fridays at noon, eastern.
Recordings are on YouTube and the company website.
https://www.youtube.com/@jenniferschaus/videos
Many ways to support street children.pptxSERUDS INDIA
By raising awareness, providing support, advocating for change, and offering assistance to children in need, individuals can play a crucial role in improving the lives of street children and helping them realize their full potential
Donate Us
https://serudsindia.org/how-individuals-can-support-street-children-in-india/
#donatefororphan, #donateforhomelesschildren, #childeducation, #ngochildeducation, #donateforeducation, #donationforchildeducation, #sponsorforpoorchild, #sponsororphanage #sponsororphanchild, #donation, #education, #charity, #educationforchild, #seruds, #kurnool, #joyhome
Jennifer Schaus and Associates hosts a complimentary webinar series on The FAR in 2024. Join the webinars on Wednesdays and Fridays at noon, eastern.
Recordings are on YouTube and the company website.
https://www.youtube.com/@jenniferschaus/videos
This session provides a comprehensive overview of the latest updates to the Uniform Administrative Requirements, Cost Principles, and Audit Requirements for Federal Awards (commonly known as the Uniform Guidance) outlined in the 2 CFR 200.
With a focus on the 2024 revisions issued by the Office of Management and Budget (OMB), participants will gain insight into the key changes affecting federal grant recipients. The session will delve into critical regulatory updates, providing attendees with the knowledge and tools necessary to navigate and comply with the evolving landscape of federal grant management.
Learning Objectives:
- Understand the rationale behind the 2024 updates to the Uniform Guidance outlined in 2 CFR 200, and their implications for federal grant recipients.
- Identify the key changes and revisions introduced by the Office of Management and Budget (OMB) in the 2024 edition of 2 CFR 200.
- Gain proficiency in applying the updated regulations to ensure compliance with federal grant requirements and avoid potential audit findings.
- Develop strategies for effectively implementing the new guidelines within the grant management processes of their respective organizations, fostering efficiency and accountability in federal grant administration.
A process server is a authorized person for delivering legal documents, such as summons, complaints, subpoenas, and other court papers, to peoples involved in legal proceedings.
Russian anarchist and anti-war movement in the third year of full-scale warAntti Rautiainen
Anarchist group ANA Regensburg hosted my online-presentation on 16th of May 2024, in which I discussed tactics of anti-war activism in Russia, and reasons why the anti-war movement has not been able to make an impact to change the course of events yet. Cases of anarchists repressed for anti-war activities are presented, as well as strategies of support for political prisoners, and modest successes in supporting their struggles.
Thumbnail picture is by MediaZona, you may read their report on anti-war arson attacks in Russia here: https://en.zona.media/article/2022/10/13/burn-map
Links:
Autonomous Action
http://Avtonom.org
Anarchist Black Cross Moscow
http://Avtonom.org/abc
Solidarity Zone
https://t.me/solidarity_zone
Memorial
https://memopzk.org/, https://t.me/pzk_memorial
OVD-Info
https://en.ovdinfo.org/antiwar-ovd-info-guide
RosUznik
https://rosuznik.org/
Uznik Online
http://uznikonline.tilda.ws/
Russian Reader
https://therussianreader.com/
ABC Irkutsk
https://abc38.noblogs.org/
Send mail to prisoners from abroad:
http://Prisonmail.online
YouTube: https://youtu.be/c5nSOdU48O8
Spotify: https://podcasters.spotify.com/pod/show/libertarianlifecoach/episodes/Russian-anarchist-and-anti-war-movement-in-the-third-year-of-full-scale-war-e2k8ai4
2. What is Spatial Interpolation?
It is the process of using points with known values to estimate
values at other points.
Turns raw data into useful information by adding greater
informative content and vales.
Reveals patterns, tends which is been missed.
ELEMENTS OF SPATIAL INTERPOLATION 17489318
3. Why interpolate to raster?
Visiting every location in a study areas to measure the height
,magnitude or concentration of a phenomenon is usually
difficult or expensive.
Instead input points locations can be selected and a predicted
values can be assigned to other locations.
Input points can be either randomly or regularly spaced points
containing height, concentration or magnitude measurements.
ELEMENTS OF SPATIAL INTERPOLATION 17489318
4. Tobler’s law of Geography
Statement: Observations or
points which are close together
in space are more likely to have
similar values than the points
which are far apart.
ELEMENTS OF SPATIAL INTERPOLATION 17489318
6. Interpolation predicts values for a cell in a raster from a
limited number of samples data points.
It can be used to predict unknown values for any
geographic point data , such as elevation , rainfall ,
chemical concentration etc.
The interpolation cannot be done for : cyclic data,
counts and amounts, nominal data.
One must have interval or ratio data for interpolation.
ELEMENTS OF SPATIAL INTERPOLATION 17489318
8. Spatial interpolation may be used in GIS:
To calculate some property of the surface at a given
point.
To provide contour for displaying data graphically.
Frequently used in spatial decision making process
like terrain analysis , hydrology , mineral
prospecting etc
ELEMENTS OF SPATIAL INTERPOLATION 17489318
9. A classification of interpolation
methods:
Global versus Local
Exact versus Approximate
Stochastic versus Deterministic
Abrupt versus Smooth
ELEMENTS OF SPATIAL INTERPOLATION 17489318