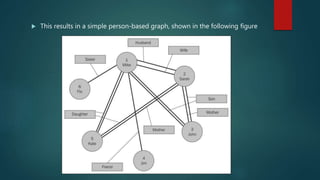
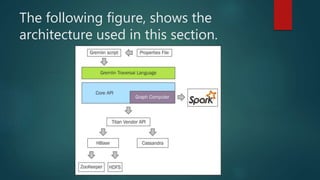
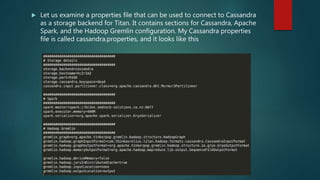
-Introduction to sample problem statement
-Which Graph database is used and why
-Installing Titan
-Titan with Cassandra
-The Gremlin Cassandra script: A way to store data in cassandra from Titan Gremlin
-Accessing Titan with Spark
Time-evolving Graph Processing on Commodity Clusters: Spark Summit East talk ...Spark Summit
Real-world graphs are seldom static. Applications that generate
graph-structured data today do so continuously, giving rise to an underlying graph whose structure evolves over time. Mining these time-evolving graphs can be insightful, both from research and business perspectives. While several works have focused on some individual aspects, there exists no general purpose time-evolving graph processing engine.
We present Tegra, a time-evolving graph processing system built
on a general-purpose dataflow framework. We introduce Timelapse, a flexible abstraction that enables efficient analytics on evolving graphs by allowing graph-parallel stages to iterate over complete history of nodes. We use Timelapse to present two computational models, a temporal analysis model for performing computations on multiple snapshots of an evolving graph, and a generalized incremental computation model for efficiently updating results of computations.
Ehtsham Elahi, Senior Research Engineer, Personalization Science and Engineer...MLconf
Spark and GraphX in the Netflix Recommender System: We at Netflix strive to deliver maximum enjoyment and entertainment to our millions of members across the world. We do so by having great content and by constantly innovating on our product. A key strategy to optimize both is to follow a data-driven method. Data allows us to find optimal approaches to applications such as content buying or our renowned personalization algorithms. But, in order to learn from this data, we need to be smart about the algorithms we use, how we apply them, and how we can scale them to our volume of data (over 50 million members and 5 billion hours streamed over three months). In this talk we describe how Spark and GraphX can be leveraged to address some of our scale challenges. In particular, we share insights and lessons learned on how to run large probabilistic clustering and graph diffusion algorithms on top of GraphX, making it possible to apply them at Netflix scale.
These are the slides for the Productionizing your Streaming Jobs webinar on 5/26/2016.
Apache Spark Streaming is one of the most popular stream processing framework that enables scalable, high-throughput, fault-tolerant stream processing of live data streams. In this talk, we will focus on the following aspects of Spark streaming:
- Motivation and most common use cases for Spark Streaming
- Common design patterns that emerge from these use cases and tips to avoid common pitfalls while implementing these design patterns
- Performance Optimization Techniques
Strava Labs: Exploring a Billion Activity Dataset from Athletes with Apache S...Databricks
At Strava we have extensively leveraged Apache Spark to explore our data of over a billion activities, from tens of millions of athletes. This talk will be a survey of the more unique and exciting applications: A Global Heatmap gives a ~2 meter resolution density map of one billion runs, rides, and other activities consisting of three trillion GPS points from 17 billion miles of exercise data. The heatmap was rewritten from a non-scalable system into a highly scalable Spark job enabling great gains in speed, cost, and quality. Locally sensitive hashing for GPS traces was used to efficiently cluster 1 billion activities. Additional processes categorize and extract data from each cluster, such as names and statistics. Clustering gives an automated process to extract worldwide geographical patterns of athletes.
Applications include route discovery, recommendation systems, and detection of events and races. A coarse spatiotemporal index of all activity data is stored in Apache Cassandra. Spark streaming jobs maintain this index and compute all space-time intersections (“flybys”) of activities in this index. Intersecting activity pairs are then checked for spatiotemporal correlation, indicated by connected components in the graph of highly correlated pairs form “Group Activities”, creating a social graph of shared activities and workout partners. Data from several hundred thousand runners was used to build an improved model of the relationship between running difficulty and elevation gradient (Grade Adjusted Pace).
Data processing platforms architectures with Spark, Mesos, Akka, Cassandra an...Anton Kirillov
This talk is about architecture designs for data processing platforms based on SMACK stack which stands for Spark, Mesos, Akka, Cassandra and Kafka. The main topics of the talk are:
- SMACK stack overview
- storage layer layout
- fixing NoSQL limitations (joins and group by)
- cluster resource management and dynamic allocation
- reliable scheduling and execution at scale
- different options for getting the data into your system
- preparing for failures with proper backup and patching strategies
Data Pipelines & Integrating Real-time Web Services w/ Storm : Improving on t...Brian O'Neill
This presentation covers our use of Storm and the connectors we've built. It also proposes a design for integrating Storm with real-time web services by embedding parts of topologies directly into the web services layer.
Real-time Machine Learning Analytics Using Structured Streaming and Kinesis F...Databricks
Persisting data from Amazon Kinesis using Amazon Kinesis Firehose is a popular pattern for streaming projects. However, building real-time analytics on these data introduces challenges, including managing the format, size and frequency of the files created.
This session will present an end-to-end use case for deploying machine learning streaming analytics at-scale using Structured Streaming on Databricks. We will deploy a high-volume Kinesis producer, persist the data to S3 using Kinesis Firehose, partition and write the data using Parquet, create a machine learning model and, finally, query and visualize the data in real time.
Key takeaways include:
– Create a Kinesis producer
– Persist to S3 using Kinesis Firehose
– ETL, machine learning, and exploratory data analysis using Structured Streaming
Expanding Apache Spark Use Cases in 2.2 and Beyond with Matei Zaharia and dem...Databricks
2017 continues to be an exciting year for big data and Apache Spark. I will talk about two major initiatives that Databricks has been building: Structured Streaming, the new high-level API for stream processing, and new libraries that we are developing for machine learning. These initiatives can provide order of magnitude performance improvements over current open source systems while making stream processing and machine learning more accessible than ever before.
Analyzing Time Series Data with Apache Spark and CassandraPatrick McFadin
You have collected a lot of time series data so now what? It's not going to be useful unless you can analyze what you have. Apache Spark has become the heir apparent to Map Reduce but did you know you don't need Hadoop? Apache Cassandra is a great data source for Spark jobs! Let me show you how it works, how to get useful information and the best part, storing analyzed data back into Cassandra. That's right. Kiss your ETL jobs goodbye and let's get to analyzing. This is going to be an action packed hour of theory, code and examples so caffeine up and let's go.
A Scalable Hierarchical Clustering Algorithm Using Spark: Spark Summit East t...Spark Summit
Clustering is often an essential first step in datamining intended to reduce redundancy, or define data categories. Hierarchical clustering, a widely used clustering technique, can
offer a richer representation by suggesting the potential group
structures. However, parallelization of such an algorithm is challenging as it exhibits inherent data dependency during the hierarchical tree construction. In this paper, we design a
parallel implementation of Single-linkage Hierarchical Clustering by formulating it as a Minimum Spanning Tree problem. We further show that Spark is a natural fit for the parallelization of
single-linkage clustering algorithm due to its natural expression
of iterative process. Our algorithm can be deployed easily in
Amazon’s cloud environment. And a thorough performance
evaluation in Amazon’s EC2 verifies that the scalability of our
algorithm sustains when the datasets scale up.
Sketching Data with T-Digest In Apache Spark: Spark Summit East talk by Erik ...Spark Summit
Algorithms for sketching probability distributions from large data sets are a fundamental building block of modern data science. Sketching plays a role in diverse applications ranging from visualization, optimizing data encodings, estimating quantiles, data synthesis and imputation. The T-Digest is a versatile sketching data structure. It operates on any numeric data, models tricky distribution tails with high fidelity, and most crucially it works smoothly with aggregators and map-reduce.
T-Digest is a perfect fit for Apache Spark; it is single-pass and intermediate results can be aggregated across partitions in batch jobs or aggregated across windows in streaming jobs. In this talk I will describe a native Scala implementation of the T-Digest sketching algorithm and demonstrate its use in Spark applications for visualization, quantile estimations and data synthesis.
Attendees of this talk will leave with an understanding of data sketching with T-Digest sketches, and insights about how to apply T-Digest to their own data analysis applications.
Deep Dive Into Catalyst: Apache Spark 2.0’s OptimizerDatabricks
Catalyst is becoming one of the most important components in Apache Spark, as it underpins all the major new APIs in Spark 2.0, from DataFrames, Datasets, to streaming. At its core, Catalyst is a general library for manipulating trees. Based on this library, we have built a modular compiler frontend for Spark, including a query analyzer, optimizer, and an execution planner. In this talk, I will first introduce the concepts of Catalyst trees, followed by major features that were added in order to support Spark’s powerful API abstractions. Audience will walk away with a deeper understanding of how Spark 2.0 works under the hood.
A Deep Dive into Stateful Stream Processing in Structured Streaming with Tath...Databricks
Stateful processing is one of the most challenging aspects of distributed, fault-tolerant stream processing. The DataFrame APIs in Structured Streaming make it very easy for the developer to express their stateful logic, either implicitly (streaming aggregations) or explicitly (mapGroupsWithState). However, there are a number of moving parts under the hood which makes all the magic possible. In this talk, I am going to dive deeper into how stateful processing works in Structured Streaming.
In particular, I’m going to discuss the following.
• Different stateful operations in Structured Streaming
• How state data is stored in a distributed, fault-tolerant manner using State Stores
• How you can write custom State Stores for saving state to external storage systems.
Accumulo Summit 2015: Using D4M for rapid prototyping of analytics for Apache...Accumulo Summit
Talk Abstract
The ability to collect and analyze large amounts of data is a growing problem amongst the scientific community. The growing gap between data and users calls for innovative tools that address the challenges faced by big data: volume, velocity and variety.
This tutorial aims to provide researchers and practitioners with a range of tools and techniques that they can use in conjunction with Apache Accumulo to close this gap. The proposed tutorial will focus on building solid fundamentals using a rapid prototyping tool – the Dynamic Distributed Dimensional Data Model (D4M) – to quickly prototype new algorithms that can be tested with Apache Accumulo. The tutorial will be suitable for participants from all levels of experience using Apache Accumulo. The tutorial will begin with a general introduction of the big data landscape in order to align terminology and provide a unified view of the system regardless of participant background. The tutorial will then discuss systems engineering and how it applies to big data systems. We will then introduce D4M and provide examples of D4M being used for analytics such as dimensional analysis and background model fitting. We will then discuss current areas of research on security and privacy as well as graph algorithms. Tutorial slides will be distributed to participants and brief demonstrations will be used to reinforce concepts.
The goals of the tutorial are 1) to provide participants with a theoretical foundation of big data; 2) to demonstrate how Accumulo can be used to solve real problems from diverse domains; and 3) describe future avenues of research. This tutorial provides a deep dive into the topics presented at the 2014 Accumulo Summit in the presentation entitled: “Addressing Big Data Challenges through Innovative Architecture, Databases and Software”.
Speakers
Vijay Gadepally
Technical Staff, Lincoln Laboratory, MIT
Lauren Edwards
Associate Technical Staff, Lincoln Laboratory, MIT
Jeremy Kepner
Senior Technical Staff, Lincoln Laboratory, MIT
Apache Cassandra for Timeseries- and Graph-DataGuido Schmutz
Apache Cassandra has proven to be one of the best solutions for storing and retrieving data at high velocity and high volume.
In the first part of the talk we will discuss how the storage model of Cassandra is ideal for time series use cases, which are often of high velocity and high volume. Time series data is everywhere today: Internet of Things, sensor data, transactional data, social media streams. We go over examples of how to best build data models.
We will also cover pairing Apache Spark with Apache Cassandra to create a real time data analytics platform.
The second part of the talk will present Titan:db, an open source distributed graph database build on top of Cassandra that can power real-time applications with thousands of concurrent users over graphs with billions of edges. It exposes a property graph data model directly atop Cassandra which makes storing and querying relationship data fast, easy, and scalable to huge graphs. This talk demonstrates how Titan's features enable complex, multi-relational databases in Cassandra and discusses how Titan:db has been used in a customer case to store social network data.
Graphs are everywhere! Distributed graph computing with Spark GraphXAndrea Iacono
These are the slide for the talk given at Codemotion Milan on november 2015. The source code shown is available at https://github.com/andreaiacono/TalkGraphX .
Big Graph Analytics on Neo4j with Apache SparkKenny Bastani
In this talk I will introduce you to a Docker container that provides you an easy way to do distributed graph processing using Apache Spark GraphX and a Neo4j graph database. You'll learn how to analyze big data graphs that are exported from Neo4j and consequently updated from the results of a Spark GraphX analysis. The types of analysis I will be talking about are PageRank, connected components, triangle counting, and community detection.
Database technologies have evolved to be able to store big data, but are largely inflexible. For complex graph data models stored in a relational database there may be tedious transformations and shuffling around of data to perform large scale analysis.
Fast and scalable analysis of big data has become a critical competitive advantage for companies. There are open source tools like Apache Hadoop and Apache Spark that are providing opportunities for companies to solve these big data problems in a scalable way. Platforms like these have become the foundation of the big data analysis movement.
Speakers
https://www.eventbrite.com/e/talk-by-paco-nathan-graph-analytics-in-spark-tickets-17173189472
Big Brains meetup hosted by BloomReach, 2015-06-04
Case study / demo of a large-scale graph analytics project, leveraging GraphX in Apache Spark to surface insights about open source developer communities — based on data mining of their email forums. The project works with any Apache email archive, applying NLP and machine learning techniques to analyze message threads, then constructs a large graph. Graph analytics, based on concise Scala coding examples in Spark, surface themes and interactions within the community. Results are used as feedback for respective developer communities, such as leaderboards, etc. As an example, we will examine analysis of the Spark developer community itself.
WEBSOCKETS AND WEBWORKERS
FOR LOW LATENCY INTERACTIVE WEB APPLICATIONS
By Prakriti Patra
AGENDA
Interactive Web Applications
Problems
Earlier Techniques
Polling
Long Polling
Streaming
HTML5 Web Sockets
How Web Sockets work
Comparison of Polling vs Web Socket
Support Chart
Event Looping in JavaScript
Non Blocking Threads
Web Workers
By Mr. Praveen R
Content
-What are we solving?
-Money weighted rate of
return (MWRR)
-MWRR Example
-Newton-Raphson Solver
-Demo
-Spark
-Apache Common Solvers
Building high scalable distributed framework on apache mesosSigmoid
By Mr. Rahul Kumar
Content
-Mesos Intro
-Software Projects Built on Mesos
-Create own Framework
-Why Mesos
-Protocol Buffer
-The Scheduler
-The Executor
-Mesos Endpoints
Failsafe Hadoop Infrastructure and the way they workSigmoid
Impact
Different Kinds Of HA Configurations
HDFS HA - Necessary Hardware Resources
HDFS HA Architecture Using The Quorum Journal Manager
RM HA -Necessary Hardware Resources
Resource Manager HA Architecture
RM Failover
This presentation explains how to get started with Apache Cassandra to provide a scale out, fault tolerant backend for inventory storage on OpenSimulator.
C*ollege Credit: CEP Distribtued Processing on Cassandra with StormDataStax
Cassandra provides facilities to integrate with Hadoop. This is sufficient for distributed batch processing, but doesn’t address CEP distributed processing. This webinar will demonstrate use of Cassandra in Storm. Storm provides a data flow and processing layer that can be used to integrate Cassandra with other external persistences mechanisms (e.g. Elastic Search) or calculate dimensional counts for reporting and dashboards. We’ll dive into a sample Storm topology that reads and writes from Cassandra using storm-cassandra bolts.
Presented to the Dublin Cassandra User Group by Niall Milton of DigBigData. This presentation is on Cassandra and its use with other technologies such as Storm, Spark, Hadoop, ElasticSearch and Redis. This presentation should act as a solid foundation to explore some of the mentioned technologies in more depth.
(BDT303) Running Spark and Presto on the Netflix Big Data PlatformAmazon Web Services
In this session, we discuss how Spark and Presto complement the Netflix big data platform stack that started with Hadoop, and the use cases that Spark and Presto address. Also, we discuss how we run Spark and Presto on top of the Amazon EMR infrastructure; specifically, how we use Amazon S3 as our data warehouse and how we leverage Amazon EMR as a generic framework for data-processing cluster management.
Next Generation Databases mostly addressing some of the points: being non-relational, distributed, open-source and horizontally scalable. The original intention has been modern web-scale databases. The movement began early 2009 and is growing rapidly. Often more characteristics apply such as: schema-free, easy replication support, simple API, eventually consistent / BASE (not ACID), a huge amount of data and more. So the misleading term "nosql" (the community now translates it mostly with "not only sql") should be seen as an alias to something like the definition above.
Maximum Overdrive: Tuning the Spark Cassandra Connector (Russell Spitzer, Dat...DataStax
Worried that you aren't taking full advantage of your Spark and Cassandra integration? Well worry no more! In this talk we'll take a deep dive into all of the available configuration options and see how they affect Cassandra and Spark performance. Concerned about throughput? Learn to adjust batching parameters and gain a boost in speed. Always running out of memory? We'll take a look at the various causes of OOM errors and how we can circumvent them. Want to take advantage of Cassandra's natural partitioning in Spark? Find out about the recent developments that let you perform shuffle-less joins on Cassandra-partitioned data! Come with your questions and problems and leave with answers and solutions!
About the Speaker
Russell Spitzer Software Engineer, DataStax
Russell Spitzer received a Ph.D in Bio-Informatics before finding his deep passion for distributed software. He found the perfect outlet for this passion at DataStax where he began on the Automation and Test Engineering team. He recently moved from finding bugs to making bugs as part of the Analytics team where he works on integration between Cassandra and Spark as well as other tools.
Similar to Using spark for timeseries graph analytics (20)
Building bots to automate common developer tasks - Writing your first smart c...Sigmoid
Human Communication
Online Communication
Messaging today
Why Messaging Apps might take over native apps
Why the sudden Bot uprising?
What is a Bot?
What makes a great bot?
Design principles
Common pitfalls
Before starting to develop a Bot
Helpful tools
Simple architecture
Demo: Uber Bot
References
Session 2 : "Approaches to Text Analysis"
- Mr. Rohith Yeravothula (25 mins)
Introduction to Text Analytics
Introduction to News Documents text analysis
Introduction to our Architecture and its elements
Introduction to Compute Pipeline
Phase I Computation
Phase II Computation
Knowledge Graph
Introduction to News-Explorer
Introduction to Spark R with R studio - Mr. Pragith Sigmoid
R is a programming language and software environment for statistical computing and graphics.
The R language is widely used among statisticians and data miners for developing statistical
software and data analysis.
RStudio IDE is a powerful and productive user interface for R.
It’s free and open source, and available on Windows, Mac, and Linux.
• Distributed datasets loaded into named columns (similar to relational DBs or
Python DataFrames).
• Can be constructed from existing RDDs or external data sources.
• Can scale from small datasets to TBs/PBs on multi-node Spark clusters.
• APIs available in Python, Java, Scala and R.
• Bytecode generation and optimization using Catalyst Optimizer.
• Simpler DSL to perform complex and data heavy operations.
• Faster runtime performance than vanilla RDDs.
Levelwise PageRank with Loop-Based Dead End Handling Strategy : SHORT REPORT ...Subhajit Sahu
Abstract — Levelwise PageRank is an alternative method of PageRank computation which decomposes the input graph into a directed acyclic block-graph of strongly connected components, and processes them in topological order, one level at a time. This enables calculation for ranks in a distributed fashion without per-iteration communication, unlike the standard method where all vertices are processed in each iteration. It however comes with a precondition of the absence of dead ends in the input graph. Here, the native non-distributed performance of Levelwise PageRank was compared against Monolithic PageRank on a CPU as well as a GPU. To ensure a fair comparison, Monolithic PageRank was also performed on a graph where vertices were split by components. Results indicate that Levelwise PageRank is about as fast as Monolithic PageRank on the CPU, but quite a bit slower on the GPU. Slowdown on the GPU is likely caused by a large submission of small workloads, and expected to be non-issue when the computation is performed on massive graphs.
As Europe's leading economic powerhouse and the fourth-largest hashtag#economy globally, Germany stands at the forefront of innovation and industrial might. Renowned for its precision engineering and high-tech sectors, Germany's economic structure is heavily supported by a robust service industry, accounting for approximately 68% of its GDP. This economic clout and strategic geopolitical stance position Germany as a focal point in the global cyber threat landscape.
In the face of escalating global tensions, particularly those emanating from geopolitical disputes with nations like hashtag#Russia and hashtag#China, hashtag#Germany has witnessed a significant uptick in targeted cyber operations. Our analysis indicates a marked increase in hashtag#cyberattack sophistication aimed at critical infrastructure and key industrial sectors. These attacks range from ransomware campaigns to hashtag#AdvancedPersistentThreats (hashtag#APTs), threatening national security and business integrity.
🔑 Key findings include:
🔍 Increased frequency and complexity of cyber threats.
🔍 Escalation of state-sponsored and criminally motivated cyber operations.
🔍 Active dark web exchanges of malicious tools and tactics.
Our comprehensive report delves into these challenges, using a blend of open-source and proprietary data collection techniques. By monitoring activity on critical networks and analyzing attack patterns, our team provides a detailed overview of the threats facing German entities.
This report aims to equip stakeholders across public and private sectors with the knowledge to enhance their defensive strategies, reduce exposure to cyber risks, and reinforce Germany's resilience against cyber threats.
Opendatabay - Open Data Marketplace.pptxOpendatabay
Opendatabay.com unlocks the power of data for everyone. Open Data Marketplace fosters a collaborative hub for data enthusiasts to explore, share, and contribute to a vast collection of datasets.
First ever open hub for data enthusiasts to collaborate and innovate. A platform to explore, share, and contribute to a vast collection of datasets. Through robust quality control and innovative technologies like blockchain verification, opendatabay ensures the authenticity and reliability of datasets, empowering users to make data-driven decisions with confidence. Leverage cutting-edge AI technologies to enhance the data exploration, analysis, and discovery experience.
From intelligent search and recommendations to automated data productisation and quotation, Opendatabay AI-driven features streamline the data workflow. Finding the data you need shouldn't be a complex. Opendatabay simplifies the data acquisition process with an intuitive interface and robust search tools. Effortlessly explore, discover, and access the data you need, allowing you to focus on extracting valuable insights. Opendatabay breaks new ground with a dedicated, AI-generated, synthetic datasets.
Leverage these privacy-preserving datasets for training and testing AI models without compromising sensitive information. Opendatabay prioritizes transparency by providing detailed metadata, provenance information, and usage guidelines for each dataset, ensuring users have a comprehensive understanding of the data they're working with. By leveraging a powerful combination of distributed ledger technology and rigorous third-party audits Opendatabay ensures the authenticity and reliability of every dataset. Security is at the core of Opendatabay. Marketplace implements stringent security measures, including encryption, access controls, and regular vulnerability assessments, to safeguard your data and protect your privacy.
Techniques to optimize the pagerank algorithm usually fall in two categories. One is to try reducing the work per iteration, and the other is to try reducing the number of iterations. These goals are often at odds with one another. Skipping computation on vertices which have already converged has the potential to save iteration time. Skipping in-identical vertices, with the same in-links, helps reduce duplicate computations and thus could help reduce iteration time. Road networks often have chains which can be short-circuited before pagerank computation to improve performance. Final ranks of chain nodes can be easily calculated. This could reduce both the iteration time, and the number of iterations. If a graph has no dangling nodes, pagerank of each strongly connected component can be computed in topological order. This could help reduce the iteration time, no. of iterations, and also enable multi-iteration concurrency in pagerank computation. The combination of all of the above methods is the STICD algorithm. [sticd] For dynamic graphs, unchanged components whose ranks are unaffected can be skipped altogether.
Show drafts
volume_up
Empowering the Data Analytics Ecosystem: A Laser Focus on Value
The data analytics ecosystem thrives when every component functions at its peak, unlocking the true potential of data. Here's a laser focus on key areas for an empowered ecosystem:
1. Democratize Access, Not Data:
Granular Access Controls: Provide users with self-service tools tailored to their specific needs, preventing data overload and misuse.
Data Catalogs: Implement robust data catalogs for easy discovery and understanding of available data sources.
2. Foster Collaboration with Clear Roles:
Data Mesh Architecture: Break down data silos by creating a distributed data ownership model with clear ownership and responsibilities.
Collaborative Workspaces: Utilize interactive platforms where data scientists, analysts, and domain experts can work seamlessly together.
3. Leverage Advanced Analytics Strategically:
AI-powered Automation: Automate repetitive tasks like data cleaning and feature engineering, freeing up data talent for higher-level analysis.
Right-Tool Selection: Strategically choose the most effective advanced analytics techniques (e.g., AI, ML) based on specific business problems.
4. Prioritize Data Quality with Automation:
Automated Data Validation: Implement automated data quality checks to identify and rectify errors at the source, minimizing downstream issues.
Data Lineage Tracking: Track the flow of data throughout the ecosystem, ensuring transparency and facilitating root cause analysis for errors.
5. Cultivate a Data-Driven Mindset:
Metrics-Driven Performance Management: Align KPIs and performance metrics with data-driven insights to ensure actionable decision making.
Data Storytelling Workshops: Equip stakeholders with the skills to translate complex data findings into compelling narratives that drive action.
Benefits of a Precise Ecosystem:
Sharpened Focus: Precise access and clear roles ensure everyone works with the most relevant data, maximizing efficiency.
Actionable Insights: Strategic analytics and automated quality checks lead to more reliable and actionable data insights.
Continuous Improvement: Data-driven performance management fosters a culture of learning and continuous improvement.
Sustainable Growth: Empowered by data, organizations can make informed decisions to drive sustainable growth and innovation.
By focusing on these precise actions, organizations can create an empowered data analytics ecosystem that delivers real value by driving data-driven decisions and maximizing the return on their data investment.
2. Content
Introduction to sample problem statement
Which Graph database is used and why
Installing Titan
Titan with Cassandra
The Gremlin Cassandra script: A way to store data in cassandra from Titan
Gremlin
Accessing Titan with Spark
3. Introducing which kind of time-series
problems that can be solved using
graph analytics and introducing the
problem statement which I have been
working on solving.
4. The dynamics of a complex system is usually
recorded in the form of time series. In recent
years, the visibility graph algorithm and the
horizontal visibility graph algorithm have been
recently introduced as the mapping between
time series and complex networks.
Transforming time series into the graphs, the
algorithms allows applying the methods of
graph theoretical tools for characterizing time
series, opening the possibility of building
fruitful connections between time series
analysis, nonlinear dynamics, and graph theory.
5. The problem statement which I have been working on:
Our initial goal was finding anomalies in the given timeseries. We started
with slicing the data into small meaningfull parts so that the data becomes
smaller and contiguous data points having the same property get clubbed
together.
Later we created a graph with these parts and tried to find the parts having
similar properties. Doing this will single out anomalies which was the goal.
6. Which graph database I used and why
i.e. Difference between graphX, neo4j
and titan , why we used titan
7. Titan vs graphX
The fundamental difference between Titan and GraphX lies in how they
persistence data and how they process data, Titan by default persists data
(vertices and edges and properties) to a distributed data store in the form of
tables bound to a specific schema. This schema can be stored in Berkley DB
tables, Cassandra tables or Hbase tables.
In the case of Titan the graph is stored as vertices in a vertex table and edges
in an edge table.
GraphX has no real persistence layer (yet?), yes it can persist to HDFS files, but
it cannot persist to a distributed datastore in a common schema like form as in
Titan’s case.
A graph only exists in GraphX when it is loaded into memory off raw data and
interpreted as Graph RDDs, Titan stores the graph permanently.
The other major difference between the two solutions is how they process
graph data.
By default, GraphX solves queries via distributed processing on many nodes in
parallel where possible as opposed to Titan processing pipelines on a single
node. Titan can also take advantage of parallel processing via Faunus/HDFS if
necessary.
8. Neo4j vs titan
The primary difference between Titan and Neo4j is scalability: Titan can distribute the graph
across multiple machines (using either Cassandra or Hbase as the storage backend) which
does three things:
1) It allows Titan to store really, really large graphs by scaling out
2) It allows Titan to handle massive write loads
3) No single point of failure for very high availability. While Neo4j's HA setup gives you
redundancy through replication, death of the master in such a setup leads to temporary
service interruption while a new master is elected.
This allows Titan to scale to large deployments with thousands of concurrent users as
demonstrated in the benchmark:
http://thinkaurelius.com/2012/08/06/titan-provides-real-time-big-graph-data/
Neo4j has been around much longer and is therefore more "mature" in some regards:
1) Integrated with an external lucene index gives it more sophisticated search capabilities
2) More integration points into other programming languages and development frameworks
(e.g. spring)
3) Has been used by more people
Titan is a native blueprints implementation and benefits from all the features that come with
the Tinkerpop stack. Titan does not support cypher but only the gremlin standard.
9. Intro to Titan graph db and how to
use it with cassandra & spark
10. Installing Titan
Downloaded the latest prebuilt version (0.9.0-M2) of Titan at
s3.thinkaurelius.com/downloads/titan/titan-0.9.0-M2-hadoop1.zip.
Carry out the following steps to ensure that Titan is installed on each node
in the cluster:
11. Now, use the Linux su (switch user) command to change to the root
account, and move the install to the /usr/local/ location. Change the file
and group membership of the install to the hadoop user, and create a
symbolic link called titan so that the current Titan release can be referred
to as the simplified path called /usr/local/titan:
12. Titan with Cassandra
In this section, the Cassandra NoSQL database will be used as a storage
mechanism for Titan. Although it does not use Hadoop, it is a large-scale,
cluster-based database in its own right, and can scale to very large cluster
sizes. A graph will be created, and stored in Cassandra using the Titan
Gremlin shell. It will then be checked using Gremlin, and the stored data
will be checked in Cassandra. The raw Titan Cassandra graph-based data
will then be accessed from Spark. The first step then will be to install
Cassandra on each node in the cluster.
13. Install Cassandra on all the nodes
Set up the Cassandra configuration under /etc/cassandra/conf by altering
the cassandra.yaml file:
Install Cassandra on all the nodes
Set up the Cassandra configuration under /etc/cassandra/conf by altering
the cassandra.yaml file:
14. Log files can be found under /var/log/cassandra, and the data is stored
under /var/lib/cassandra. The nodetool command can be used on any
Cassandra node to check the status of the Cassandra cluster:
The Cassandra CQL shell command called cqlsh can be used to access the
cluster, and create objects. The shell is invoked next, and it shows that
Cassandra version 2.0.13 is installed:
15. The Cassandra query language next shows a key space called keyspace1
that is being created and used via the CQL shell:
16. The Gremlin Cassandra script
The interactive Titan Gremlin shell can be found within the bin directory of
the Titan install, as shown here. Once started, it offers a Gremlin prompt:
17. The following script will be entered using the Gremlin shell. The first
section of the script defines the configuration in terms of the storage
(Cassandra), the port number, and the keyspace name that is to be used:
18. Next define the generic vertex properties' name and age for the graph to
be created using the Management System. It then commits the
management system changes:
19. Now, six vertices are added to the graph. Each one is given a numeric label
to represent its identity. Each vertex is given an age and name value:
20. Finally, the graph edges are added to join the vertices together. Each edge
has a relationship value. Once created, the changes are committed to store
them to Titan, and therefore Cassandra:
21. This results in a simple person-based graph, shown in the following figure
22. This graph can then be tested in Titan via the Gremlin shell using a similar
script to the previous one. Just enter the following script at the gremlin>
prompt, as was shown previously. It uses the same initial six lines to create
the titanGraph configuration, but it then creates a graph traversal variable
g.
The graph traversal variable can be used to check the graph contents.
Using the ValueMap option, it is possible to search for the graph nodes
called Mike and Flo. They have been successfully found here:
23. Using the Cassandra CQL shell, and the Titan keyspace, it can be seen that
a number of Titan tables have been created in Cassandra:
It can also be seen that the data exists in the edgestore table within
Cassandra:
This assures us that a Titan graph has been created in the Gremlin shell,
and is stored in Cassandra. Now, I will try to access the data from Spark.
24. Accessing Titan with Spark
So far, Titan 0.9.0-M2 has been installed, and the graphs have successfully
been created using Cassandra as backend storage options. These graphs
have been created using Gremlin-based scripts. In this section, a properties
file will be used via a Gremlin script to process a Titan-based graph using
Apache Spark. Cassandra will be used with Titan as backend storage
option.
26. Let us examine a properties file that can be used to connect to Cassandra
as a storage backend for Titan. It contains sections for Cassandra, Apache
Spark, and the Hadoop Gremlin configuration. My Cassandra properties
file is called cassandra.properties, and it looks like this
27. Into Titan code
The following necessary TinkerPop and Aurelius classes that will be used: