
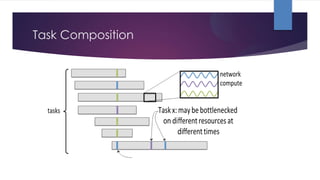
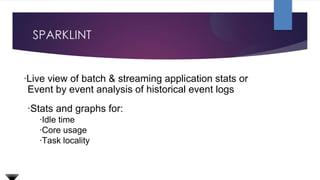
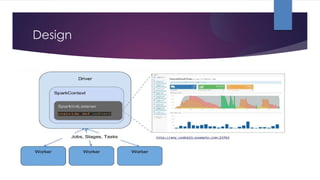
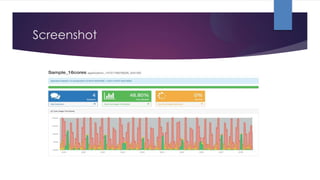
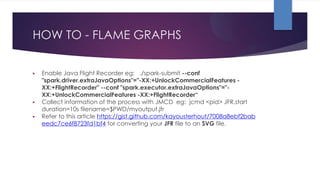
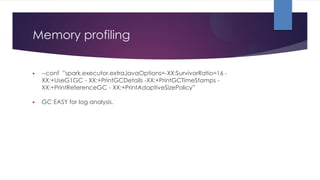
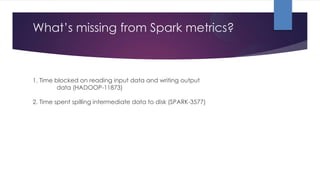


The document discusses performance monitoring in Spark applications and presents tools such as Sparklint and flame graphs for analyzing task composition and event timelines. It highlights memory profiling techniques, including the use of Java Flight Recorder and JVM commands to gather performance data, while also noting missing metrics from Spark regarding input/output operations and disk spilling. Overall, it provides guidelines for optimizing resource usage and identifying bottlenecks in Spark applications.


![[ CNCF Q1 2024 ] Intro to Continuous Profiling and Grafana Pyroscope.pdf](https://cdn.slidesharecdn.com/ss_thumbnails/cncfq12024introtocontinuousprofilingandgrafanapyroscope-240407162420-9c15afb7-thumbnail.jpg?width=640&height=640&fit=bounds)