Download as PDF, PPTX


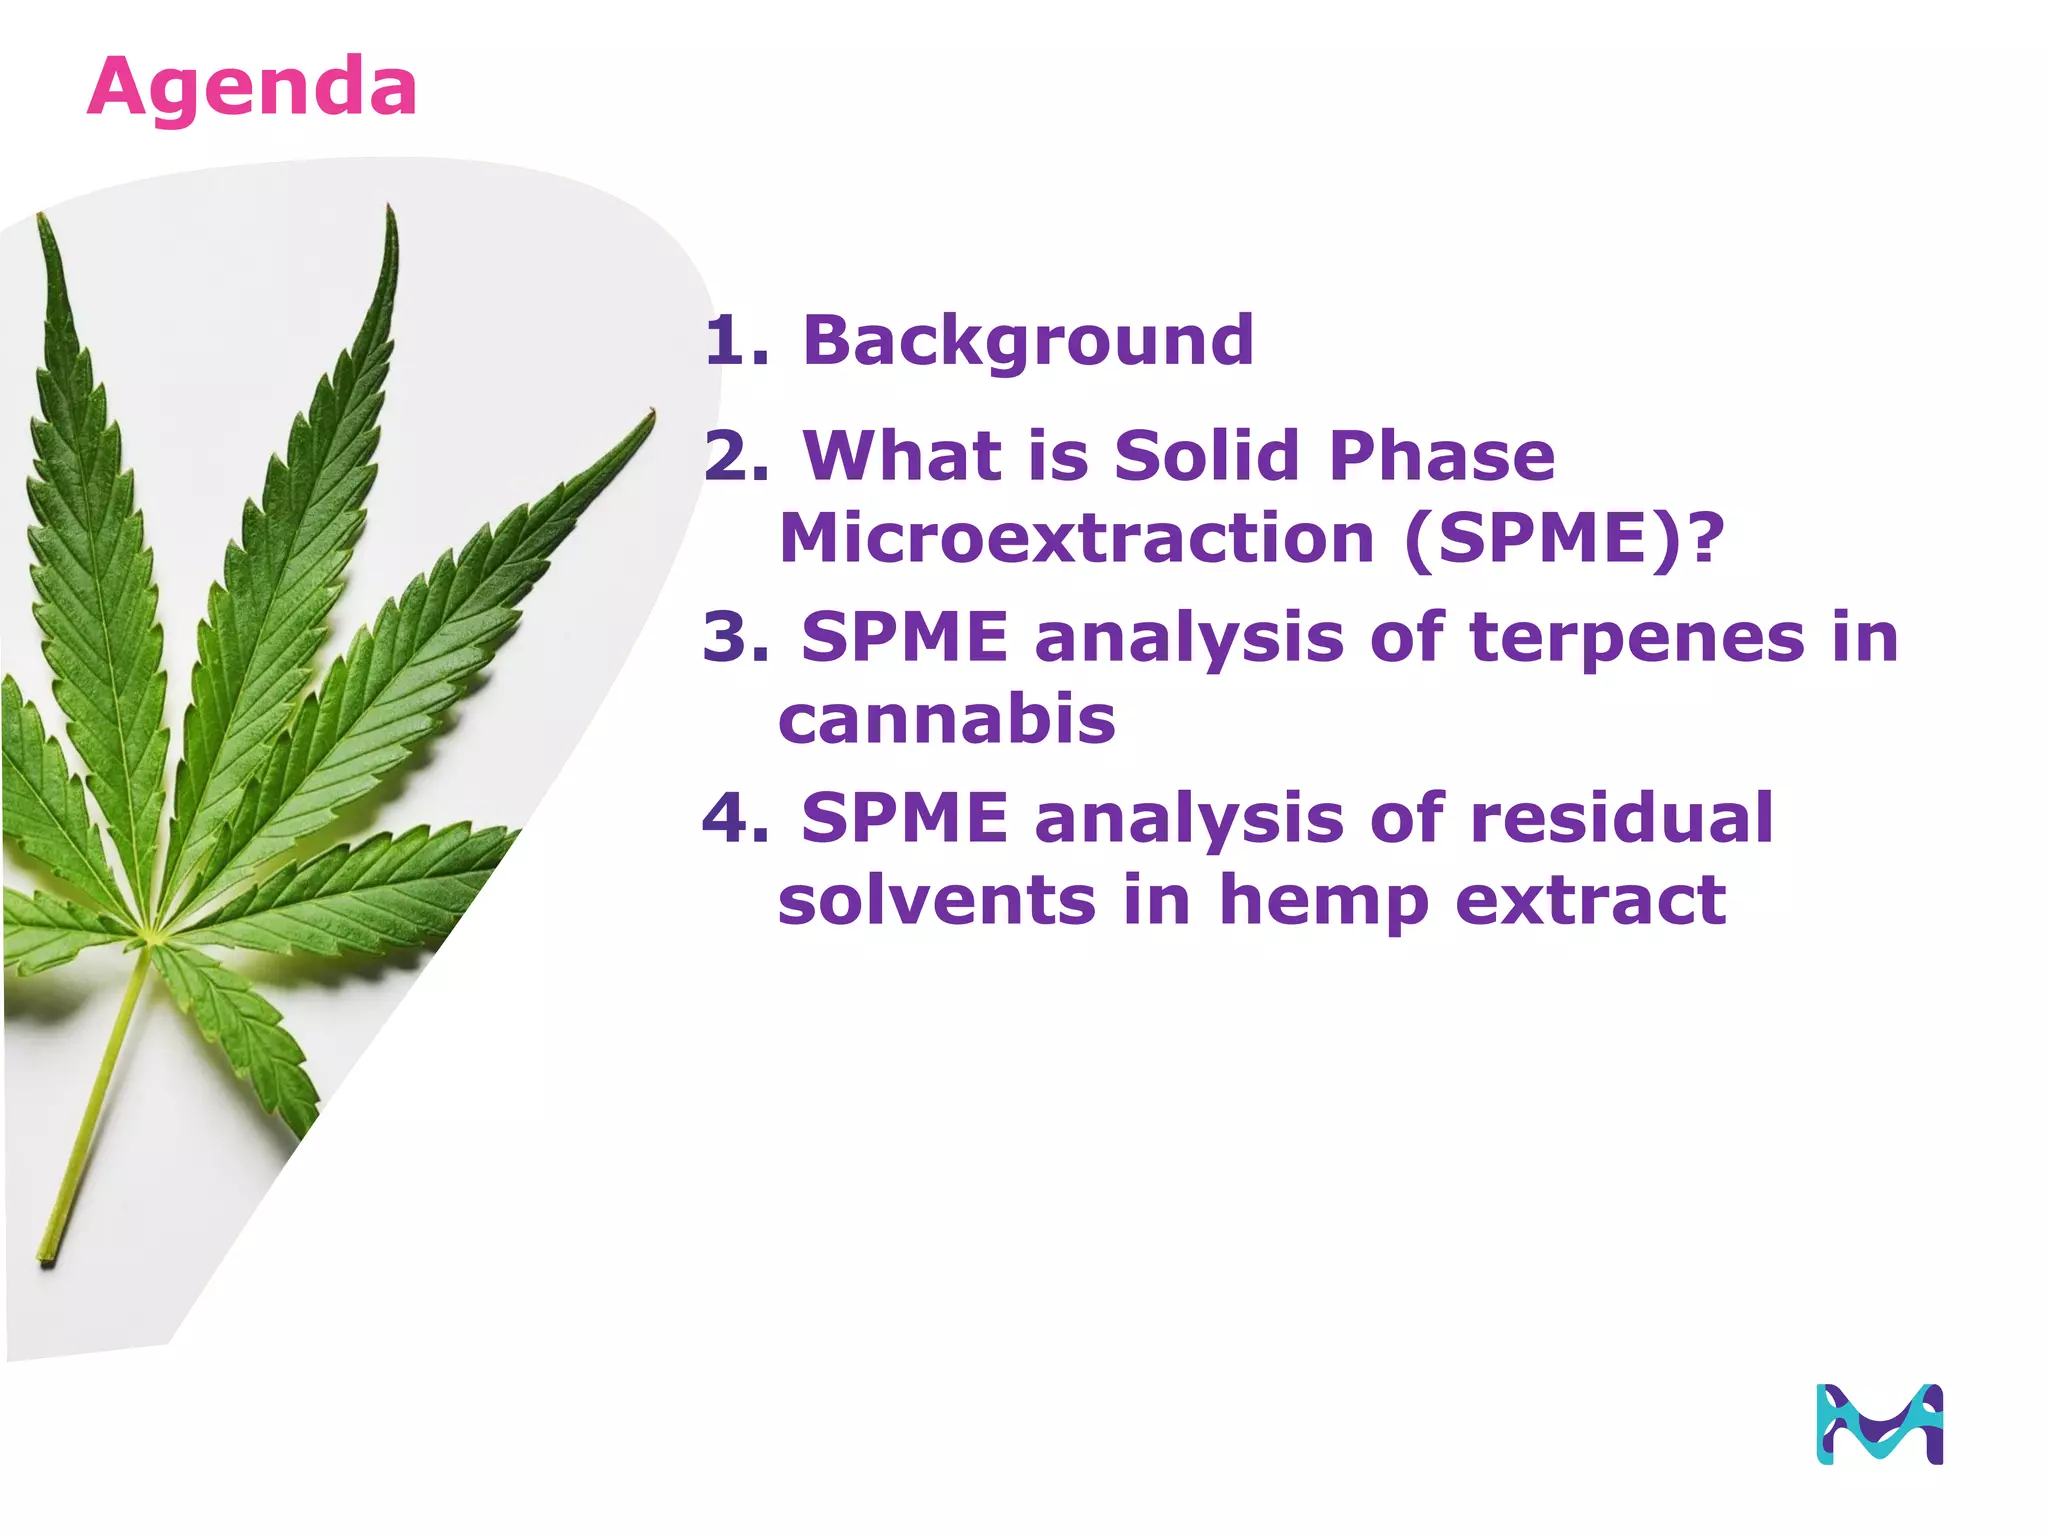
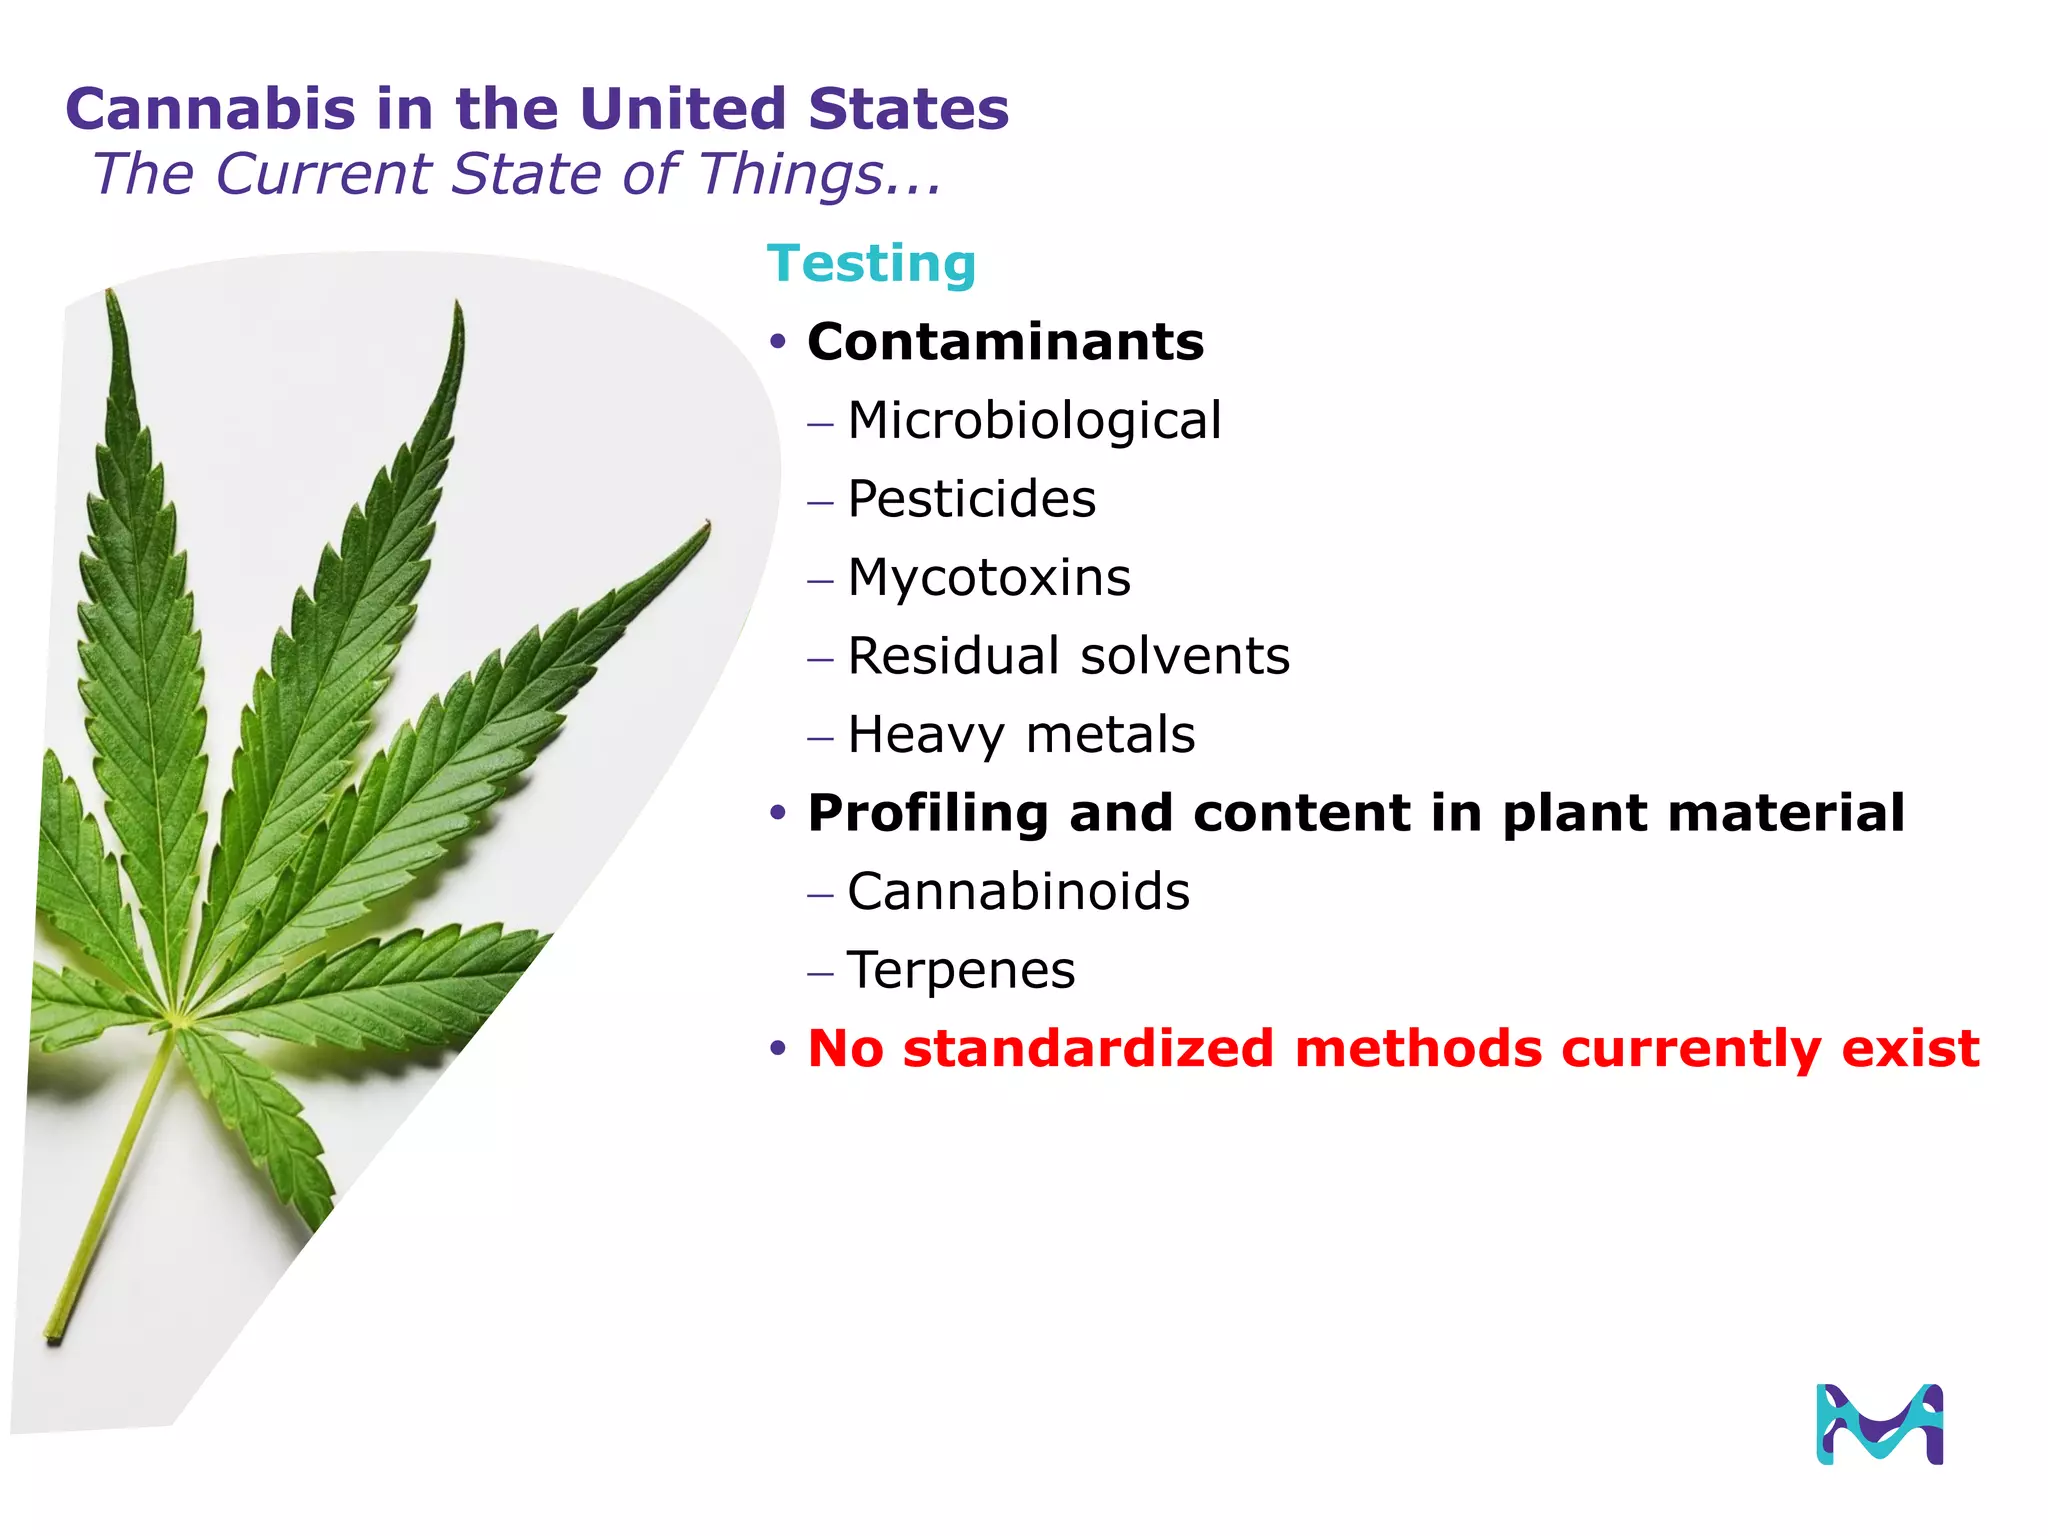
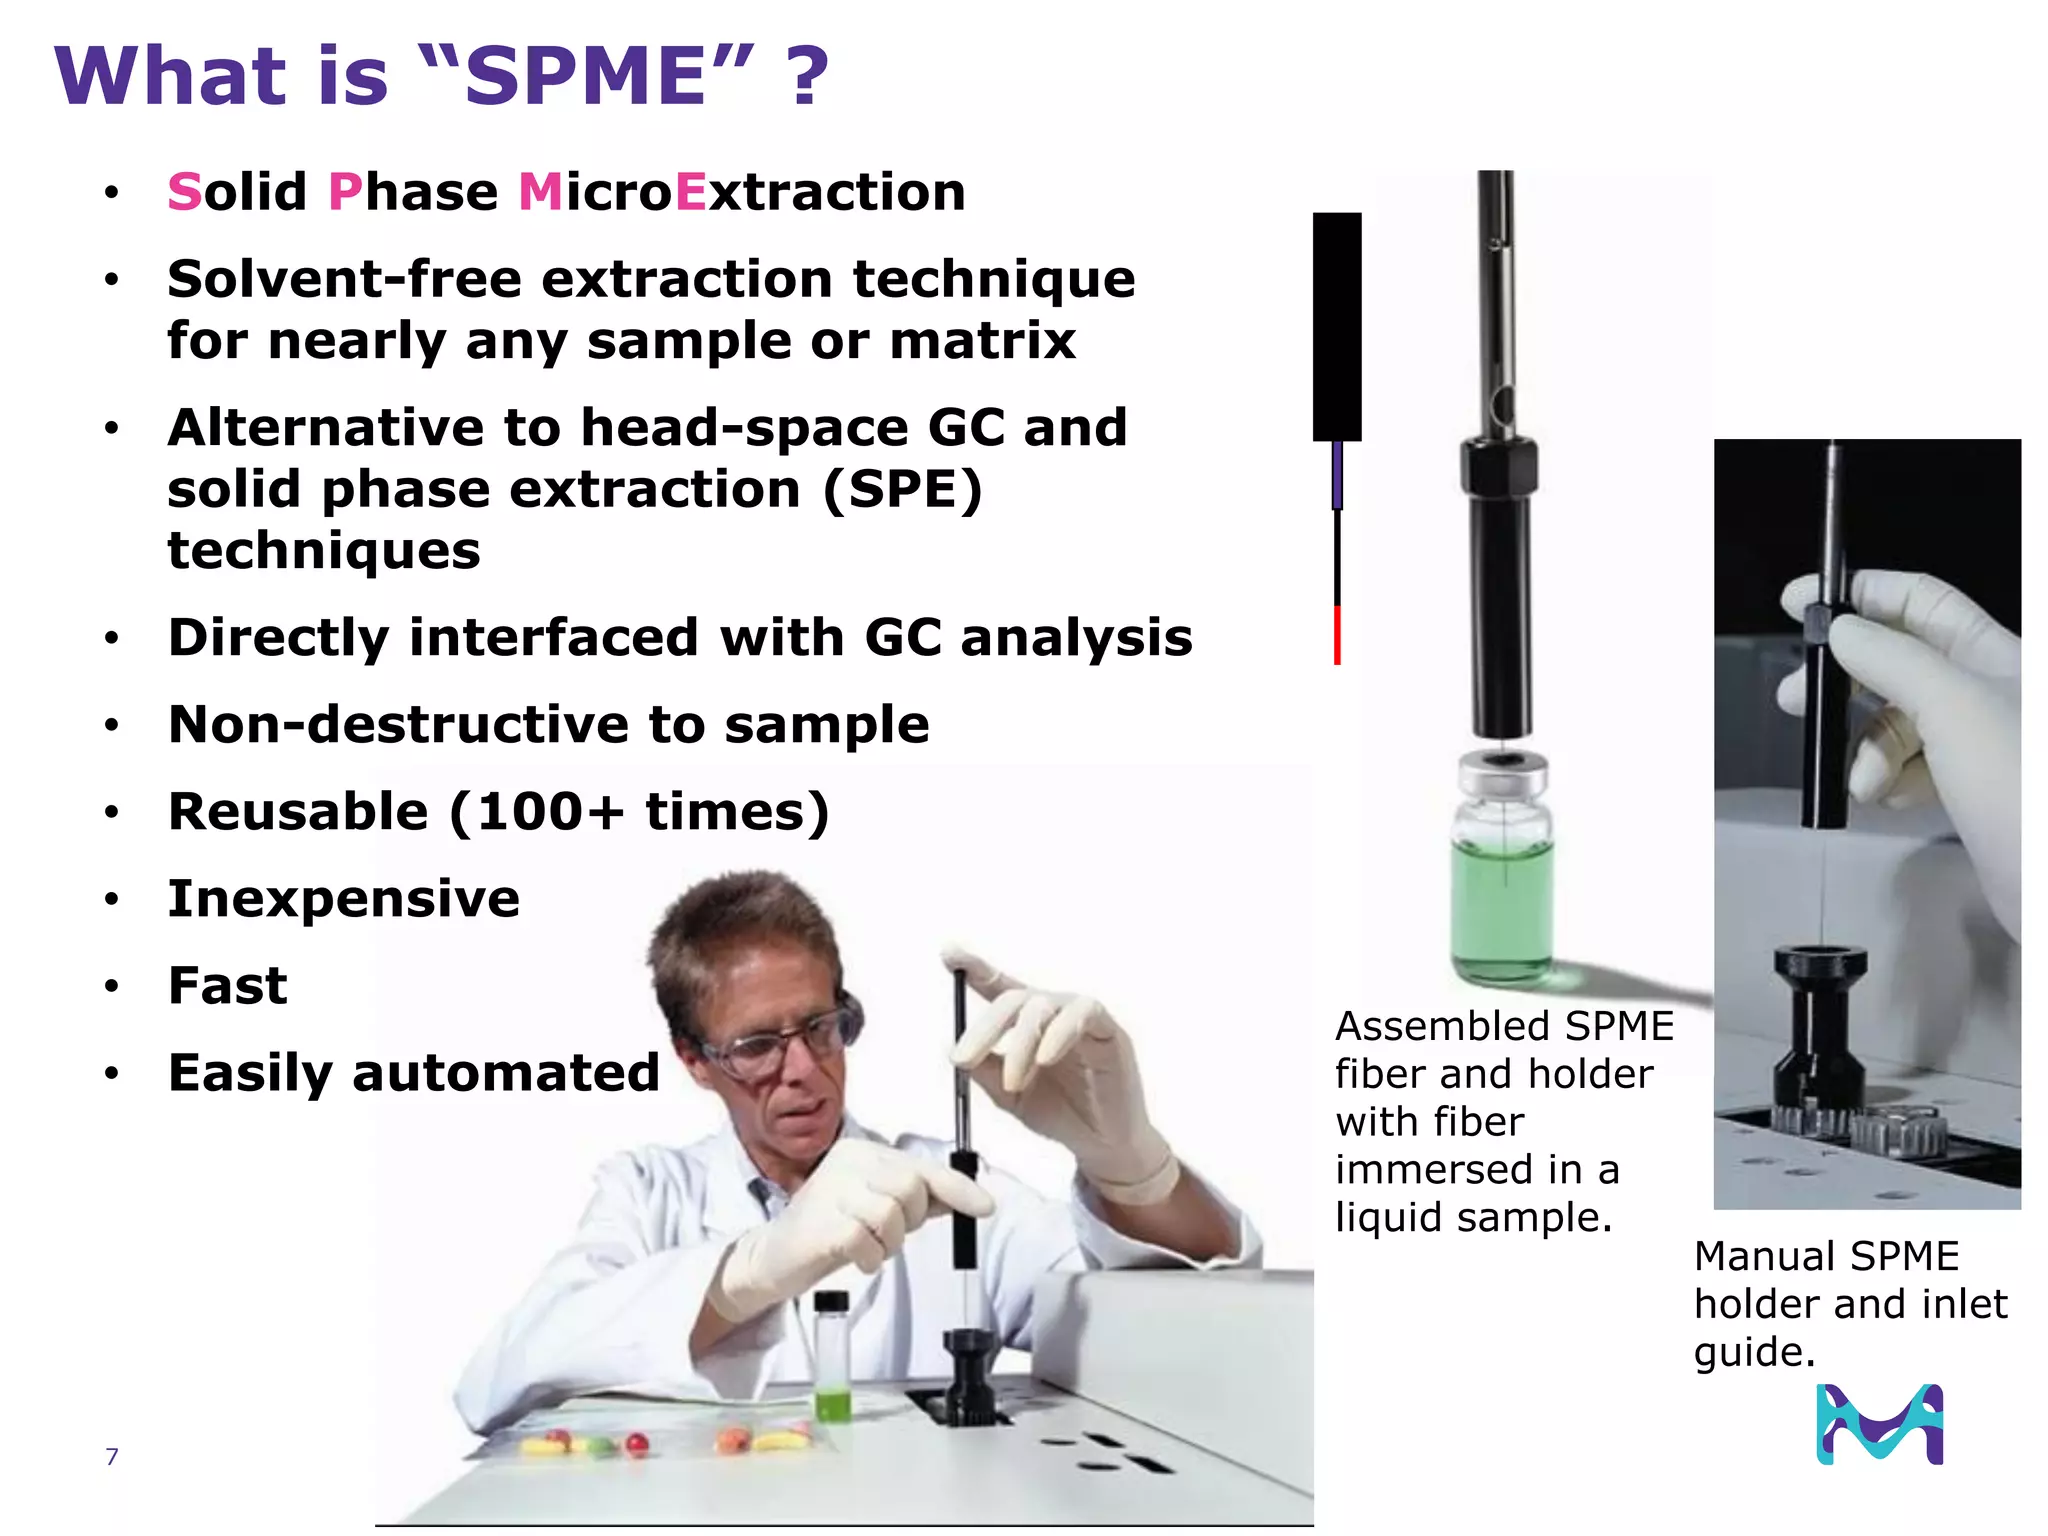
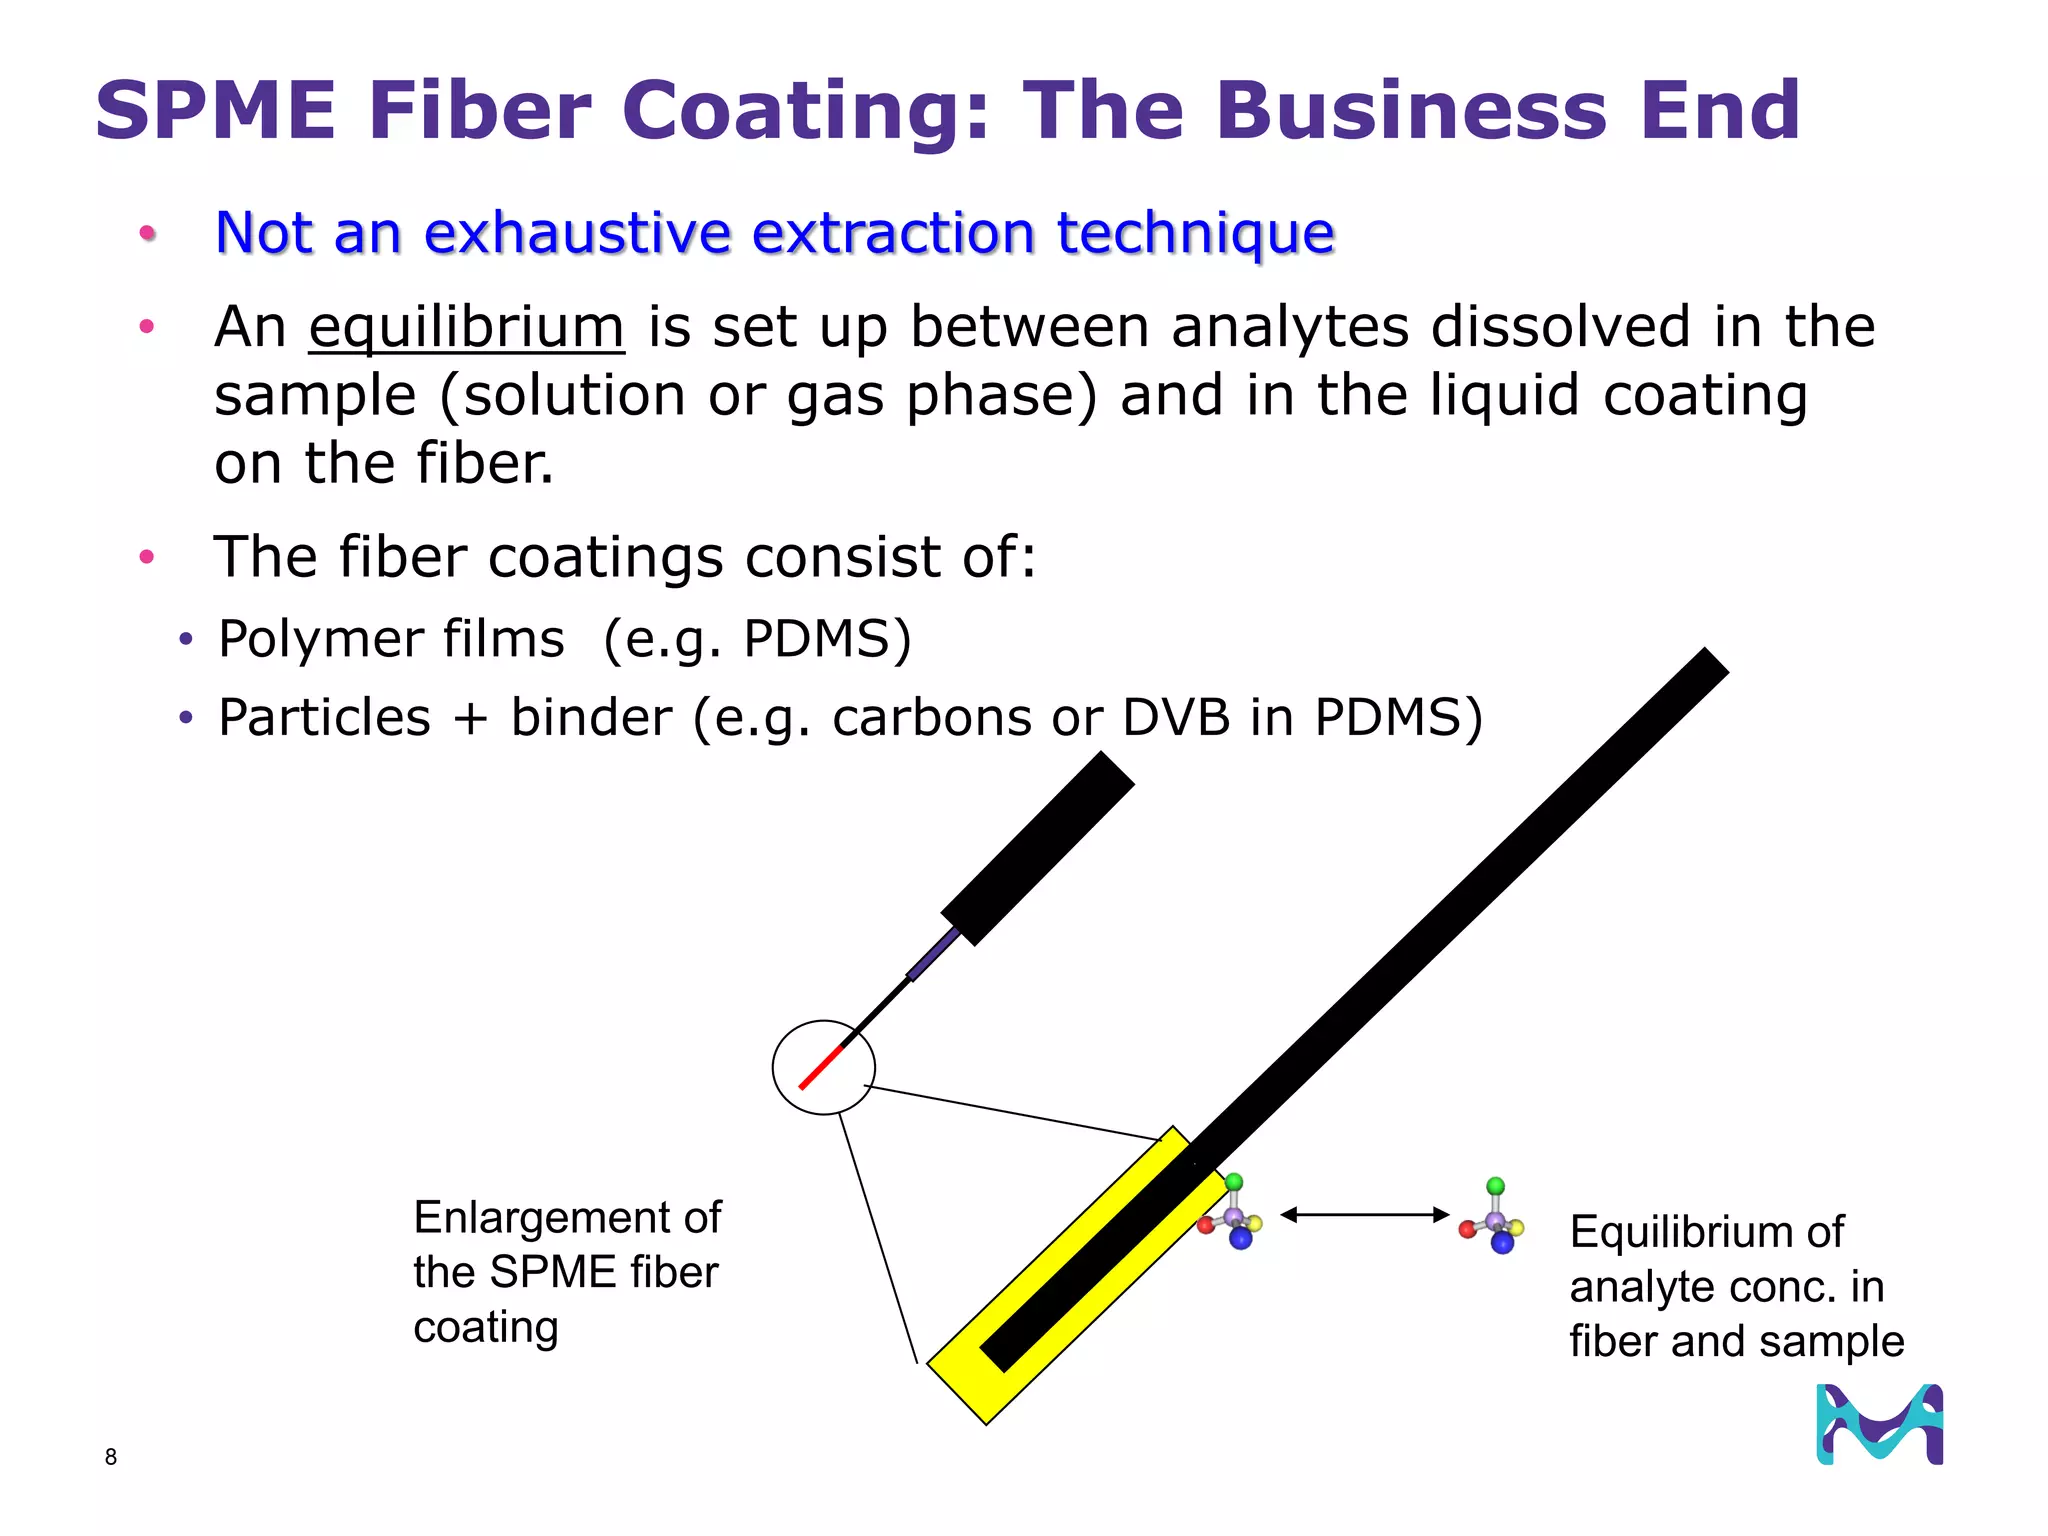
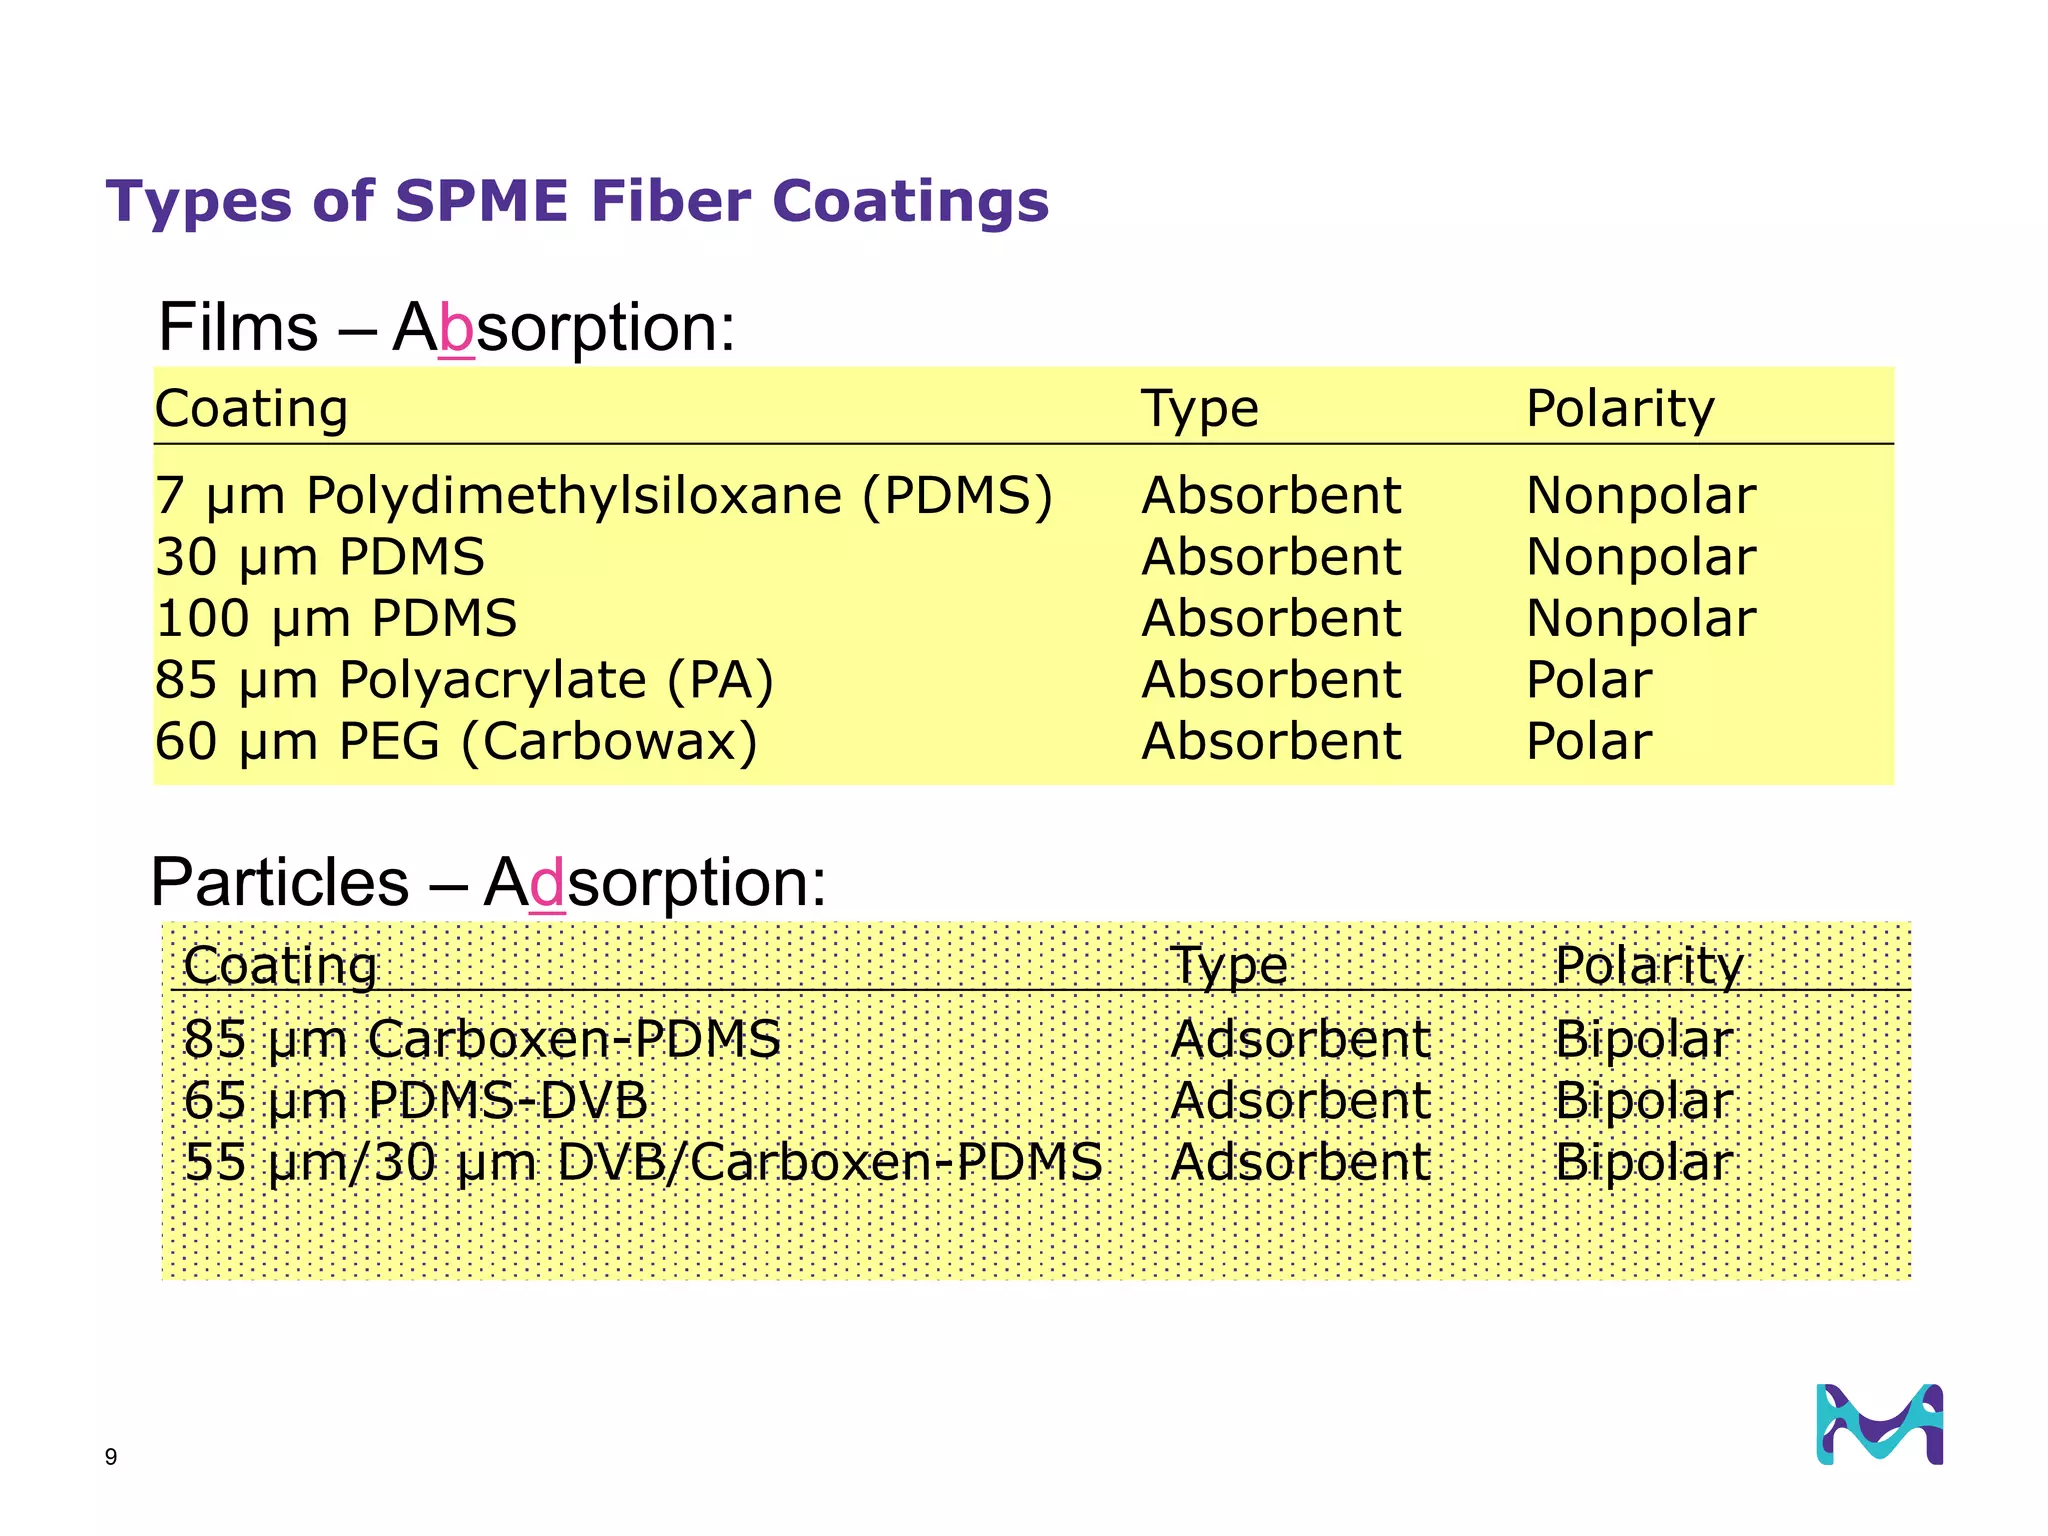
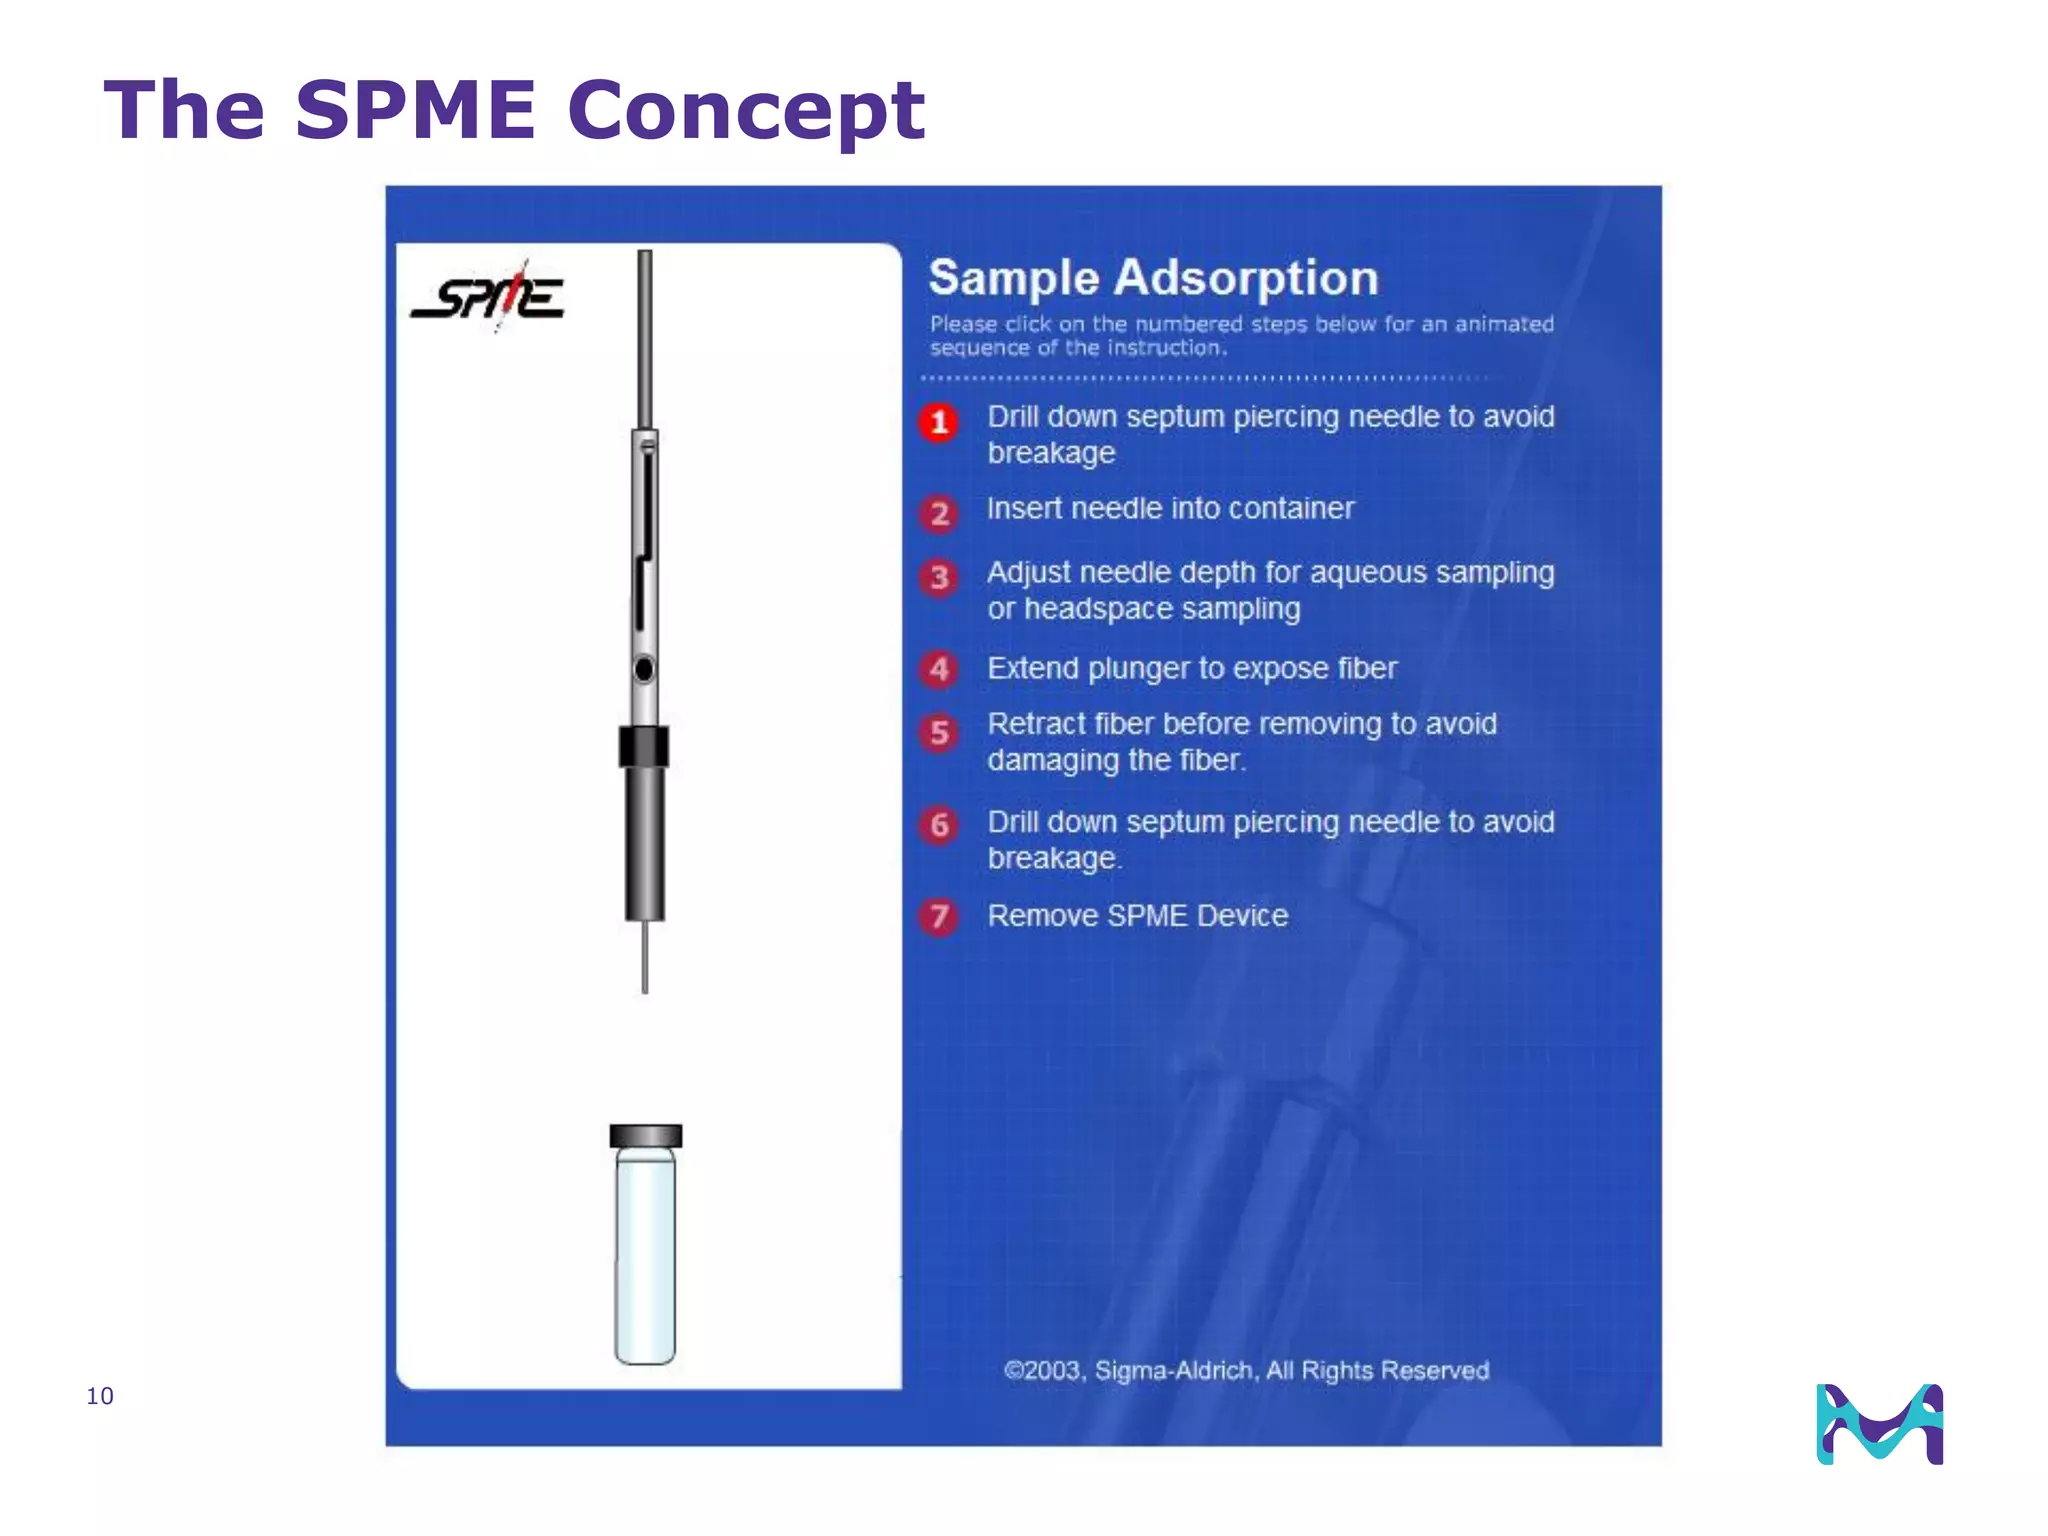


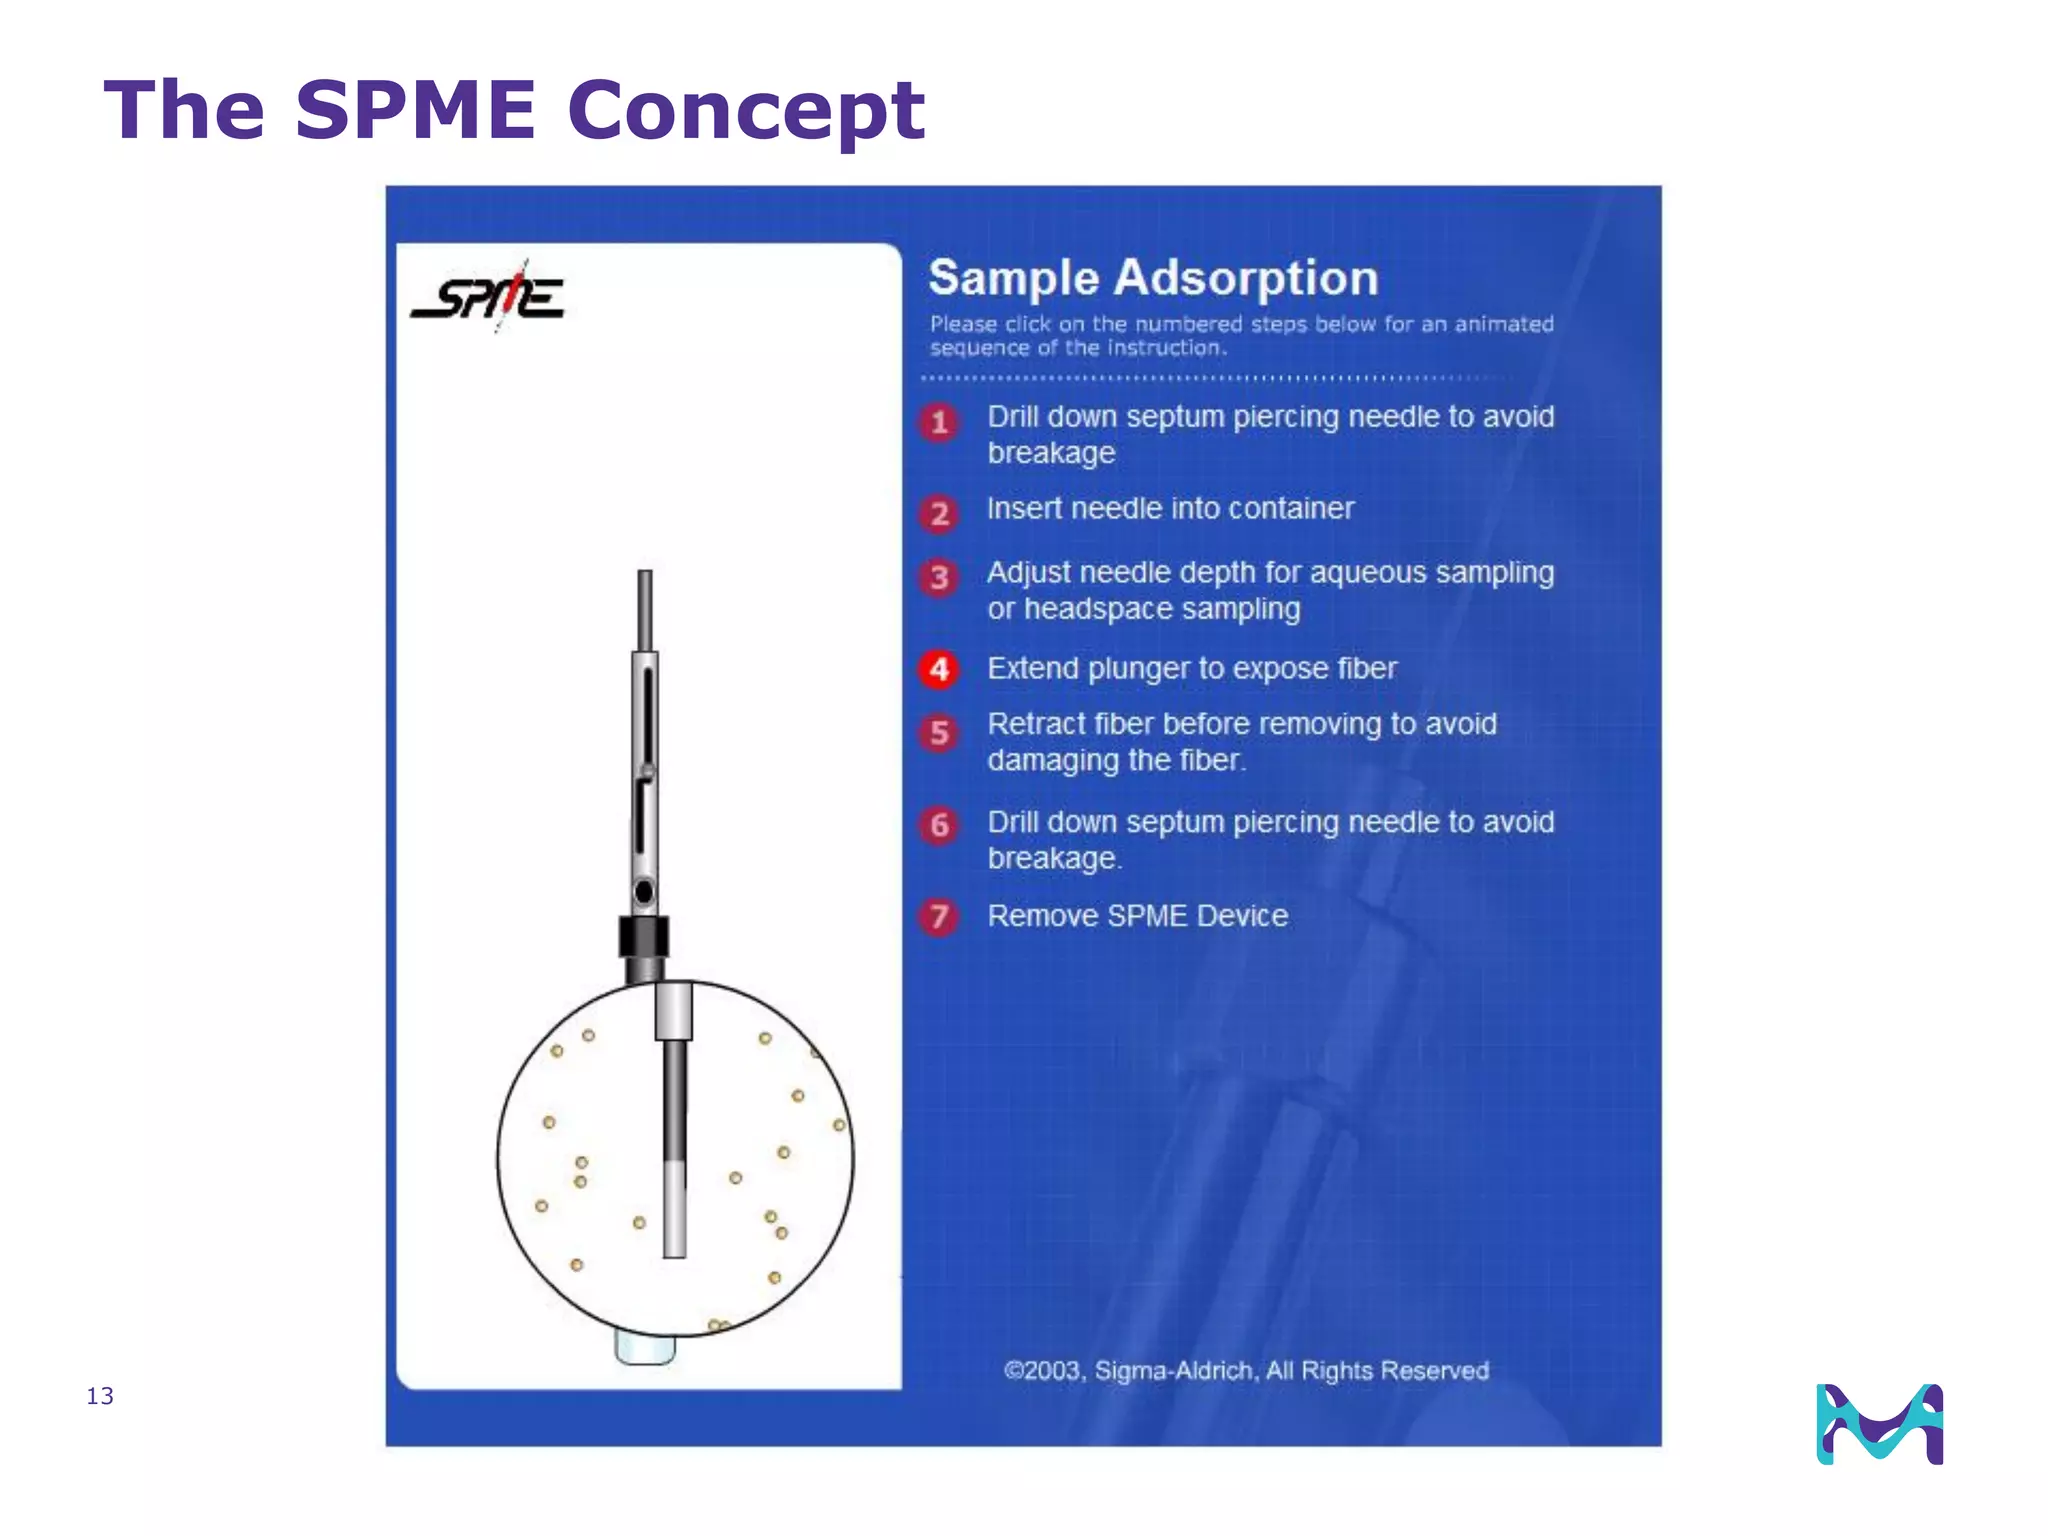

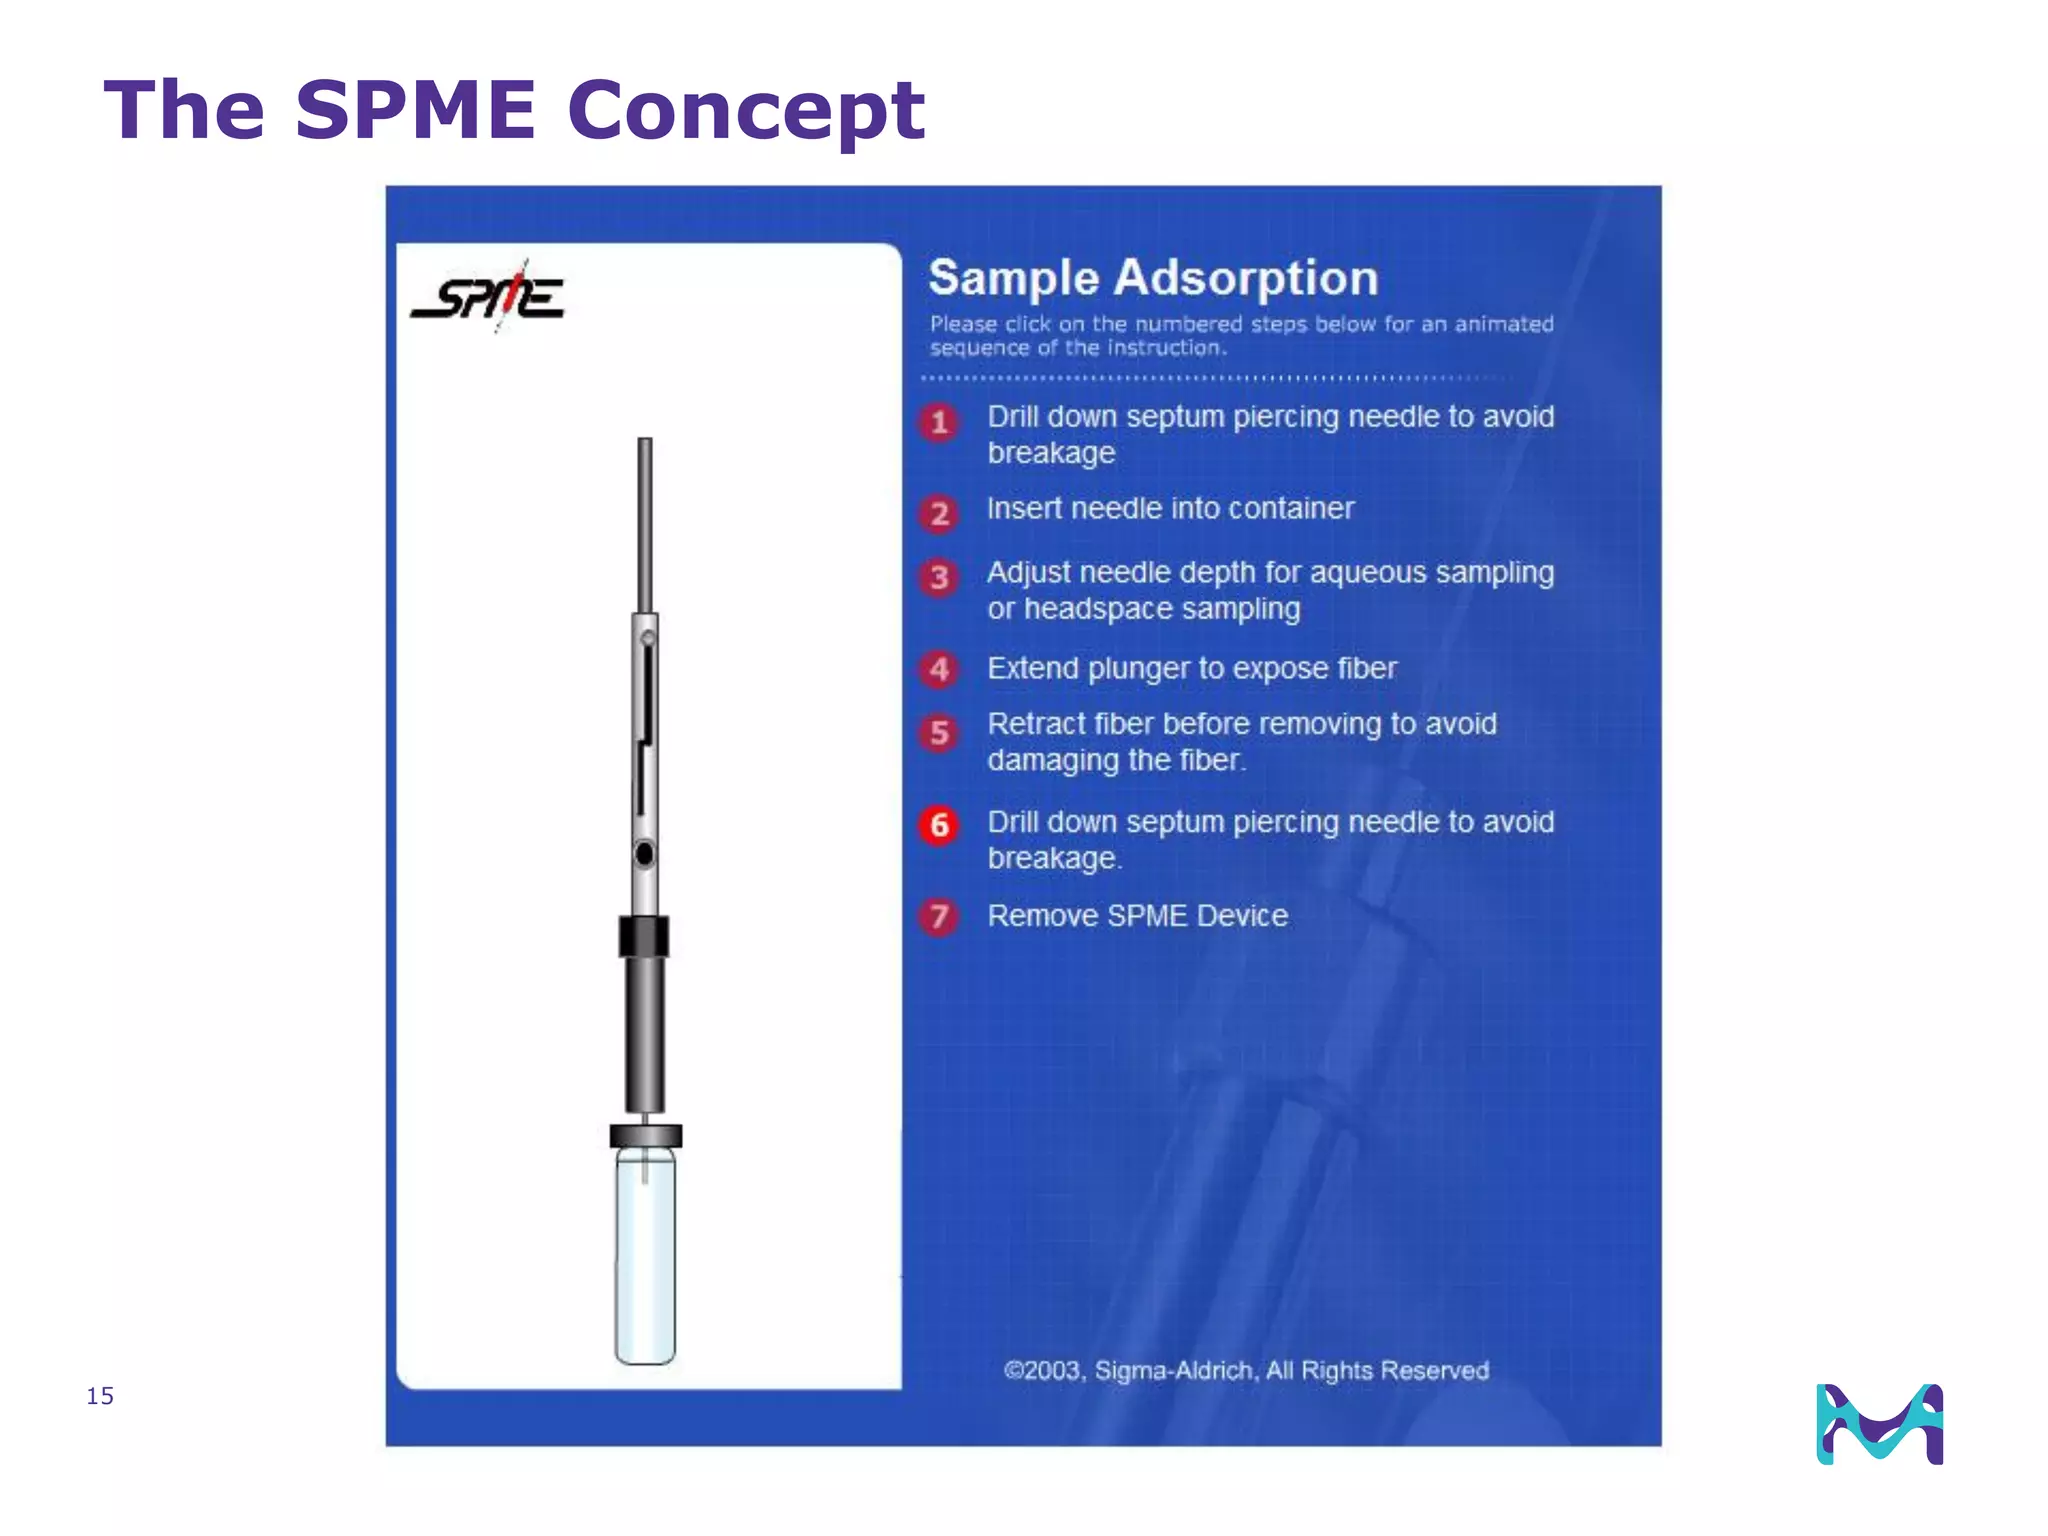
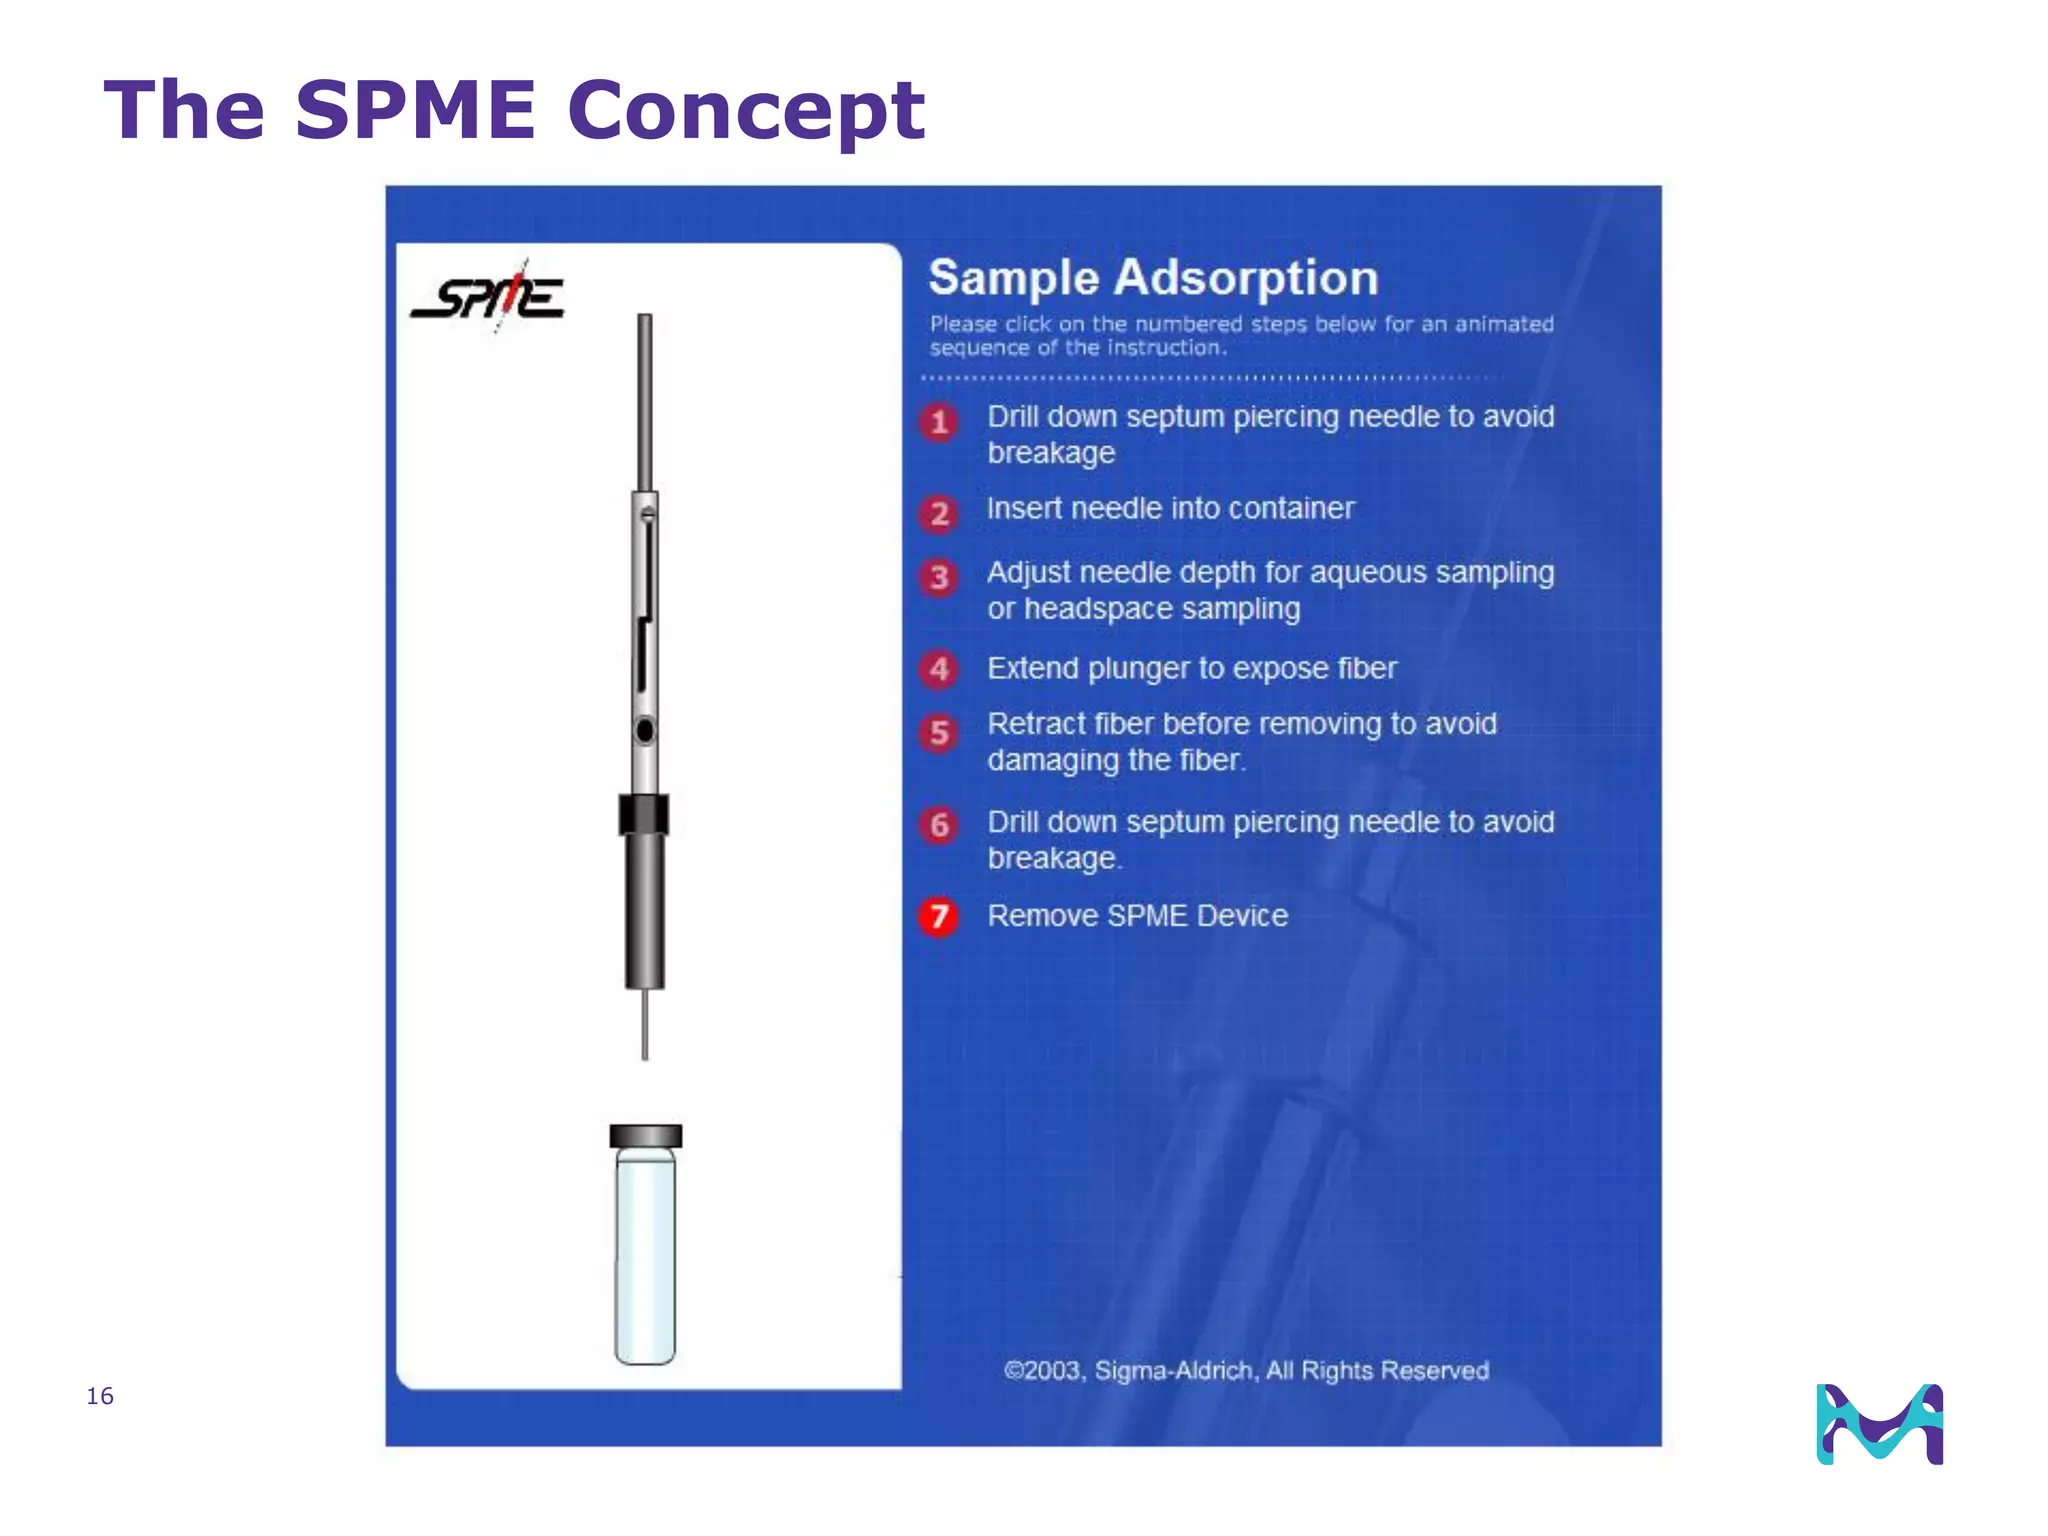
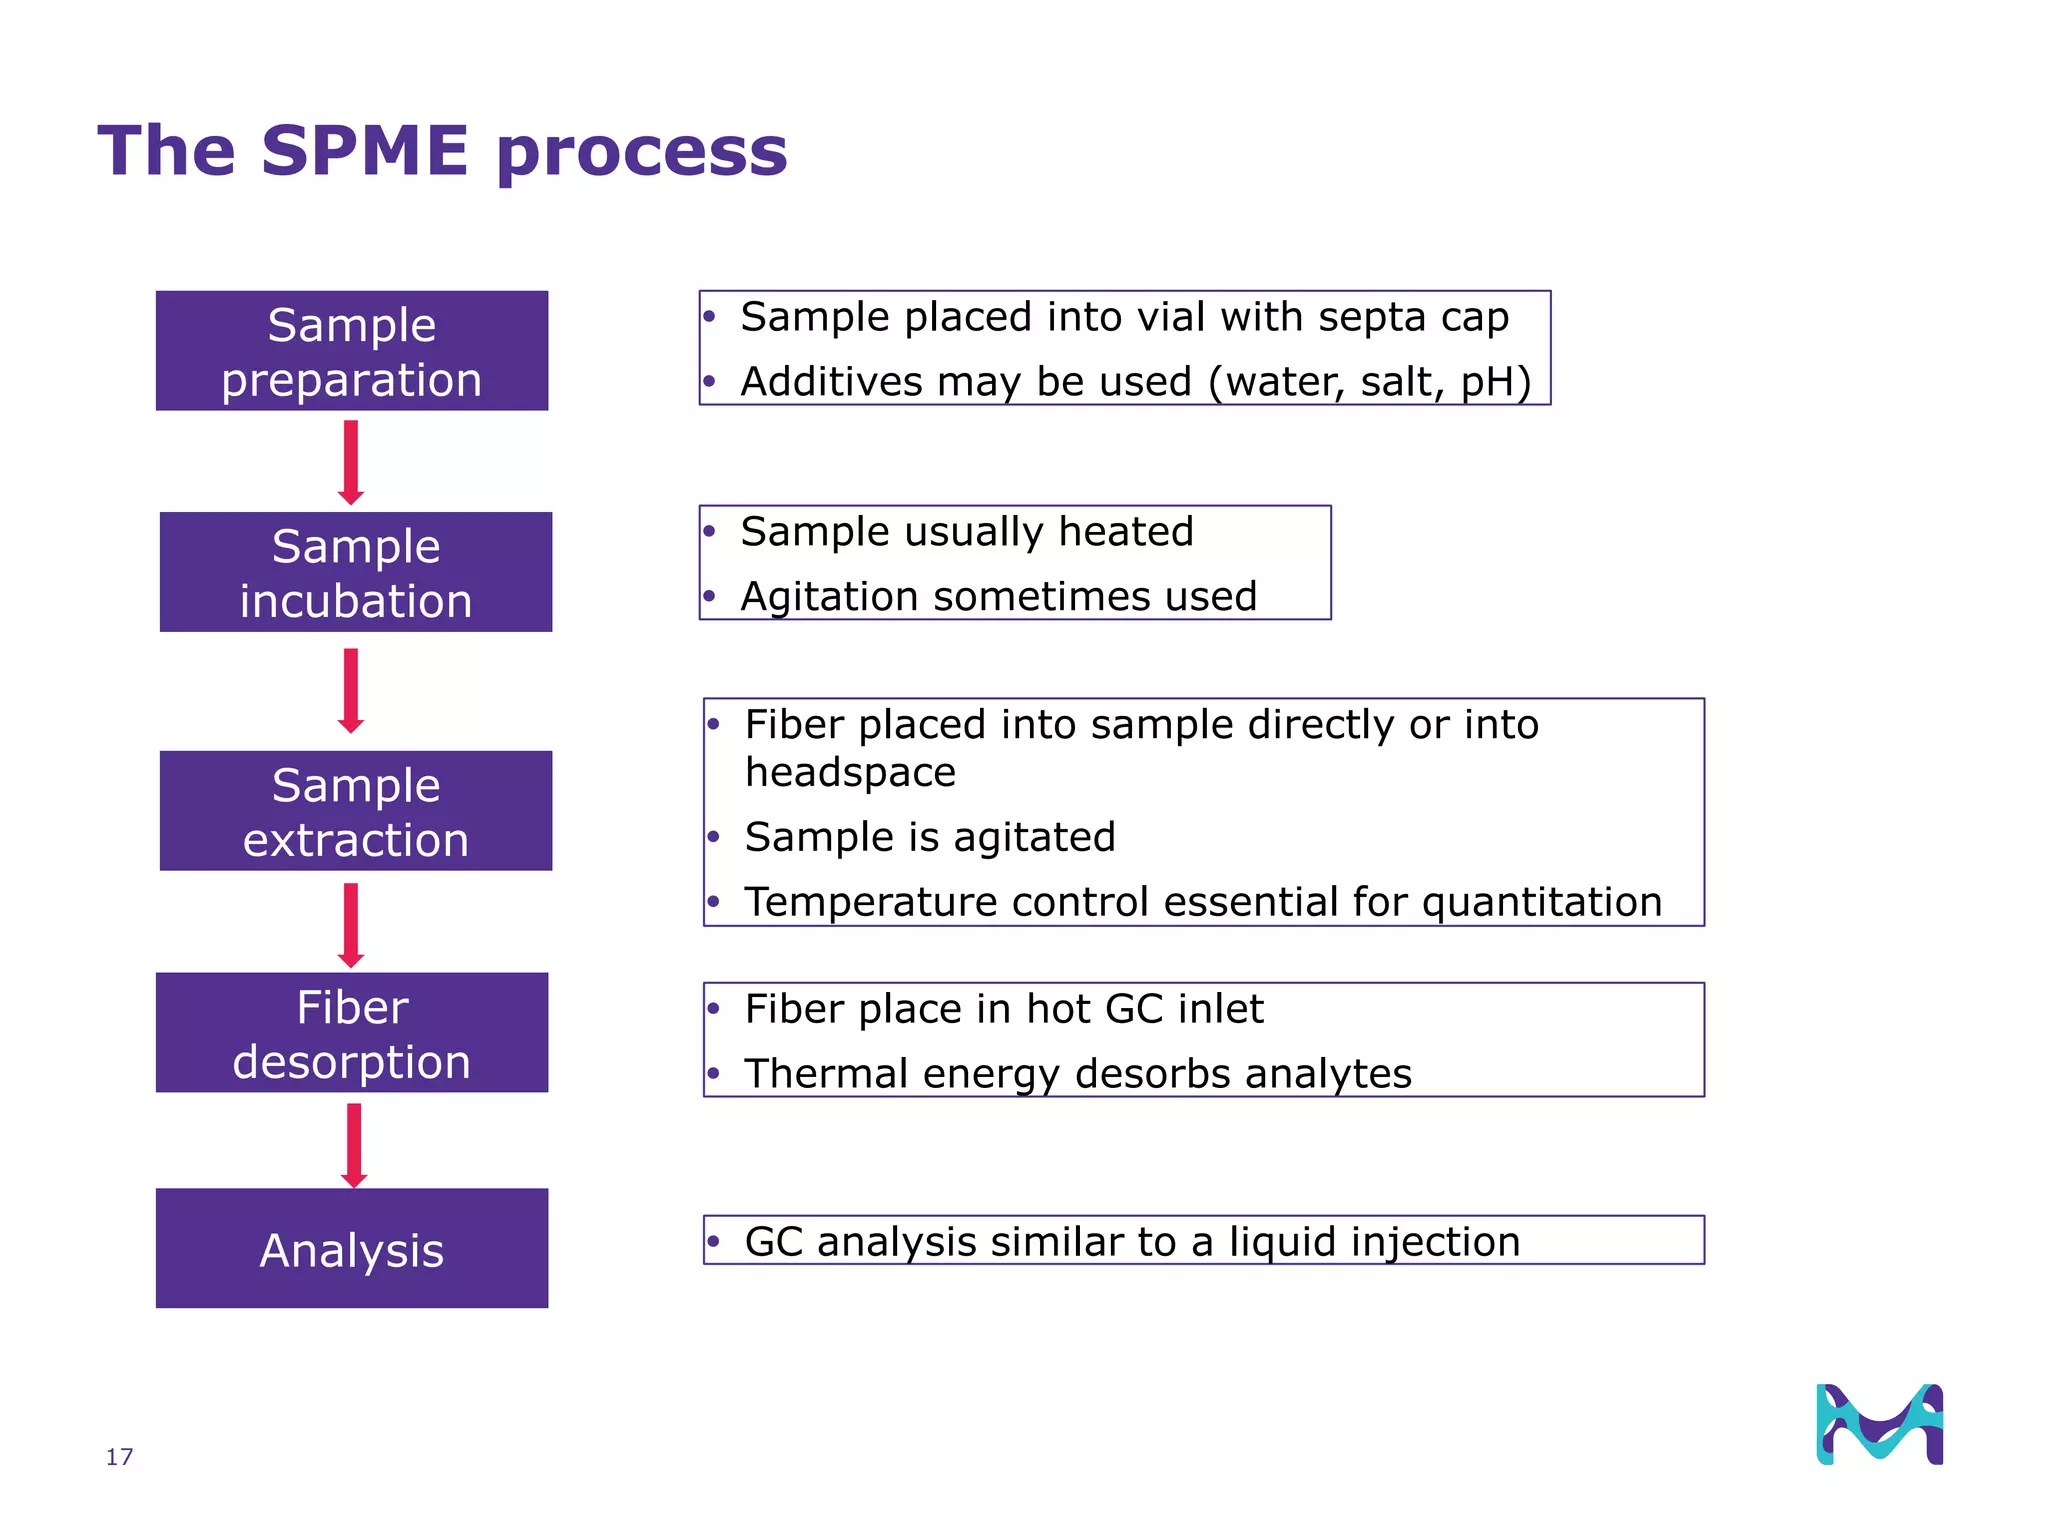
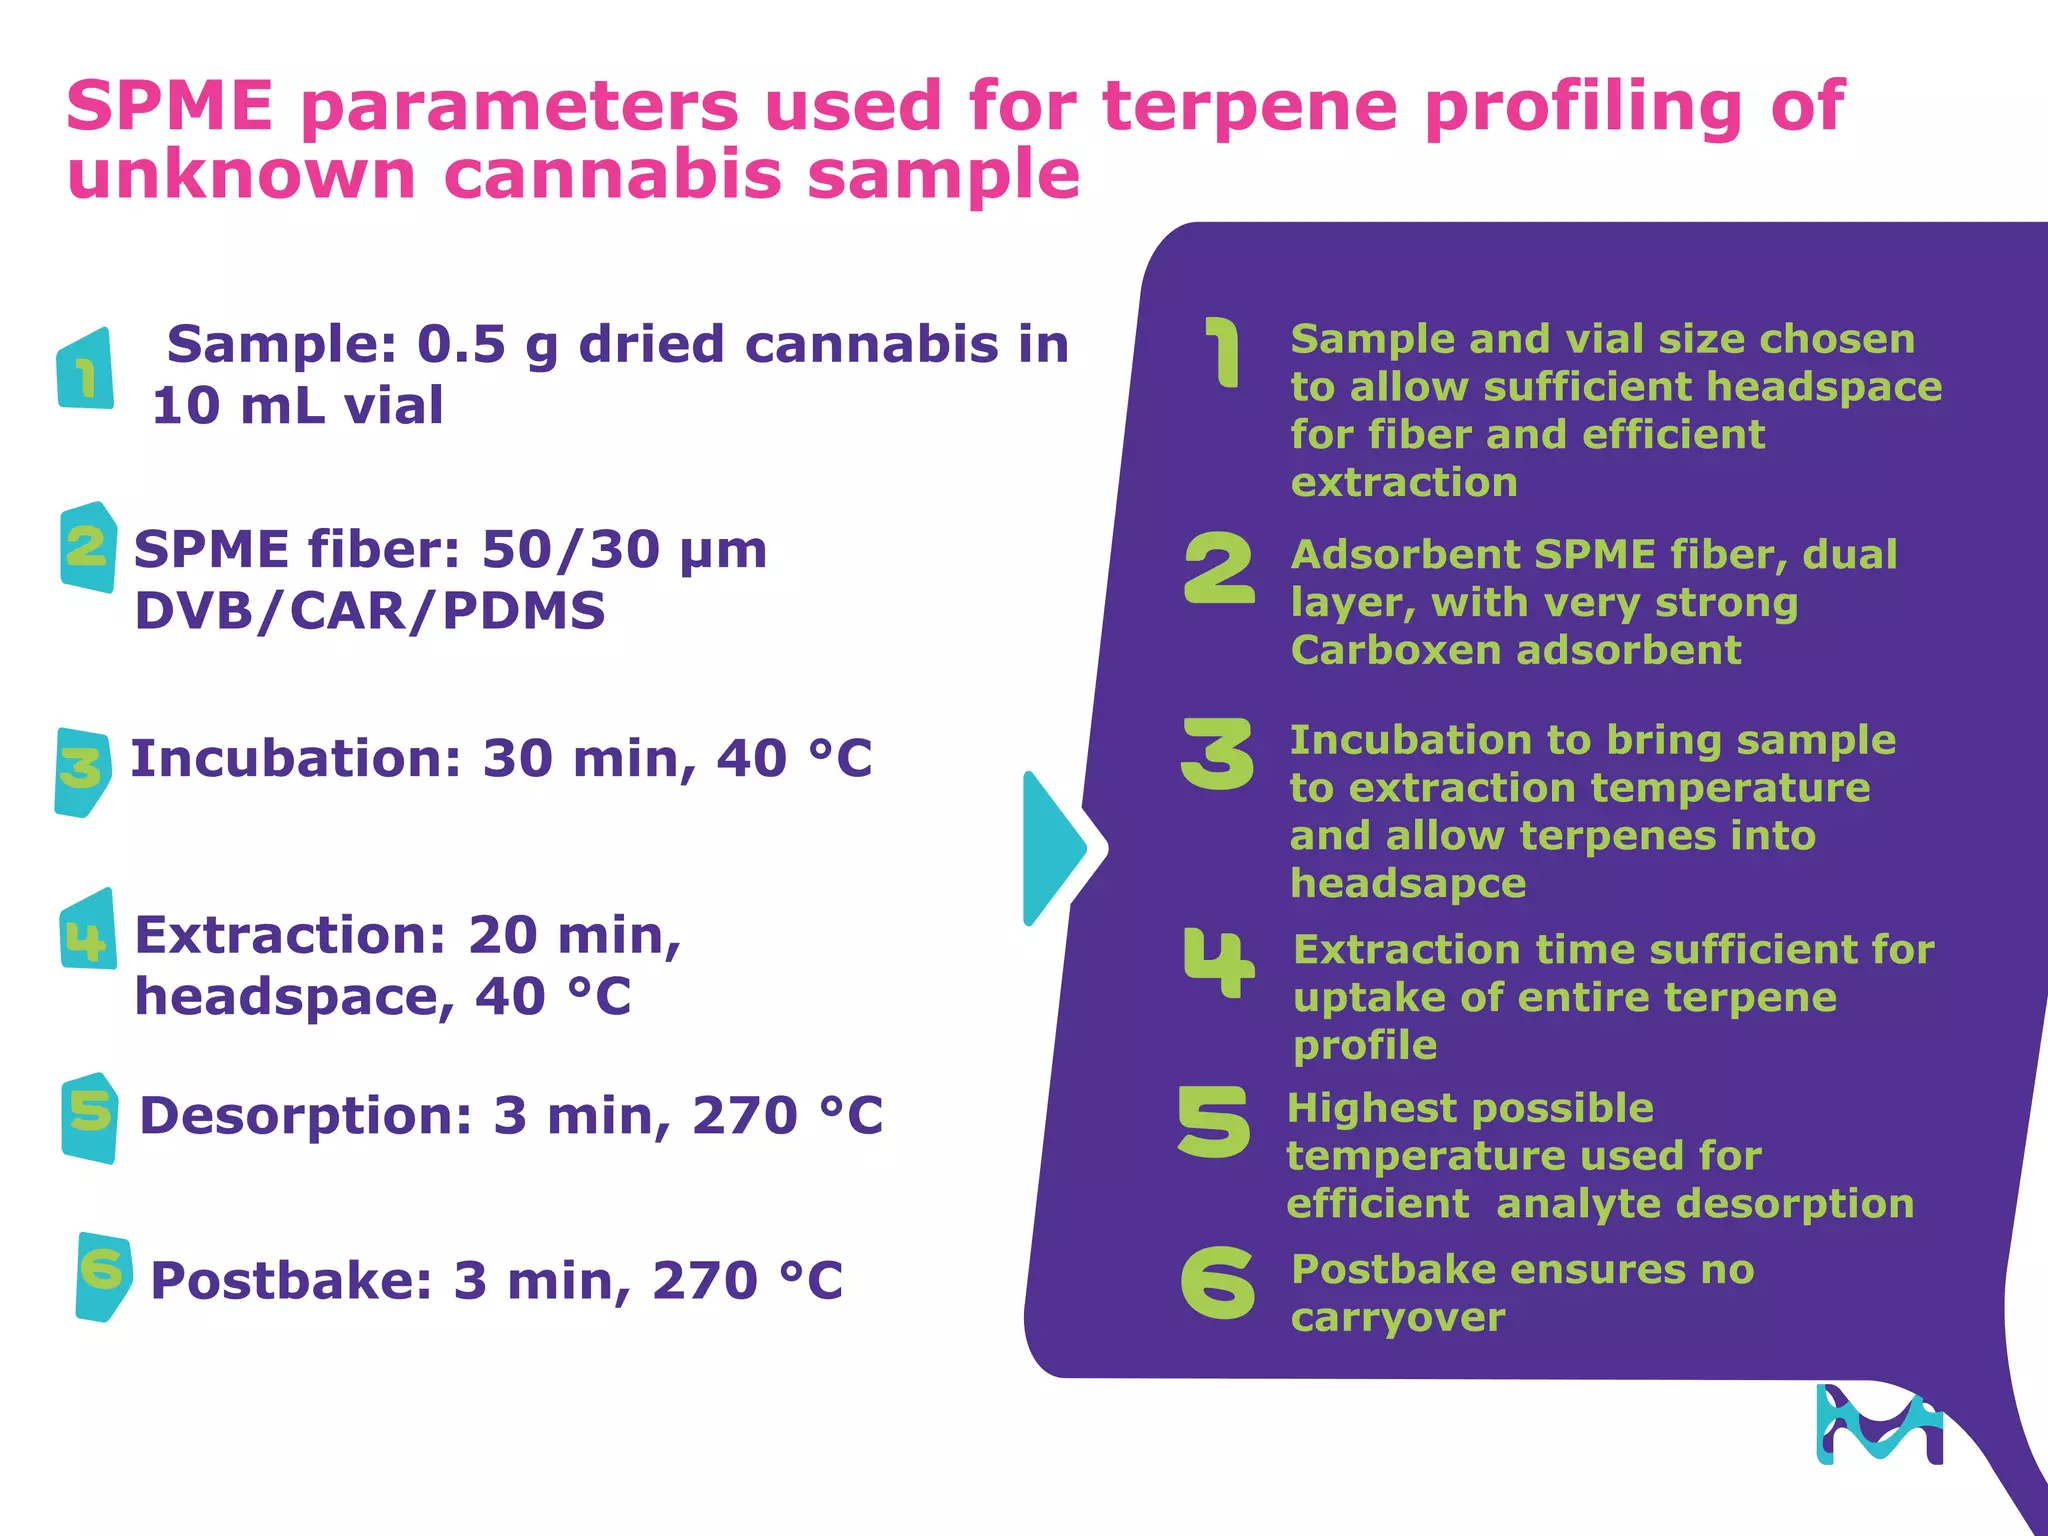
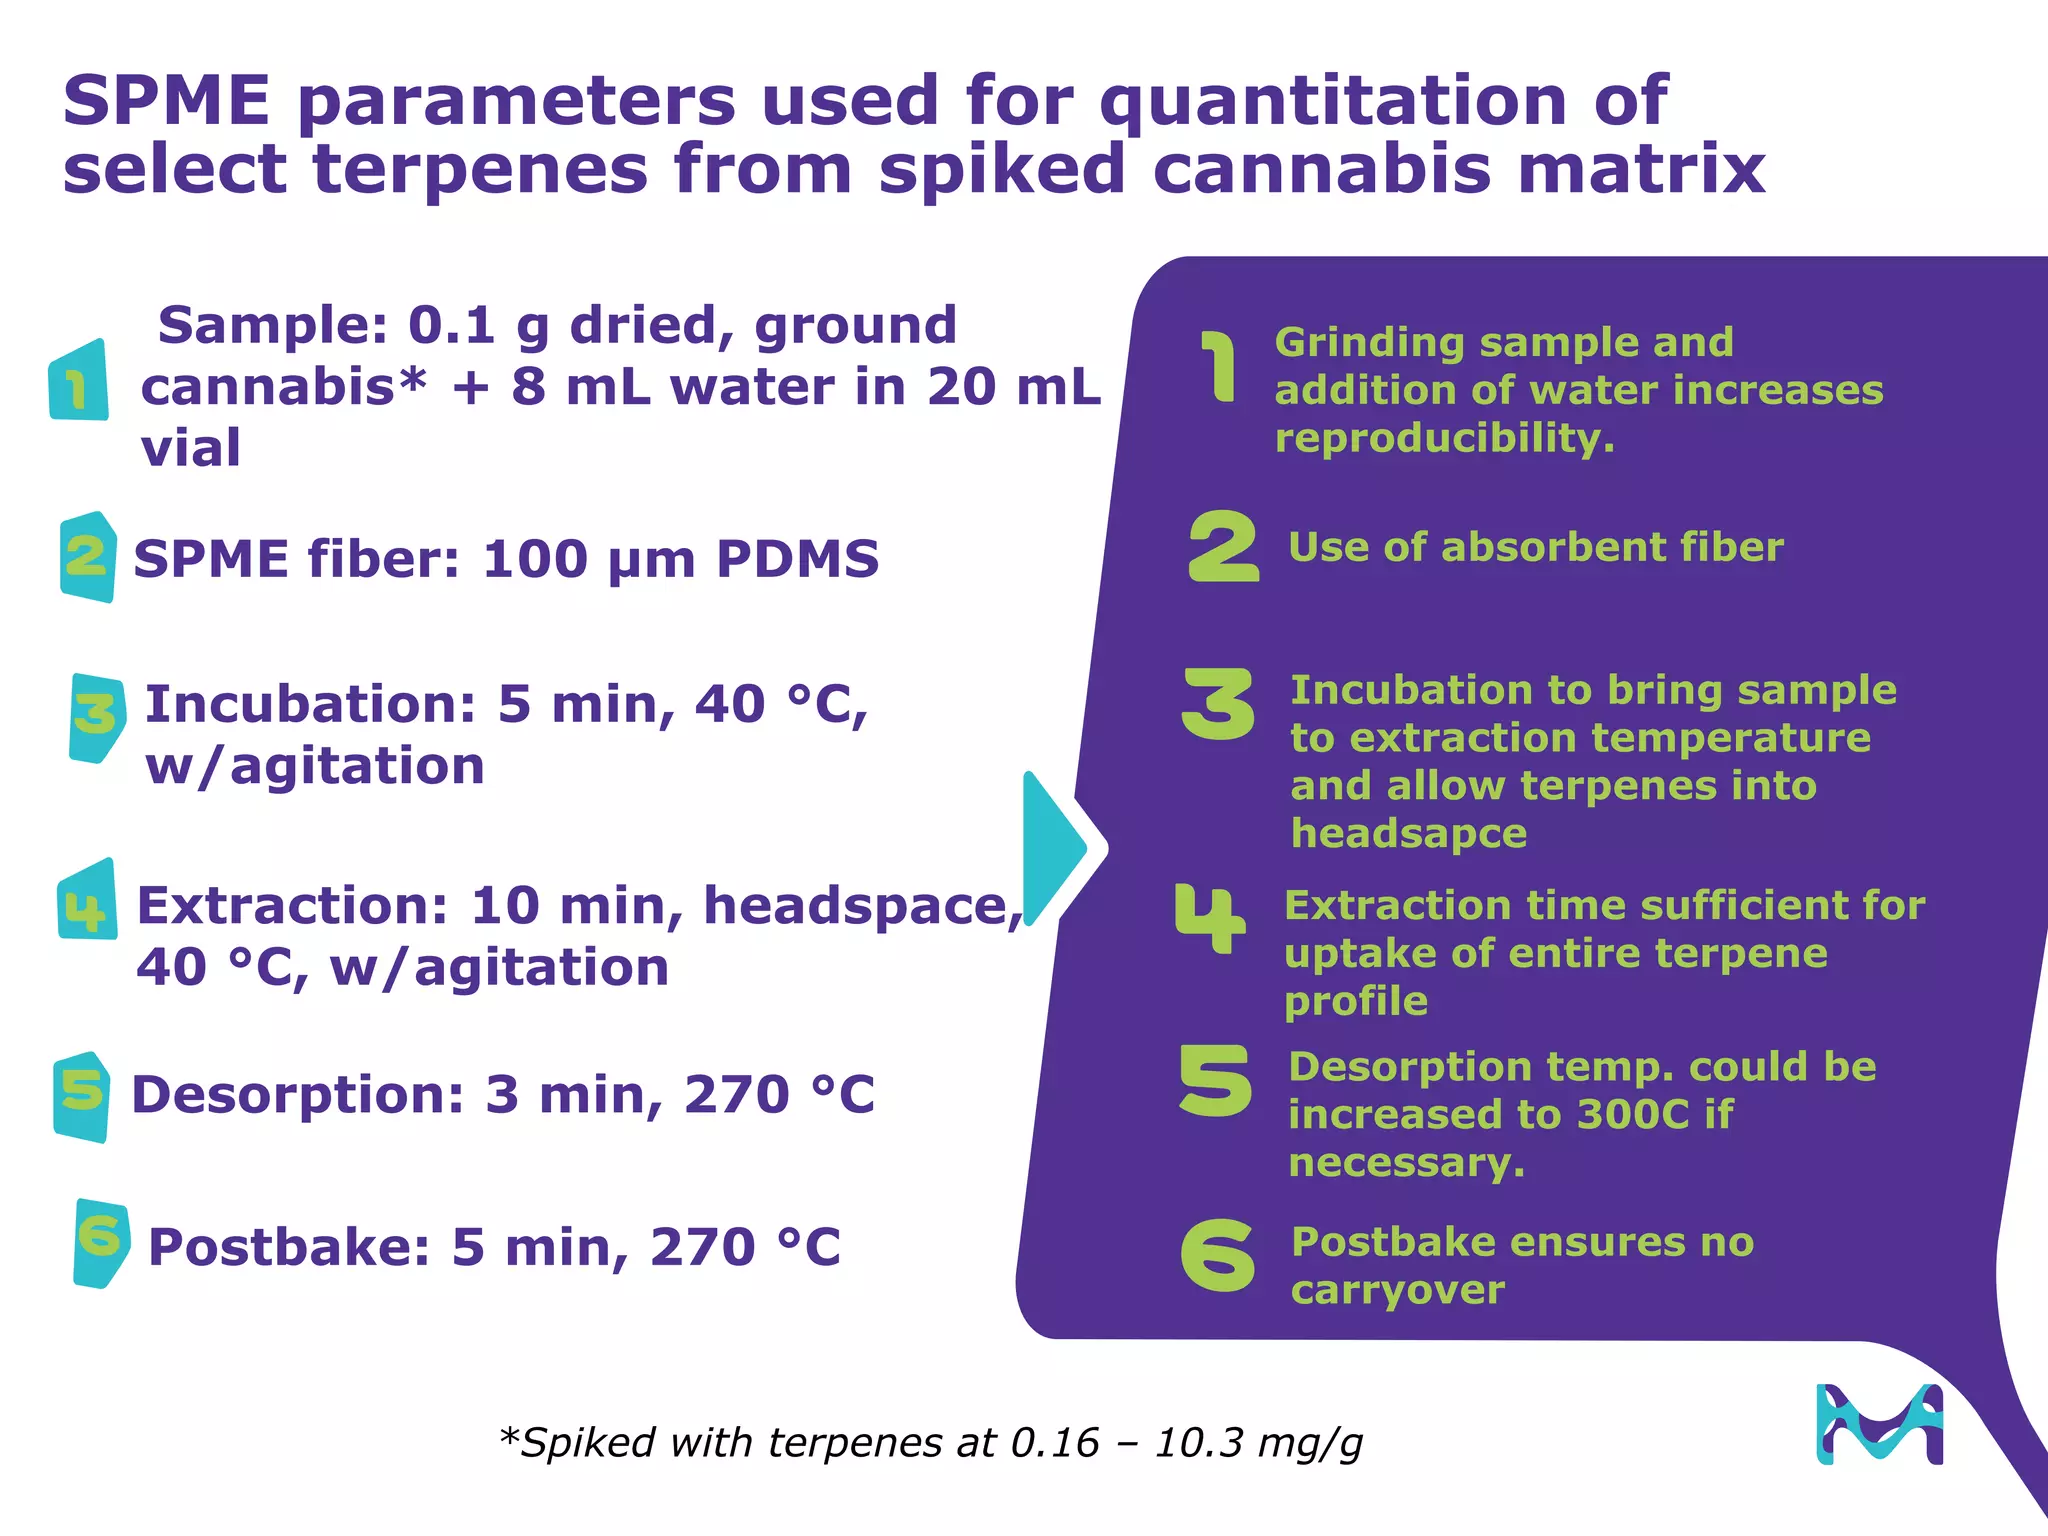
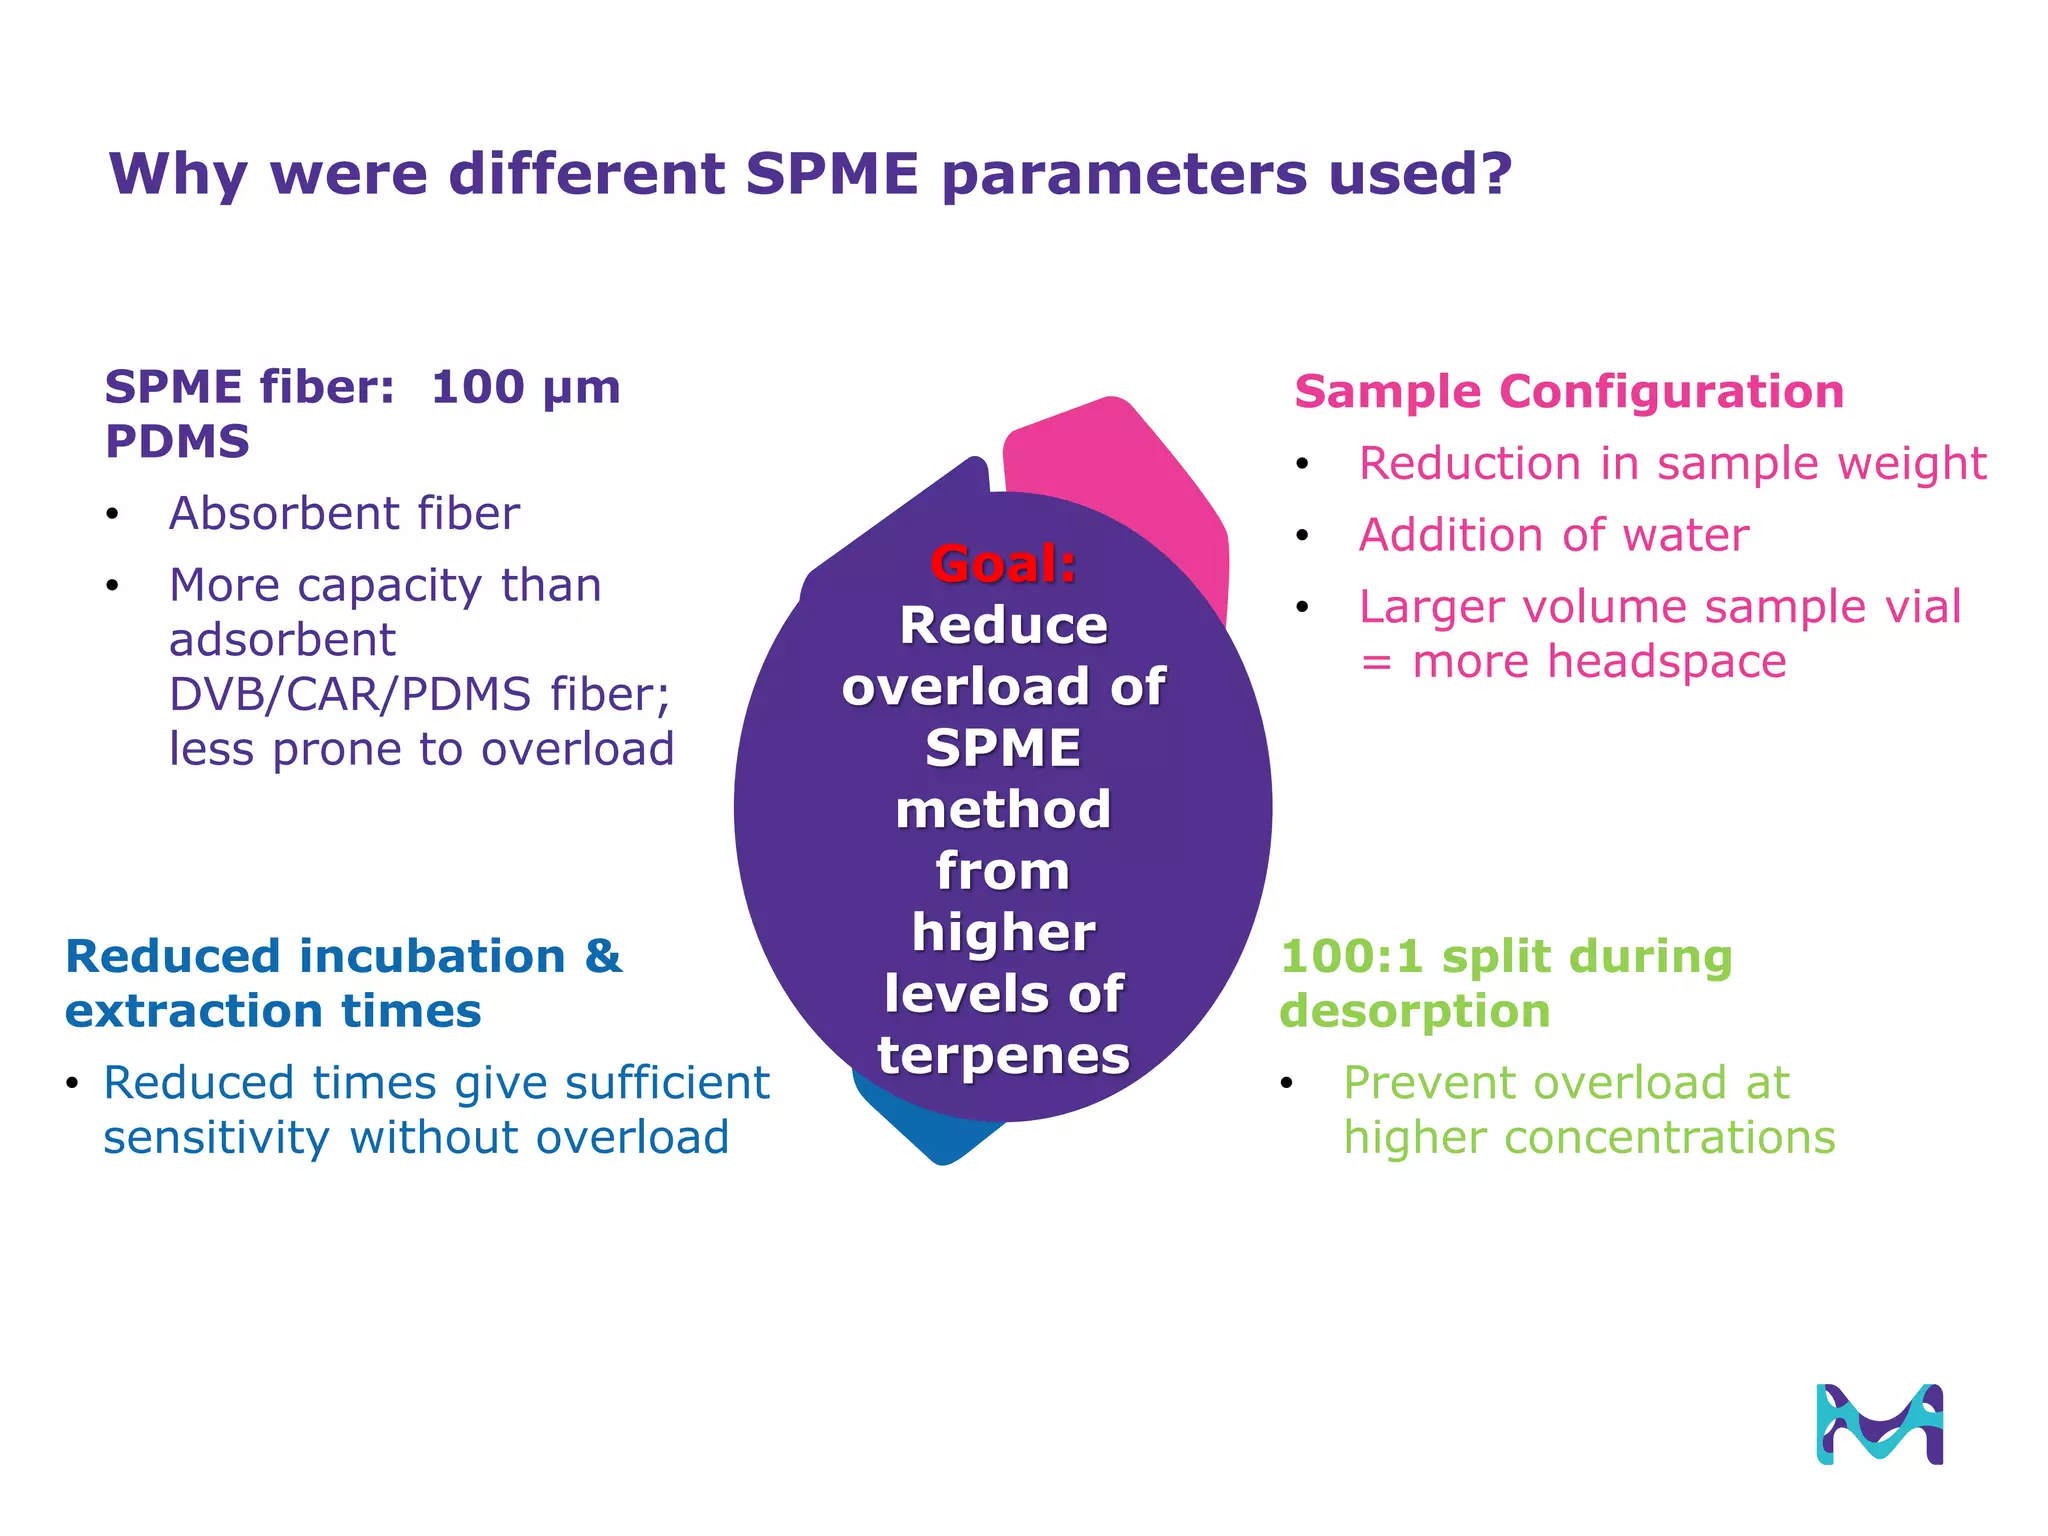
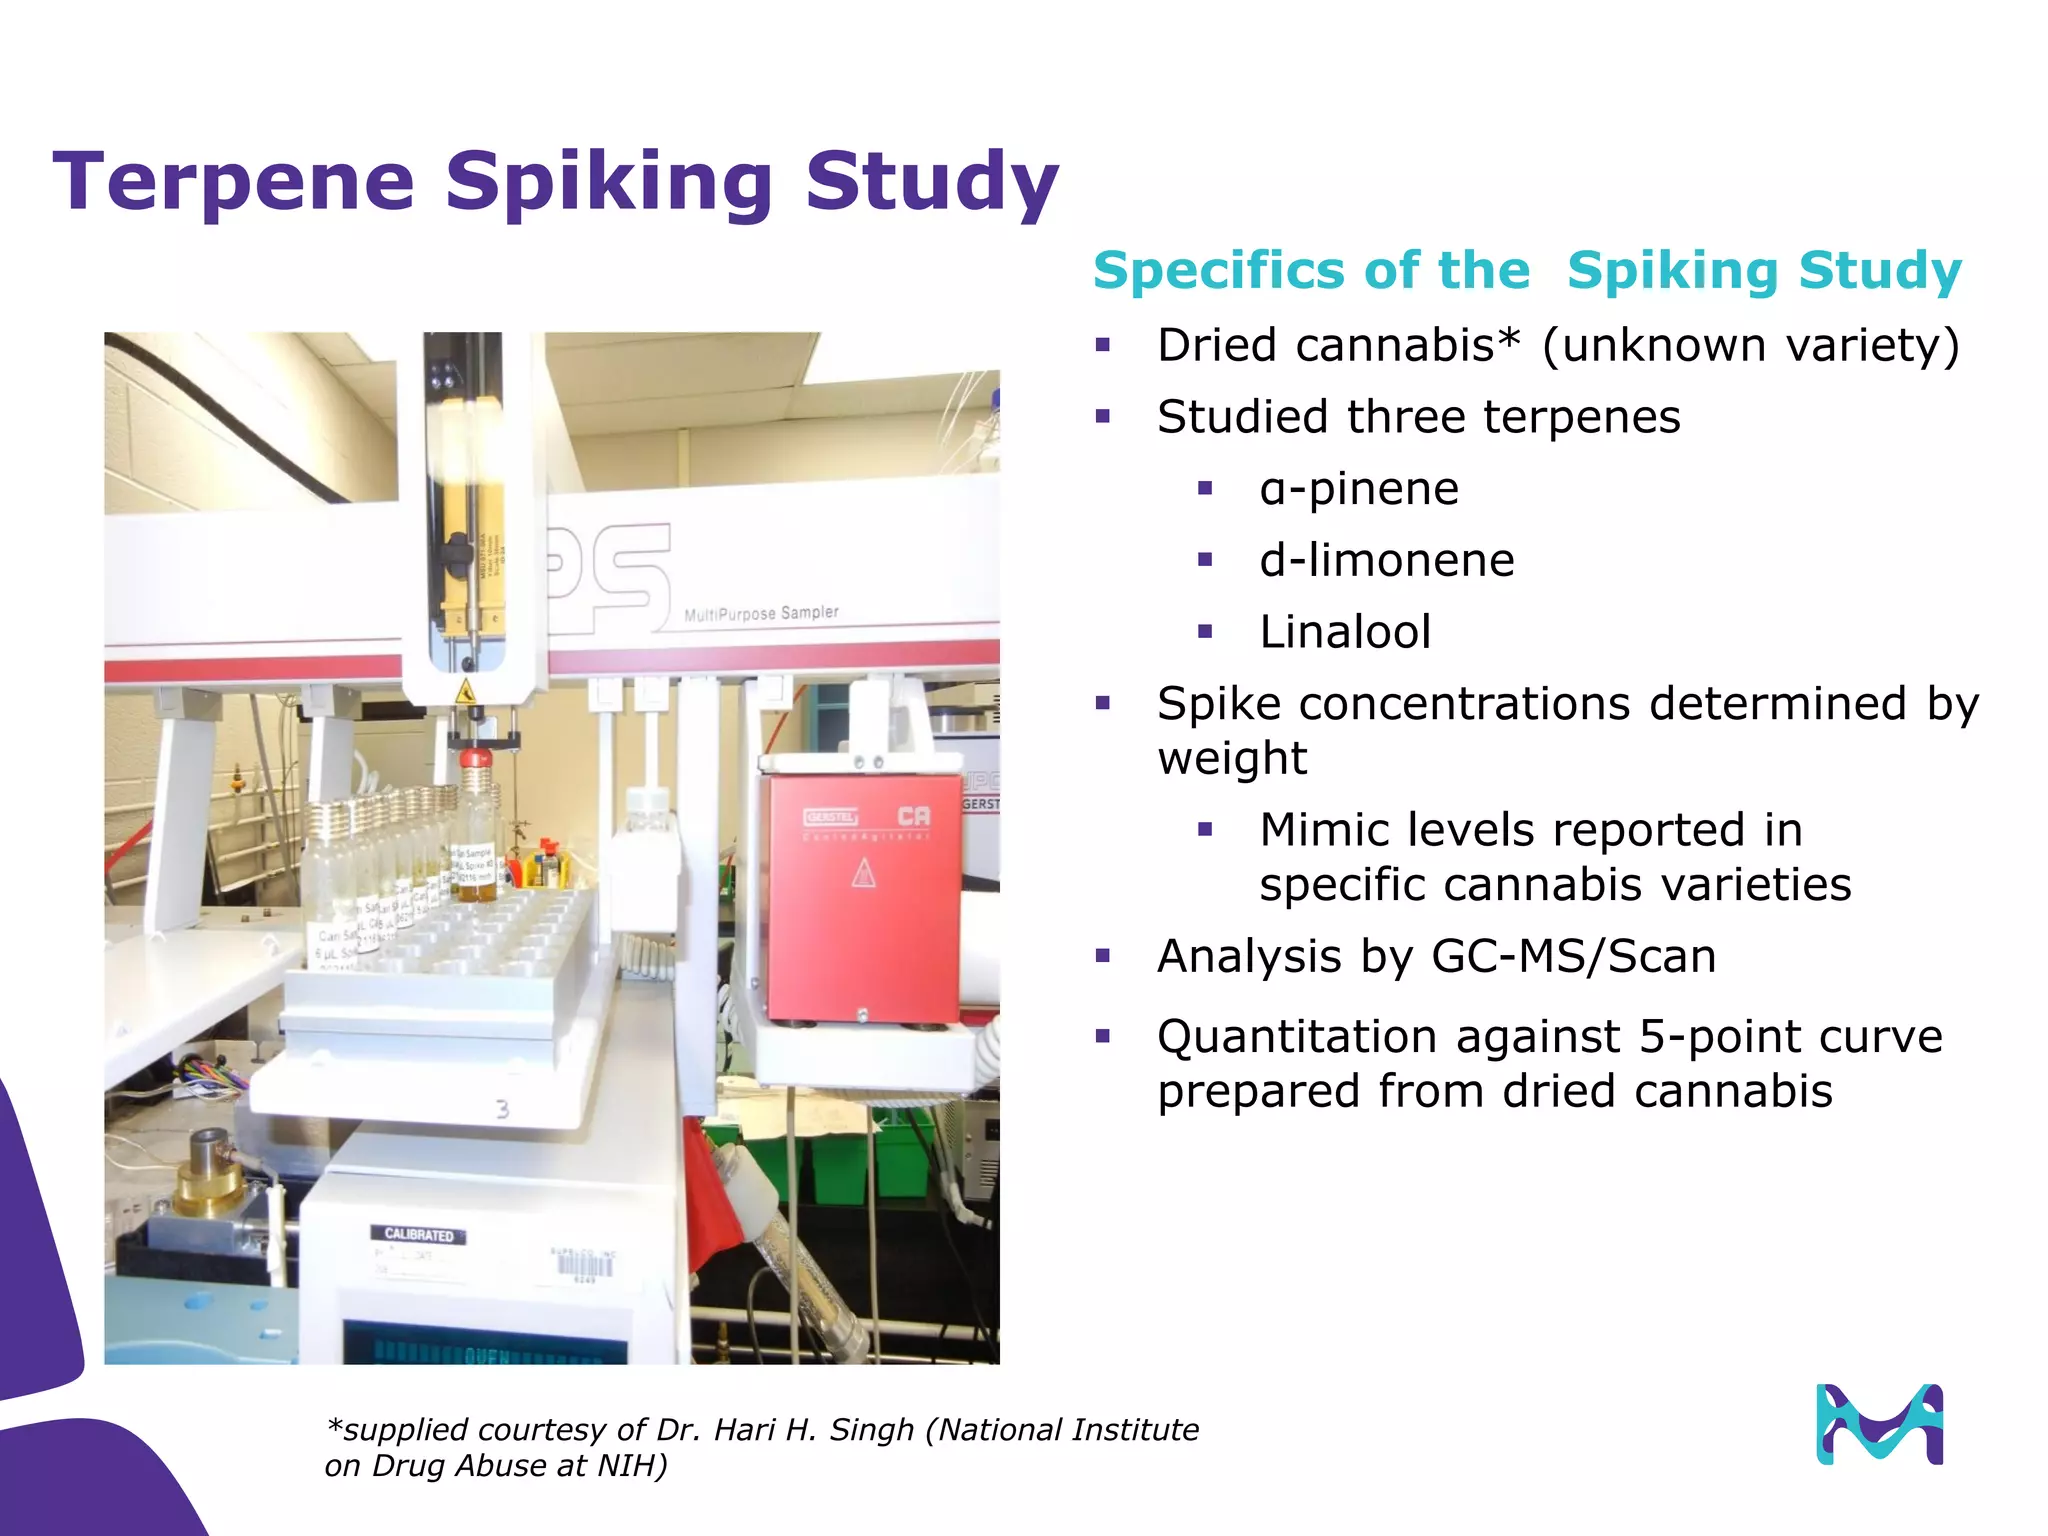
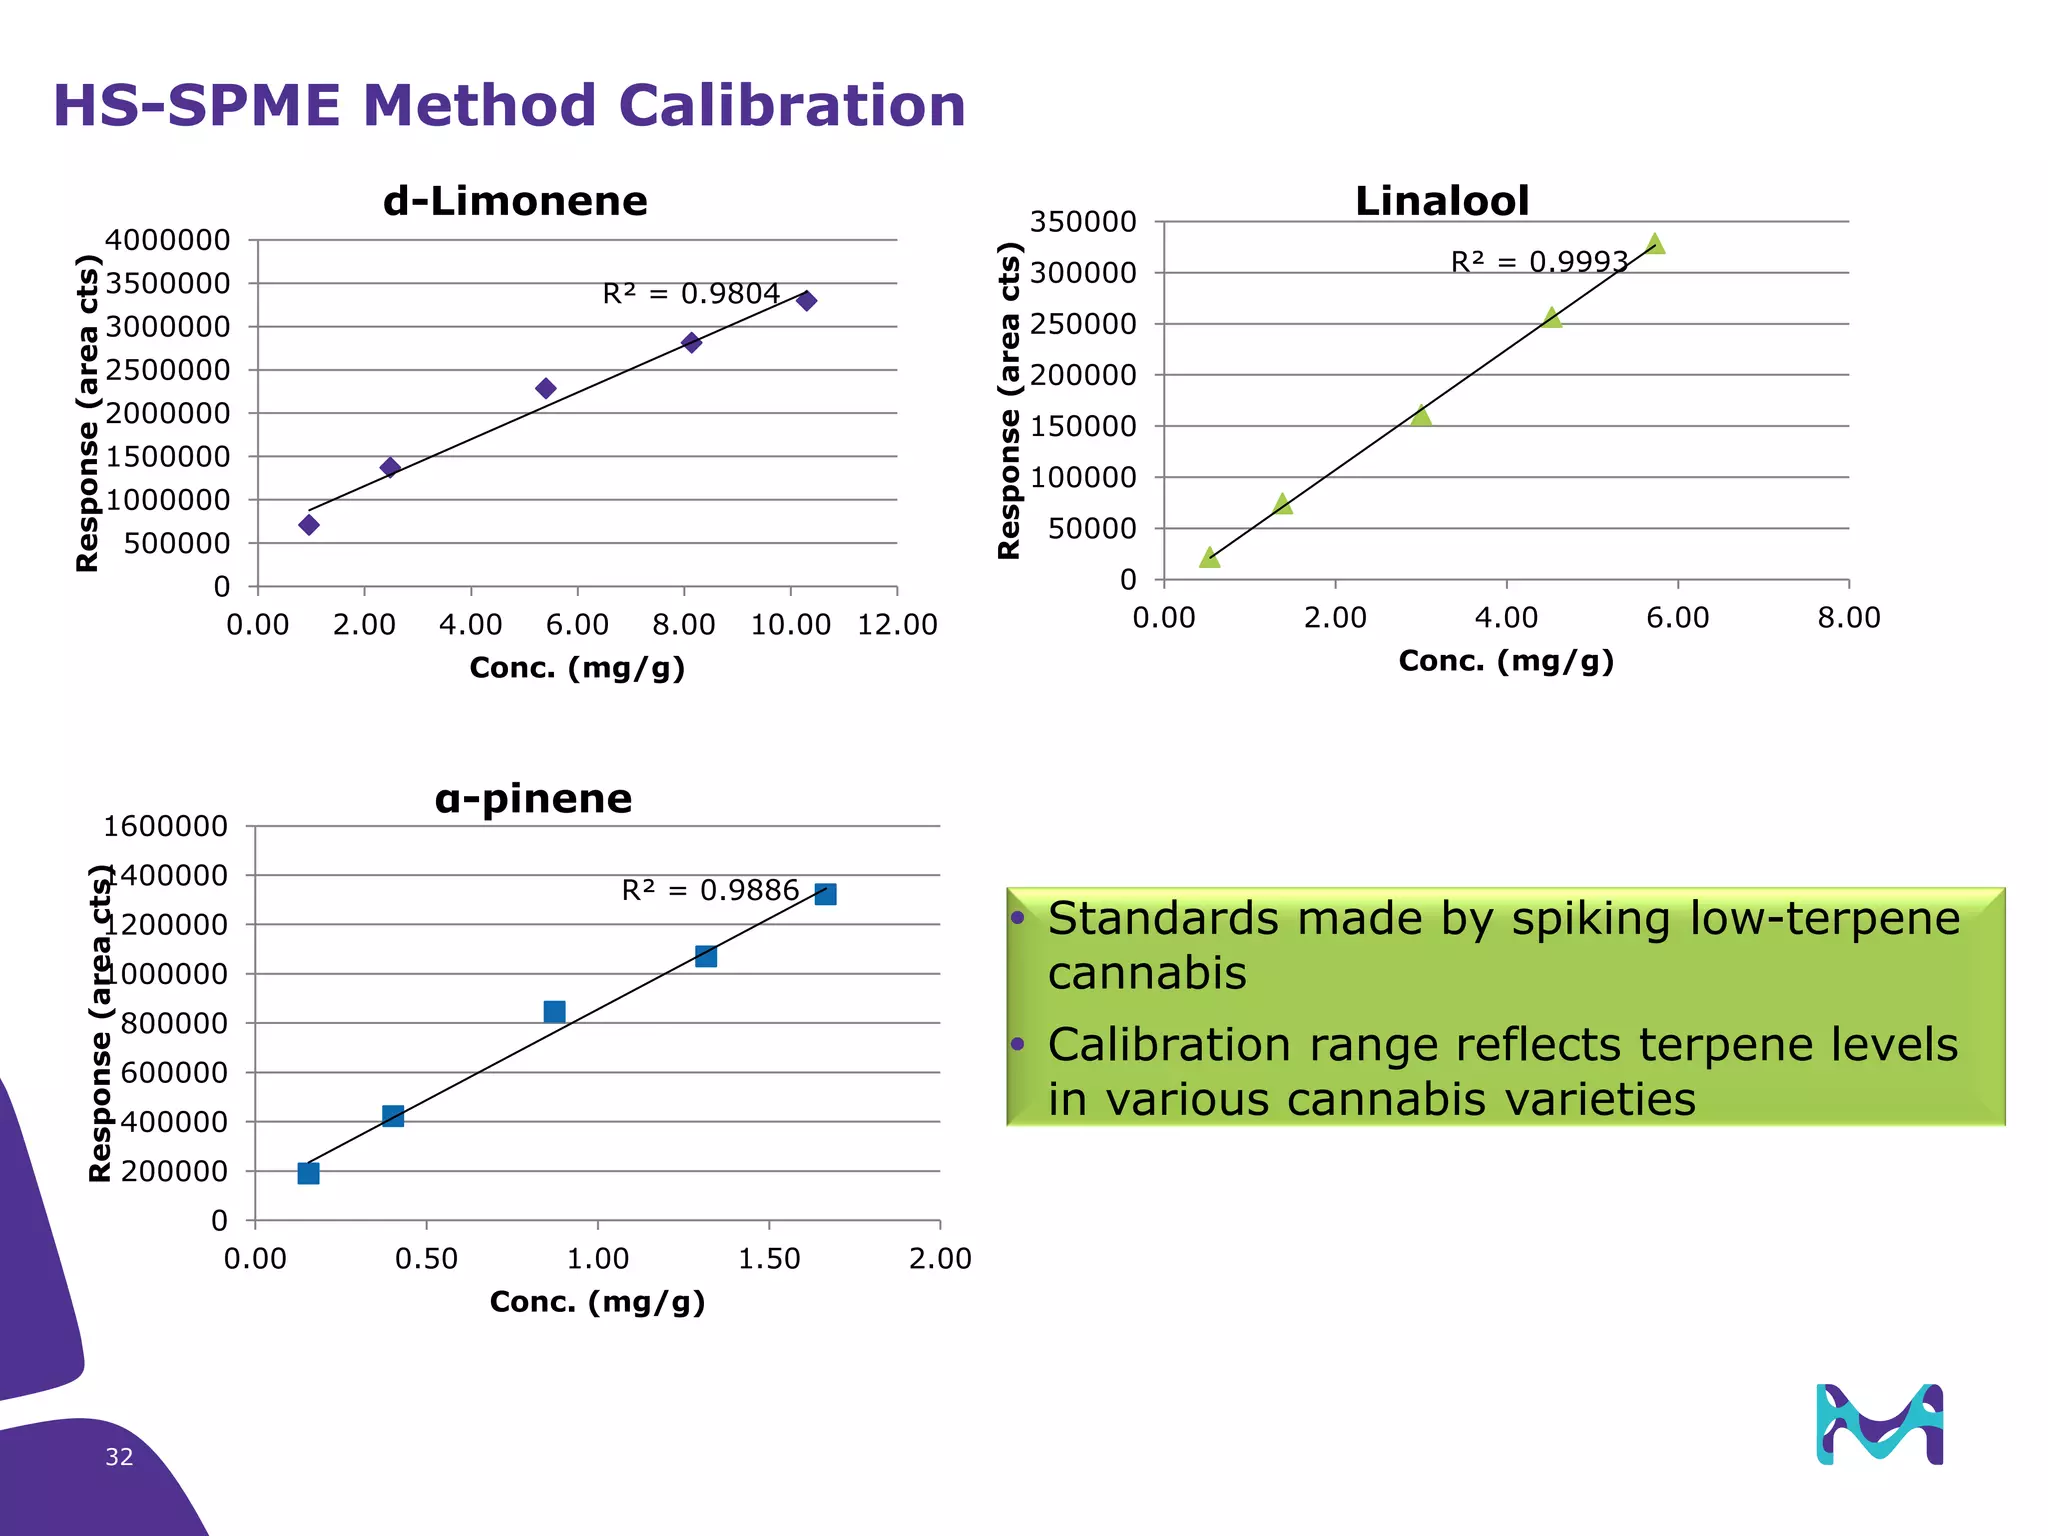
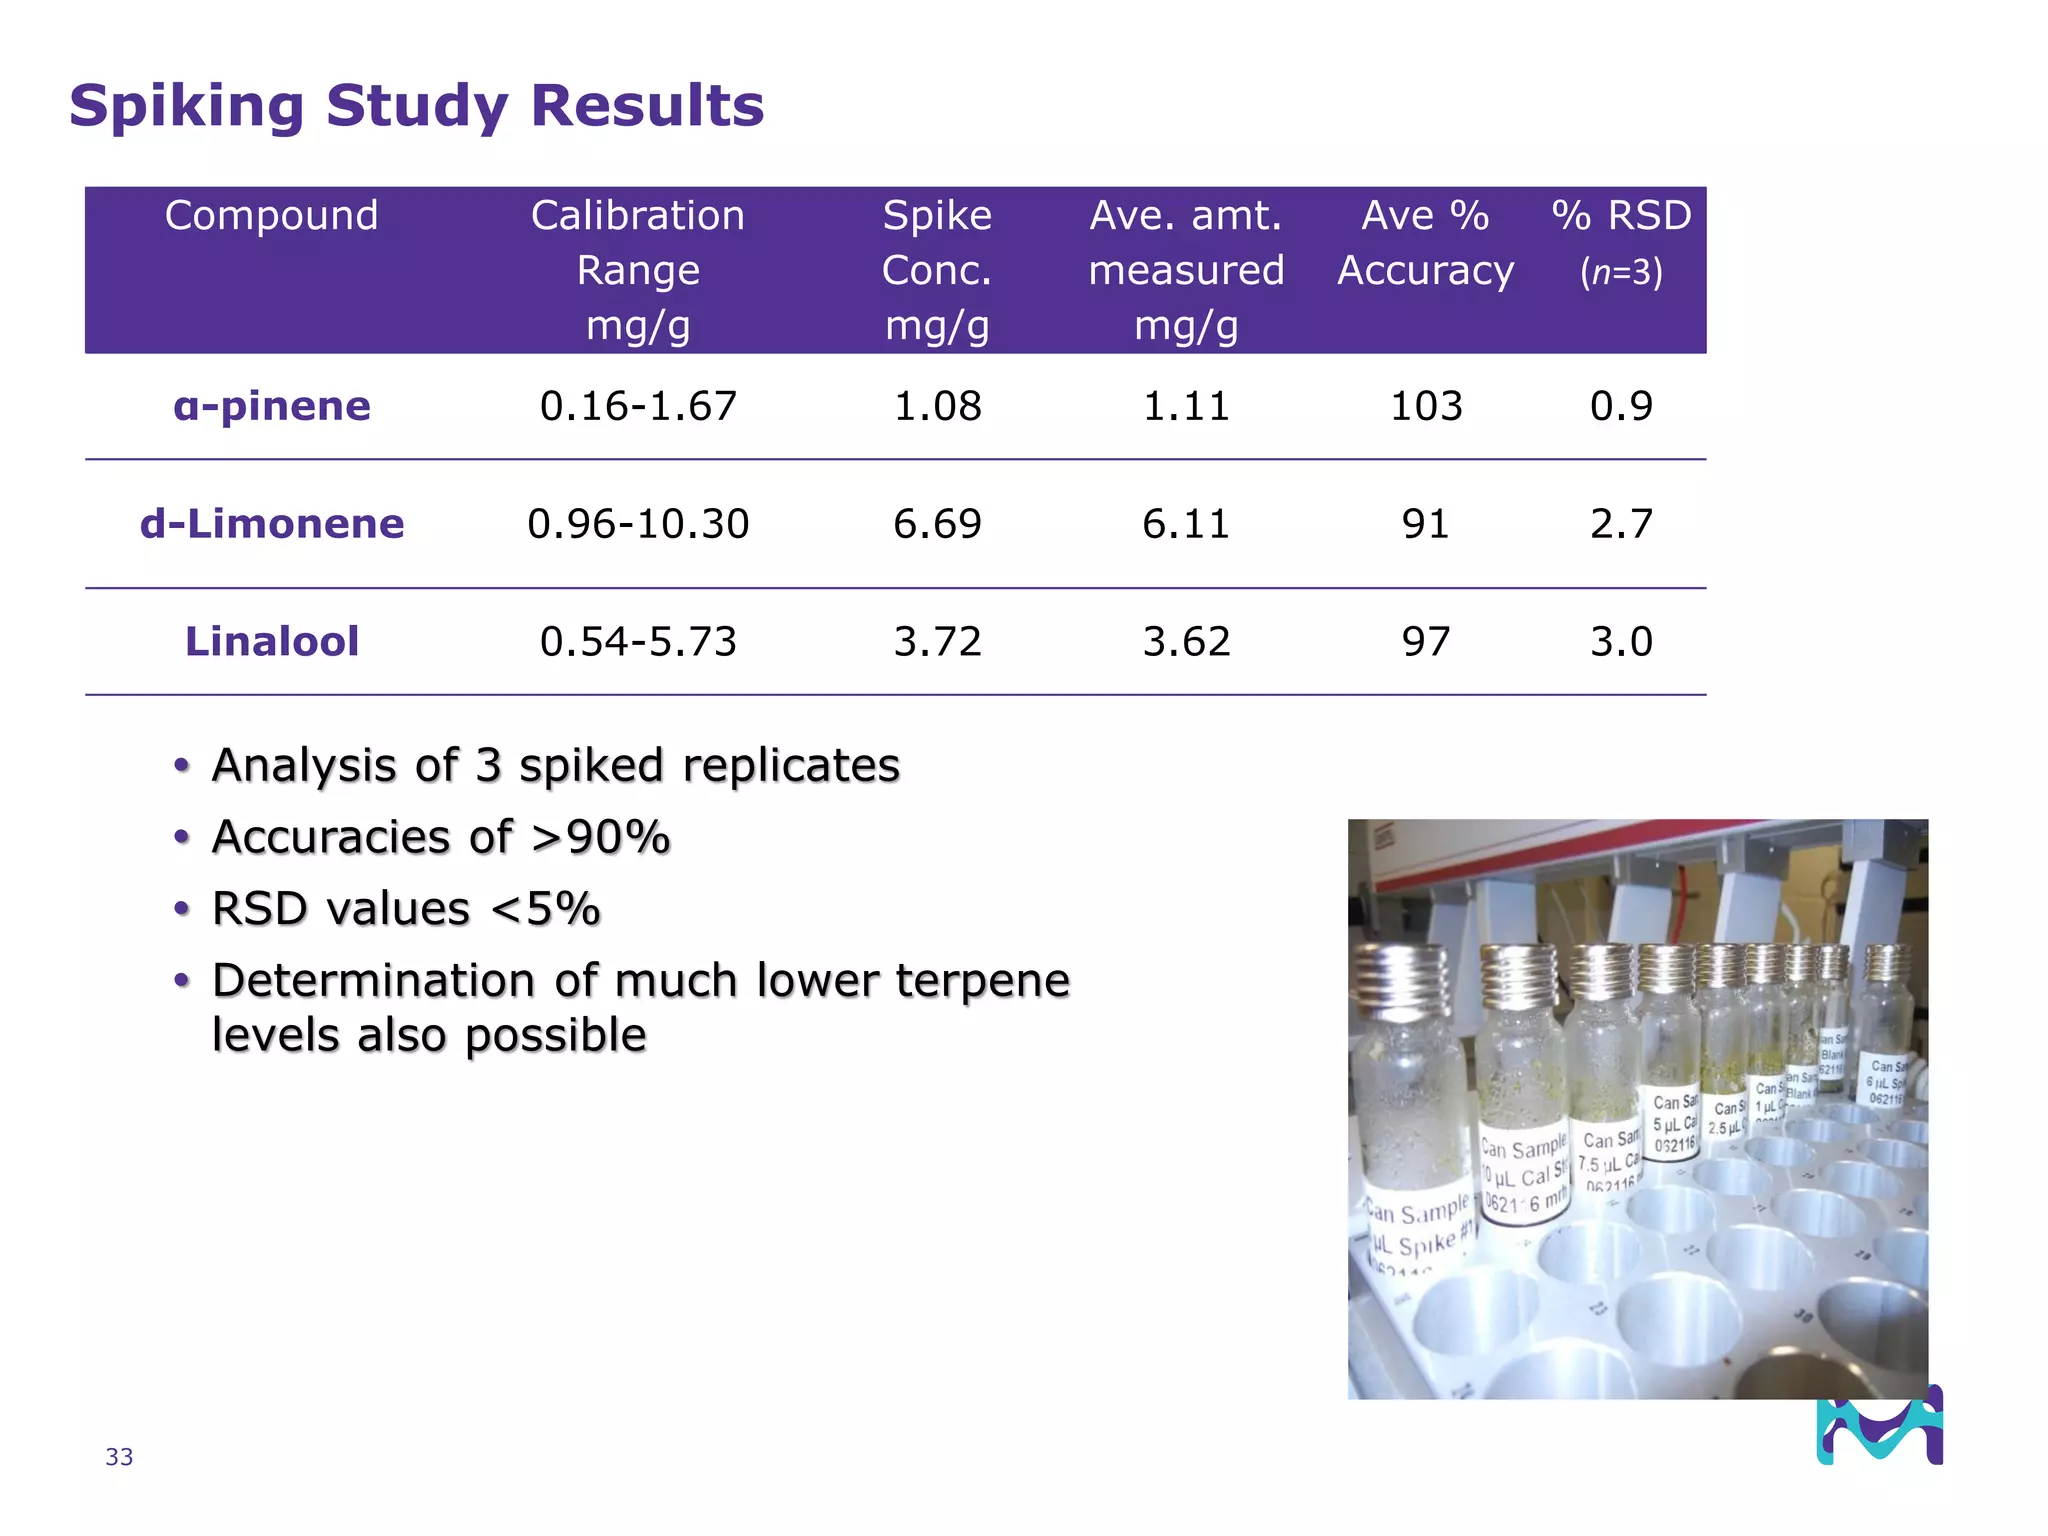
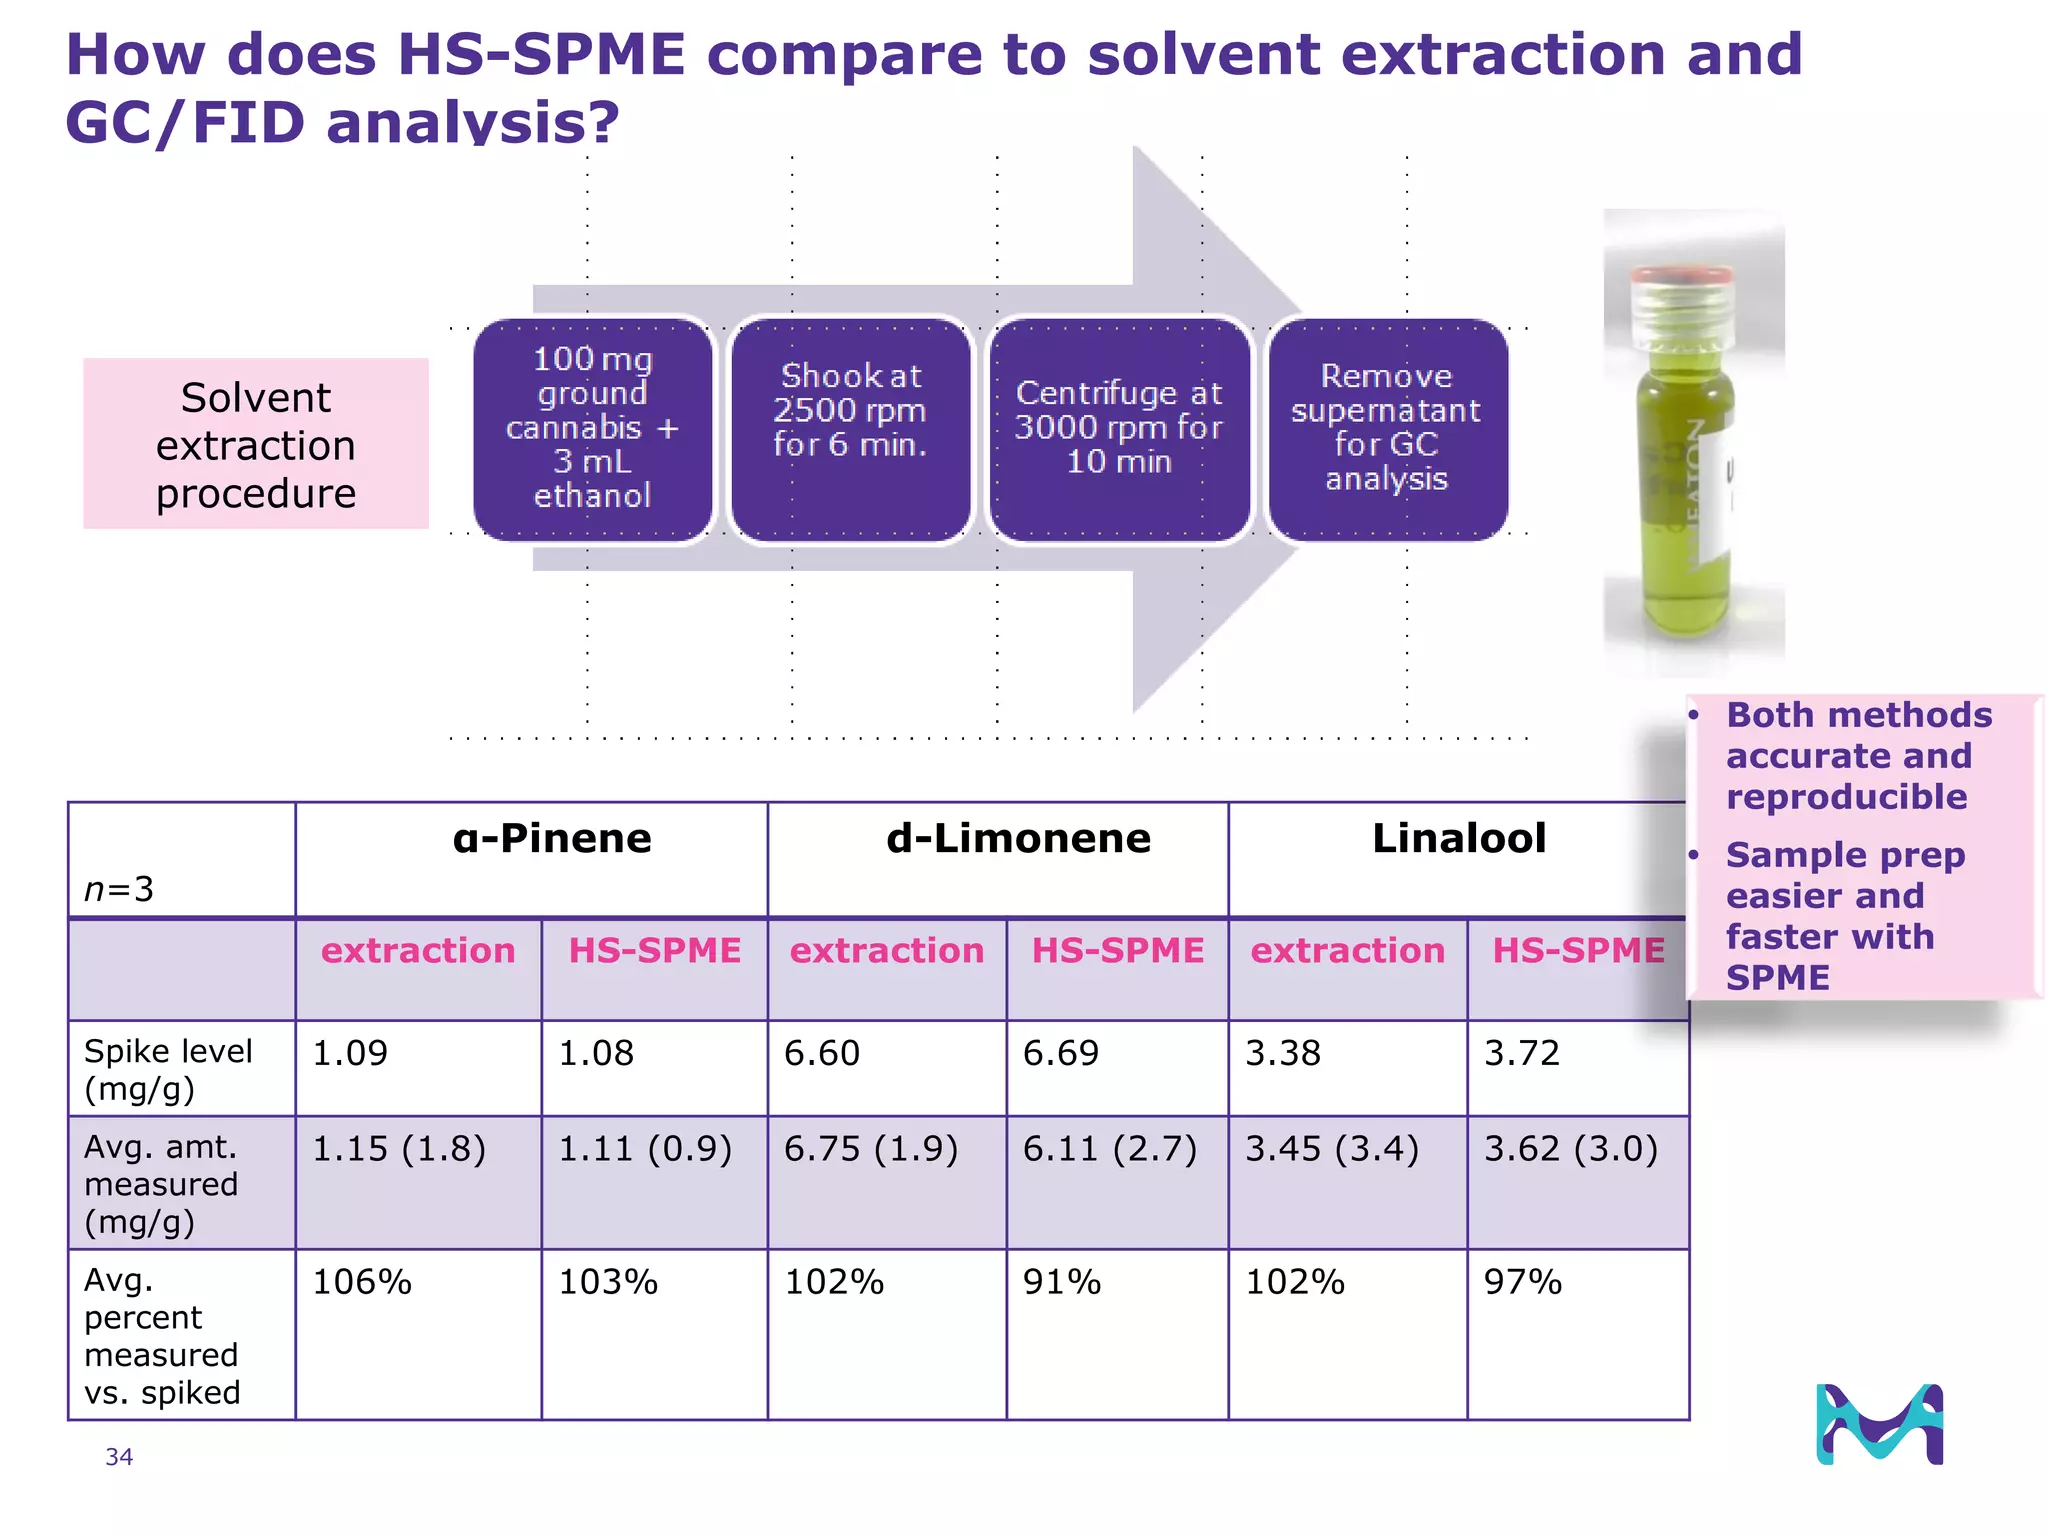
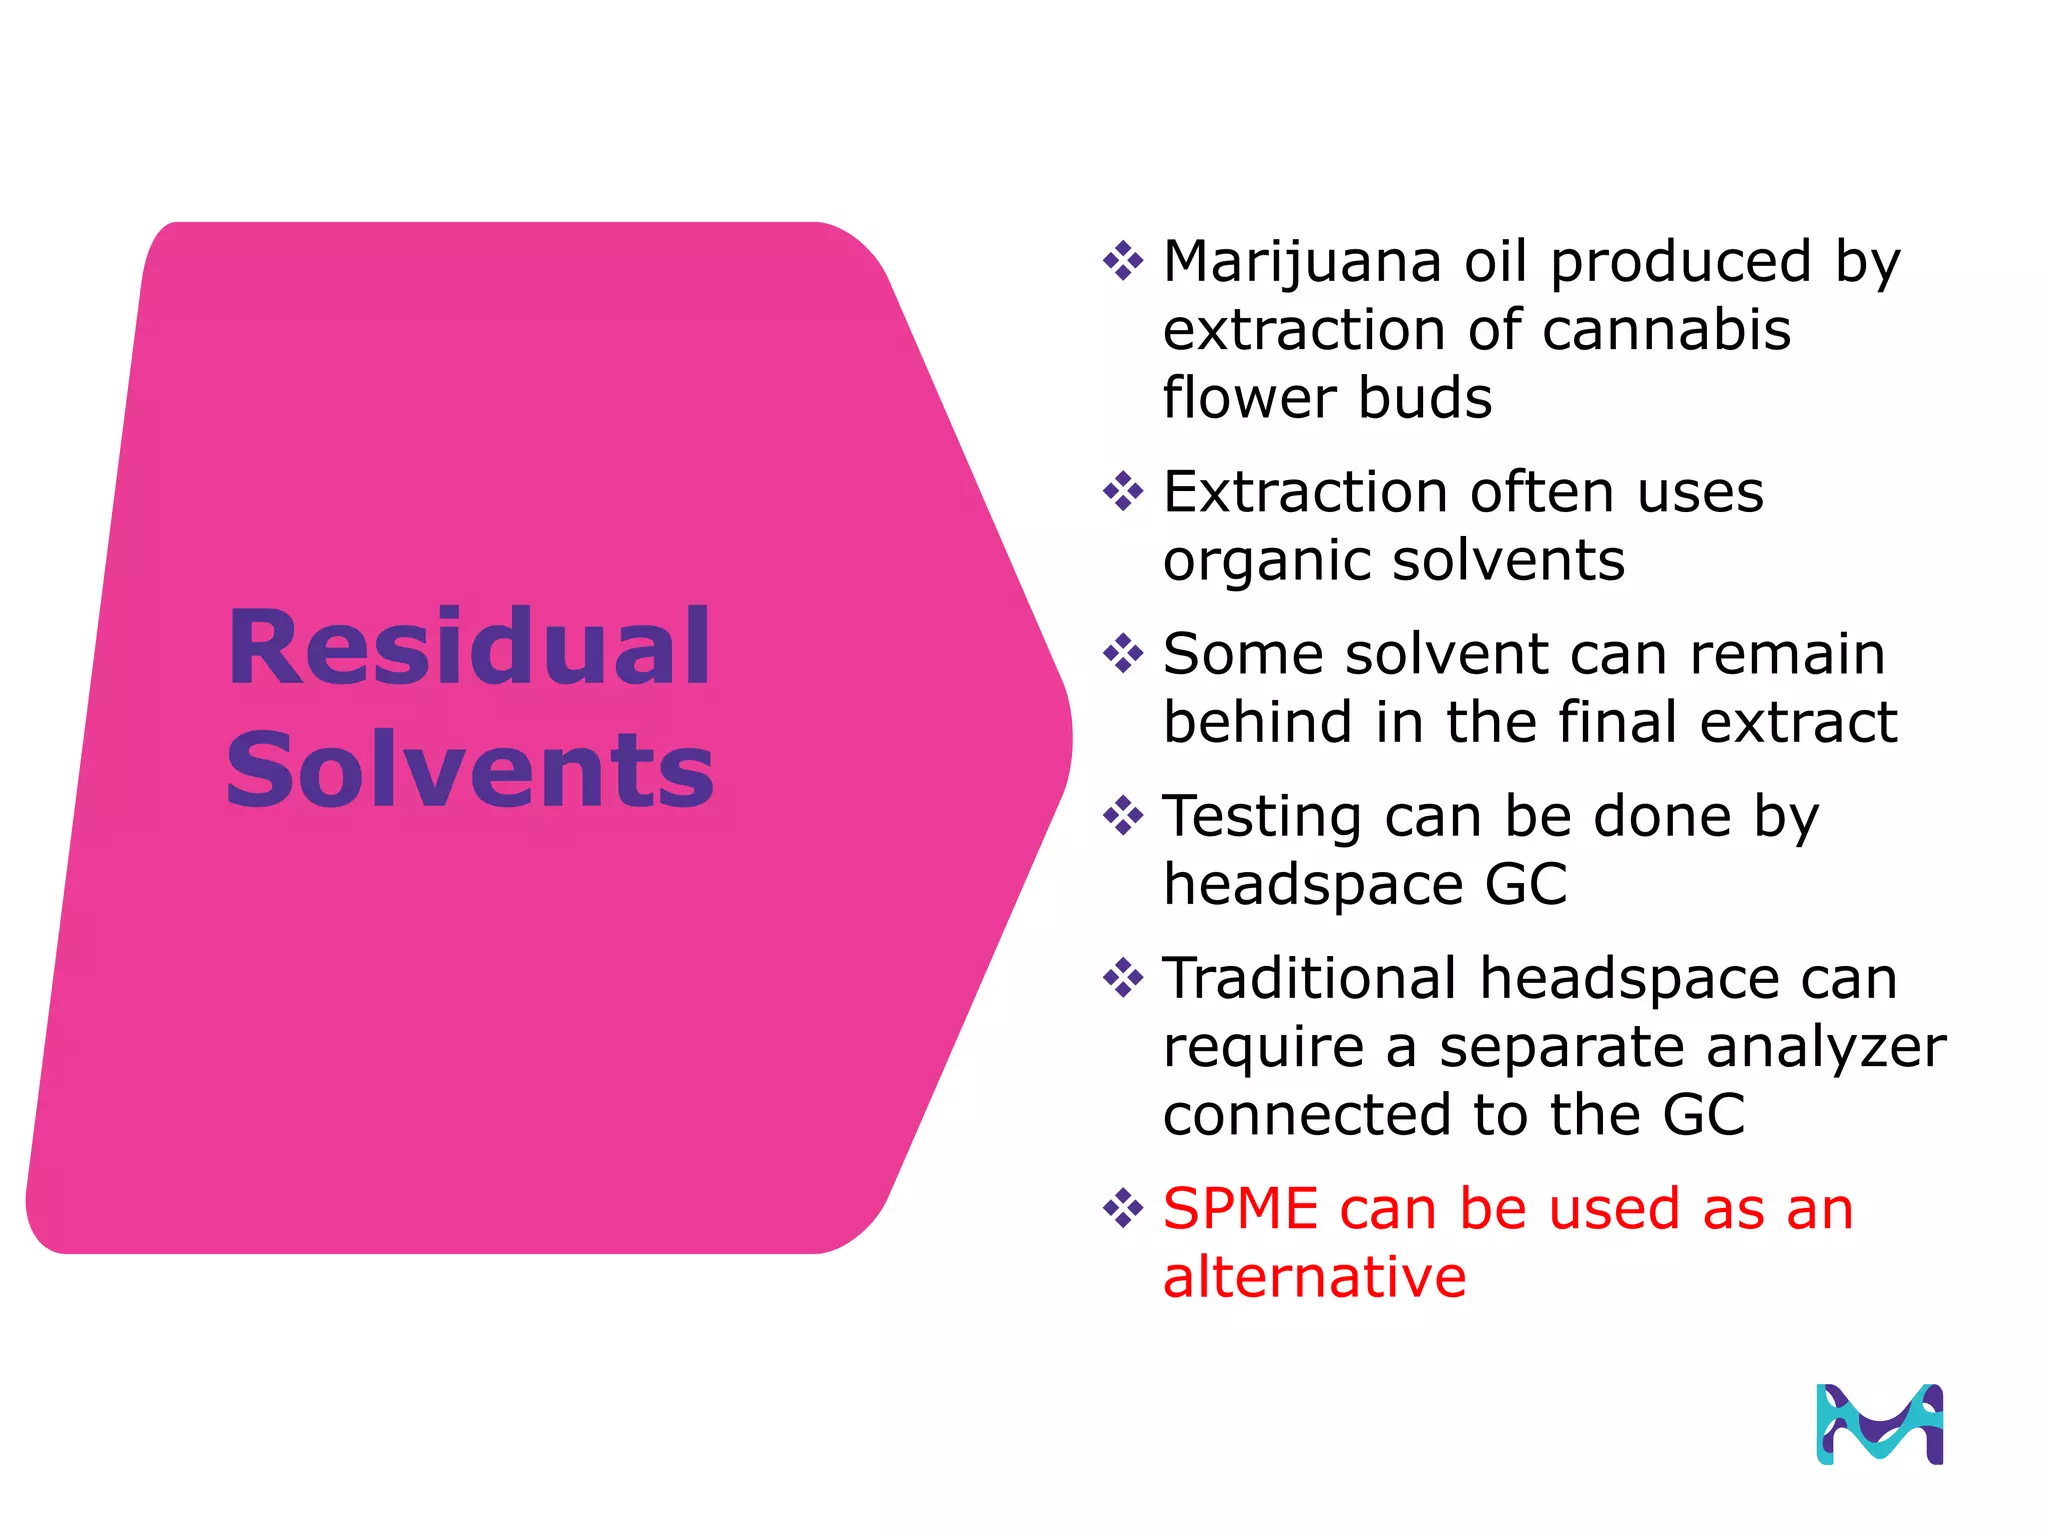
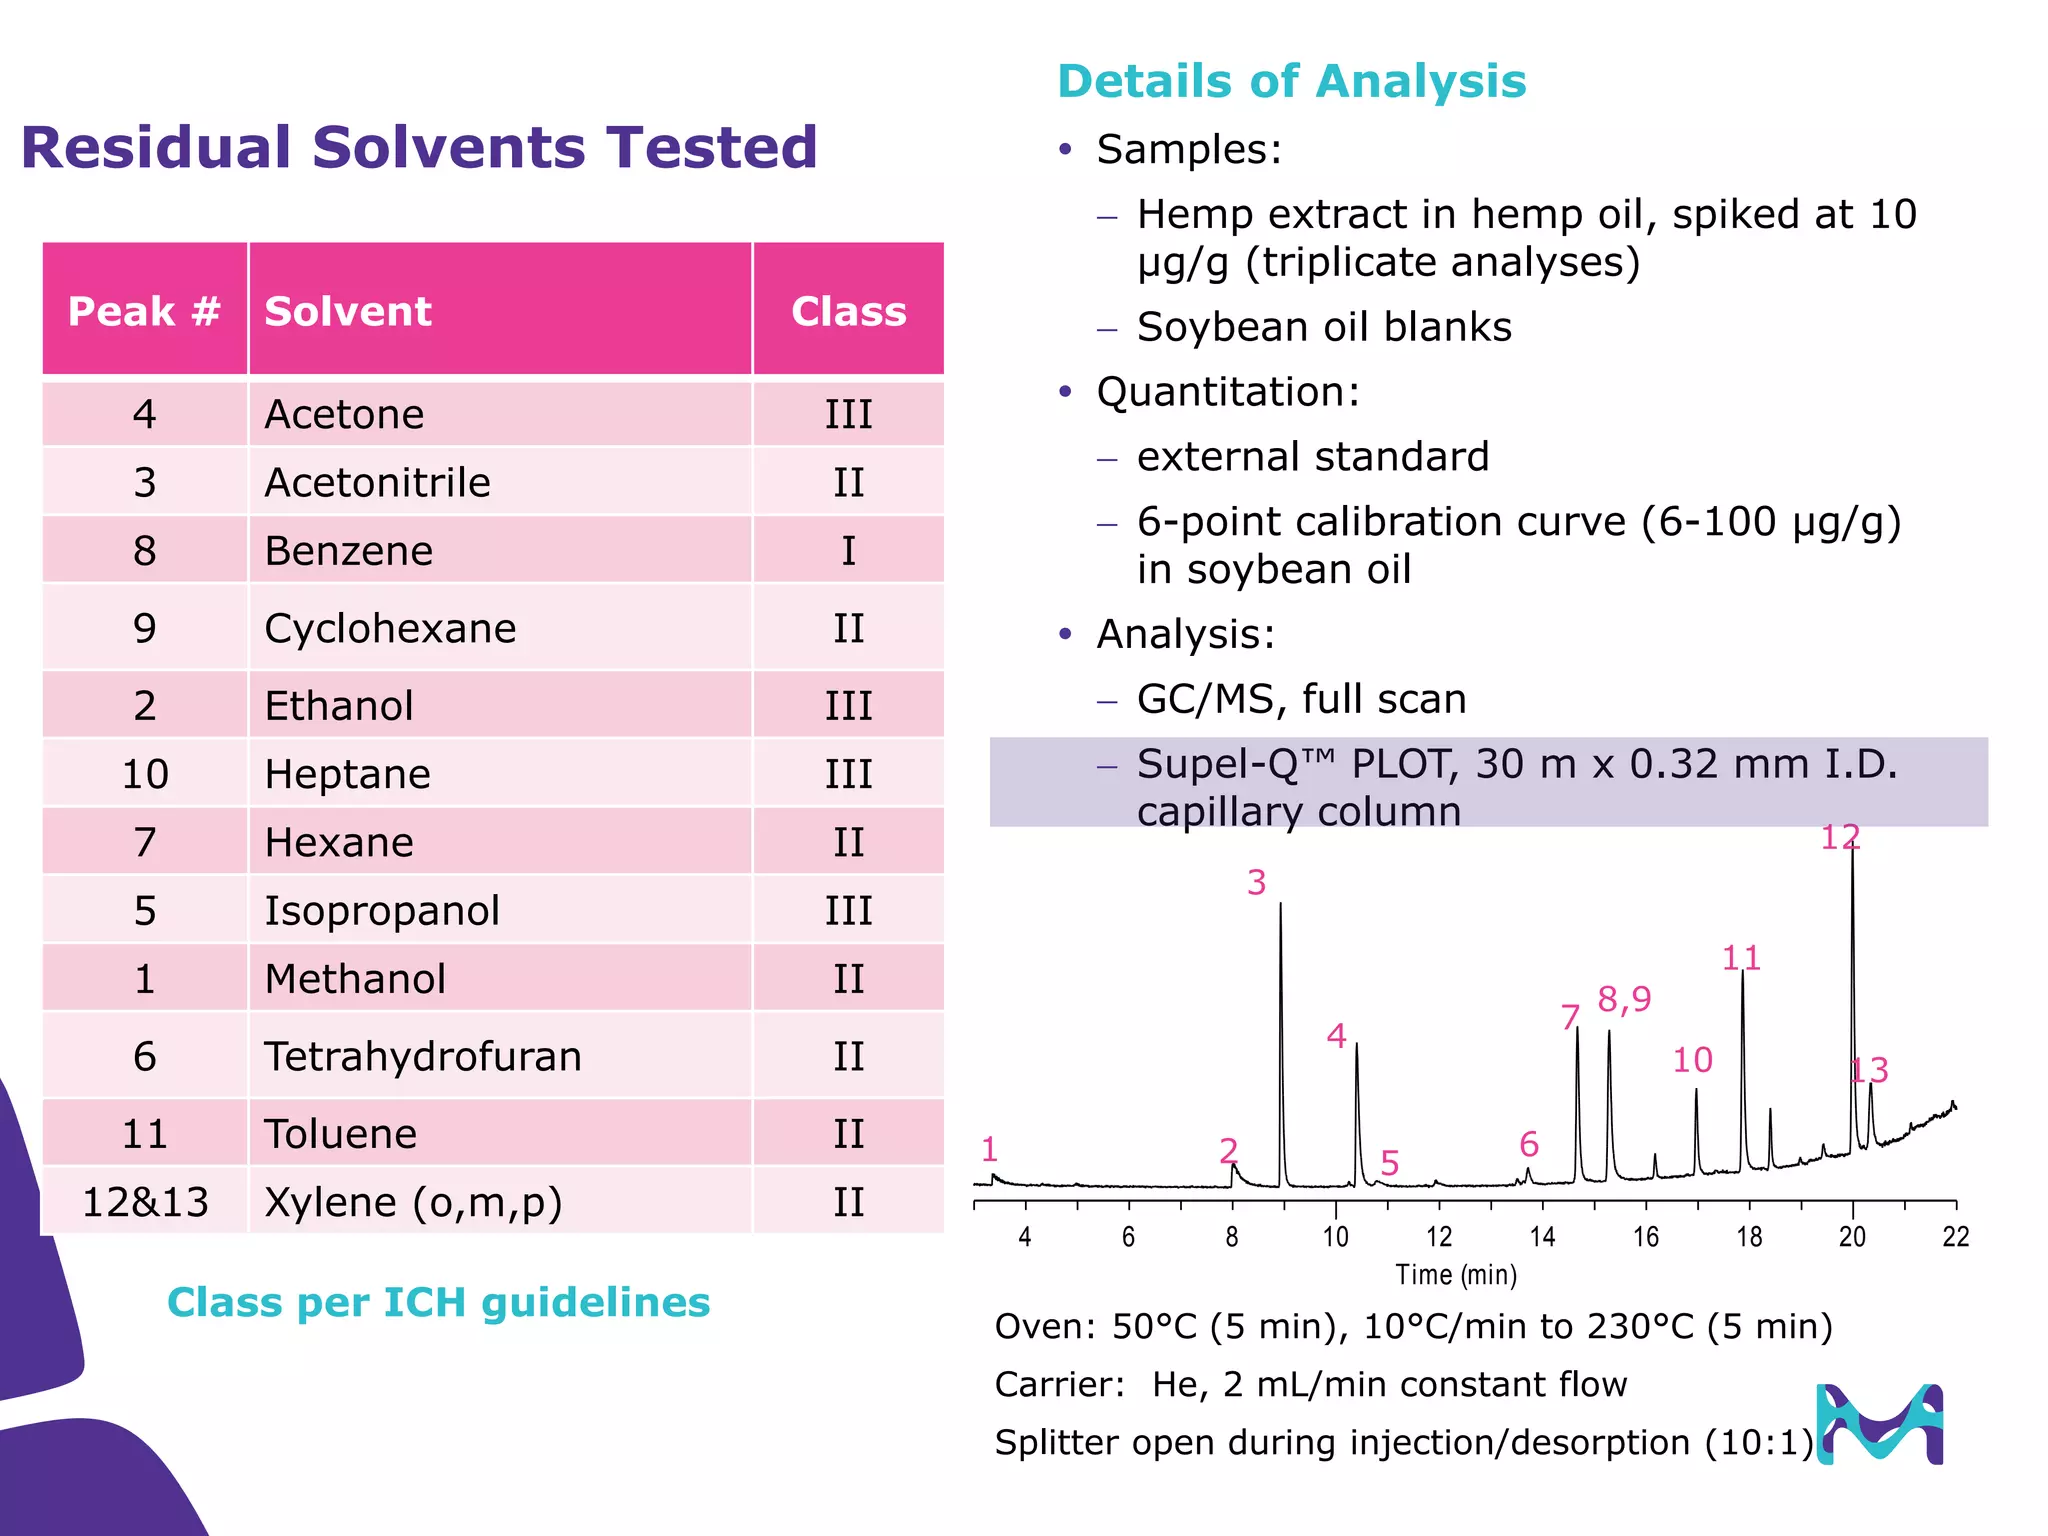
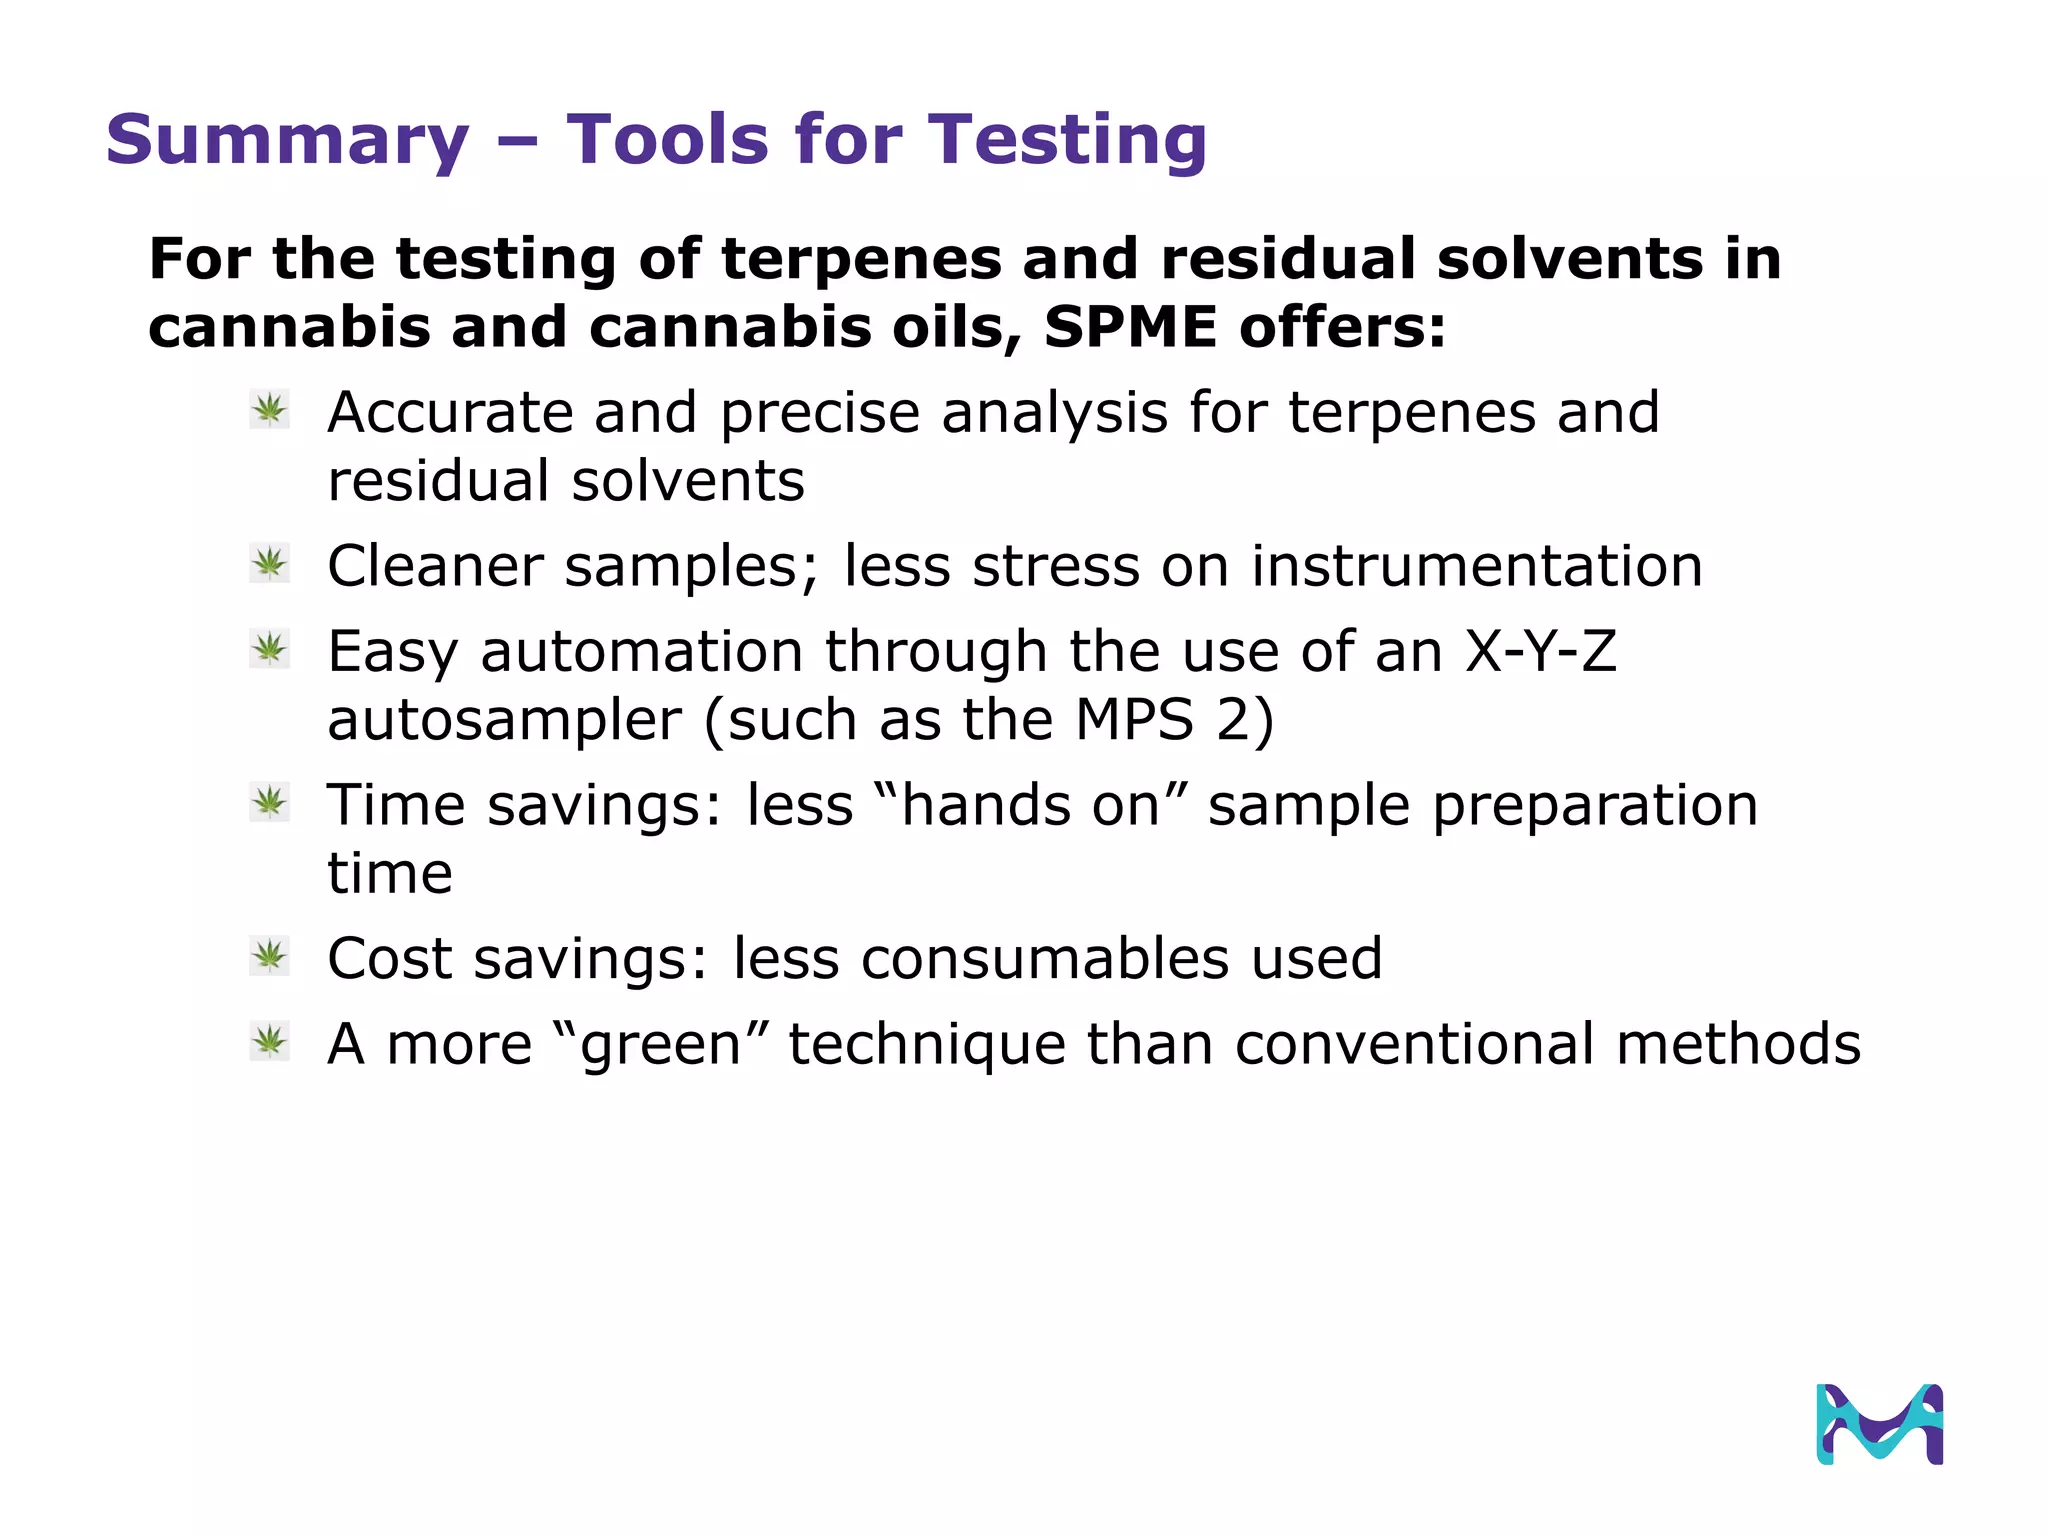


This document discusses the application of solid phase microextraction (SPME) in cannabis testing, highlighting its advantages in analyzing terpenes and residual solvents. It outlines the methodology, including the preparation of samples and the analysis process, while emphasizing the lack of standardized testing methods in the cannabis industry. The document includes details on specific terpenes identified in cannabis samples and the quantitative accuracy of the SPME approach compared to traditional solvent extraction methods.


![high performance thin layer chromatography [HPTLC]](https://cdn.slidesharecdn.com/ss_thumbnails/54-191219130320-thumbnail.jpg?width=640&height=640&fit=bounds)