Downloaded 297 times


![1.16 Typical past VTU Exam questions
1. What are the objectives of soil exploration [8 M – VTU – July/Aug 2002]
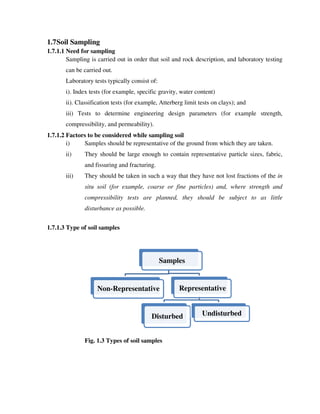
2. Distinguish between undisturbed, disturbed and representative sample of soil. What
are the tests conducted on these samples in the laboratory?
[8 M – VTU – July/Aug 2002]
3. Distinguish between undisturbed, disturbed and representative sample of soil. List the
category of lab tests for which each sample type is acceptable?
[8 M – VTU – Dec 08/Jan 09 – 1998 Scheme]
4. Explain briefly spacing and depth of boring adopted for various civil engineering
structures. [8 M – VTU – July/Aug 2003]
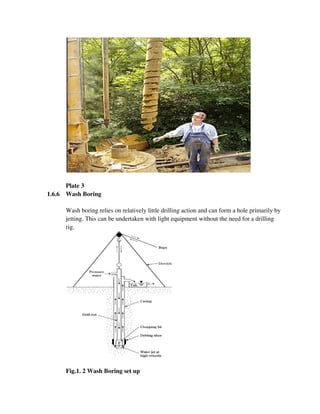
5. 2. List the methods of soil exploration . Describe with a neat sketch wash boring
method of soil exploration. [10 M – VTU –July 2006]
6. 3. Indicate number and depth of boring adopted for various civil engineering
structures. [6 M – VTU – Dec/Jan 2007]
7. List and explain various types of samplers.
[8 M – VTU – July/Aug 2003]
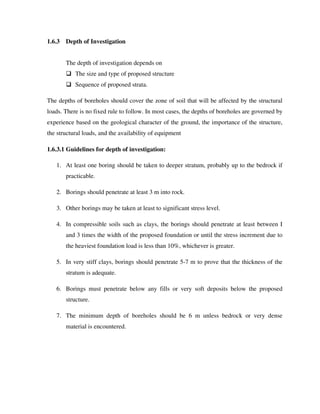
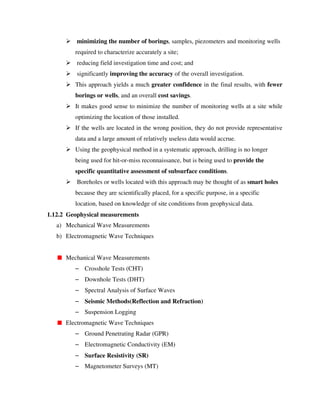
8. Determine the area ratios of the samplers of the following data and comment on the
values.
Diameter Do
(mm)
Di
(mm)
Split spoon
sampler
50 35
Drive tube 100 90
Shelby tube 50 47](https://image.slidesharecdn.com/vcmzhyhds3shugthu2si-signature-e4e16b18918cd2b14572c783e082d2f4728cfe6923067f78907e0cd016d09a44-poli-140724020830-phpapp01/85/Unit1-hbn-55-320.jpg)
![Where, Do = Outside diameter of sampling tube
Di = Inside diameter of sampling tube [4 M – VTU – July/Aug 2003]
9. Explain with reference to soil samplers: Area ratio, Inside clearance ratio, outside
clearance ratio and recovery ratio. Indicate the recommended values of them for
getting good undisturbed soil samples. [8 M – VTU –Aug 2001]
10. Explain with respect to a sampling tube
i) Area ratio ii) Recovery ratio
iii) Outside clearance iv) Inside clearance
[6 M – VTU – Feb 2002] & [6 M – VTU –July/Aug 2005]
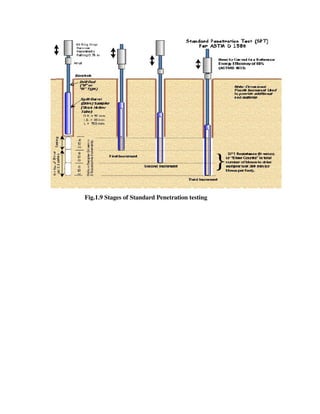
11. Describe Standard penetration test and its application in foundation engineering
[6 M – VTU – Feb 2002]
12. Write Short notes on SPT test
[5 M – VTU – July 2006; Dec/Jan 2007; July 2007]
13. Explain Standard penetration test [4 M – VTU – Dec 08/Jan09- 2002 Scheme]
14. In a seismic survey the following readings were obtained
Time (s) 0.1 0.2 0.3 0.4 0.45 0.5 0.55
Distance (m) 40 80 120 160 200 240 280
Geophones are fixed at 40 m in a straight line. Determine:
i) Wave velocity in soil layers ii) Thickness of top stratum
[8 M – VTU – Feb 2002]
15.](https://image.slidesharecdn.com/vcmzhyhds3shugthu2si-signature-e4e16b18918cd2b14572c783e082d2f4728cfe6923067f78907e0cd016d09a44-poli-140724020830-phpapp01/85/Unit1-hbn-56-320.jpg)


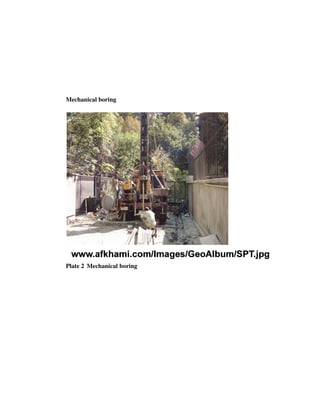
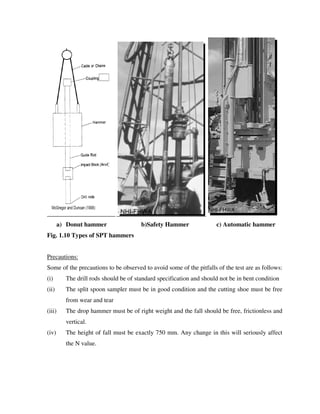
1. The document discusses subsurface exploration for geotechnical engineering projects. Subsurface exploration involves methods like trial pits, boreholes, and geophysical tests to understand soil conditions below the surface. 2. Proper subsurface exploration is important for foundation design, construction planning, and other aspects of civil engineering projects. The document outlines factors that determine the scope and methods of exploration for different project types. 3. Key methods discussed include trial pits, hand auger and mechanical boreholes, wash boring, and sampling techniques to obtain representative, disturbed and undisturbed soil samples for testing and analysis. Guidelines are provided on spacing, depth and other aspects of effective subsurface exploration.


