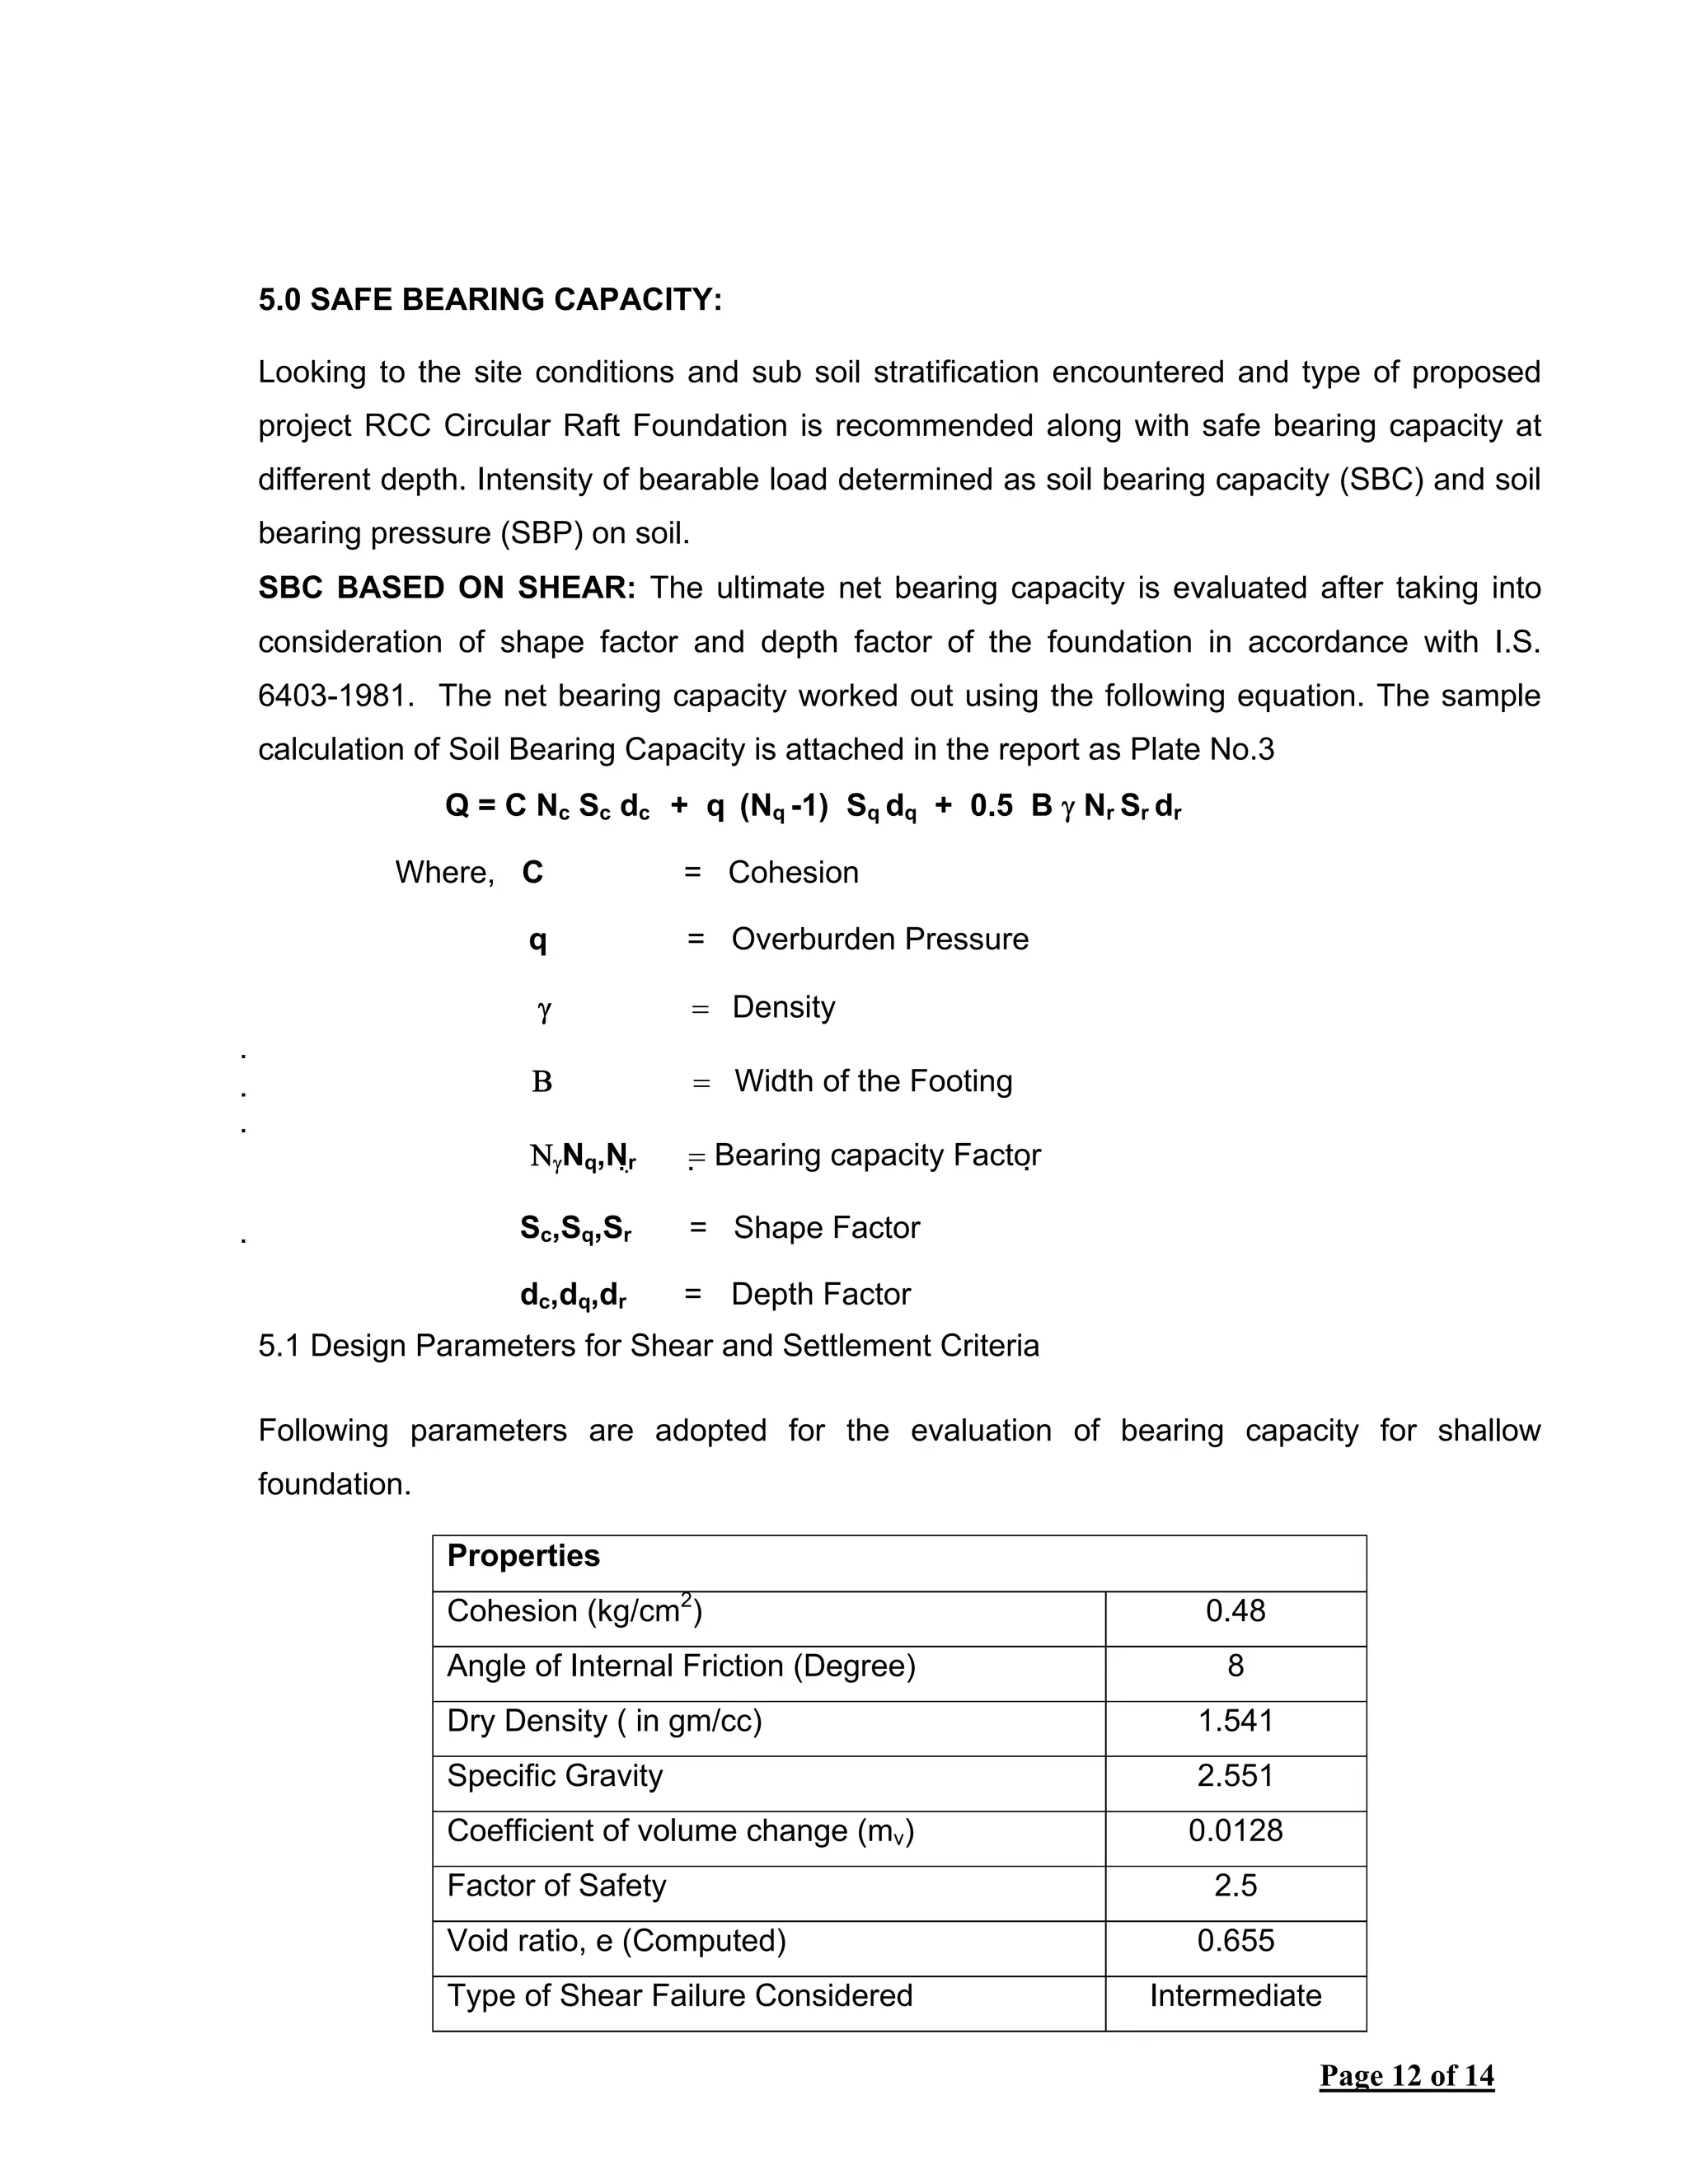
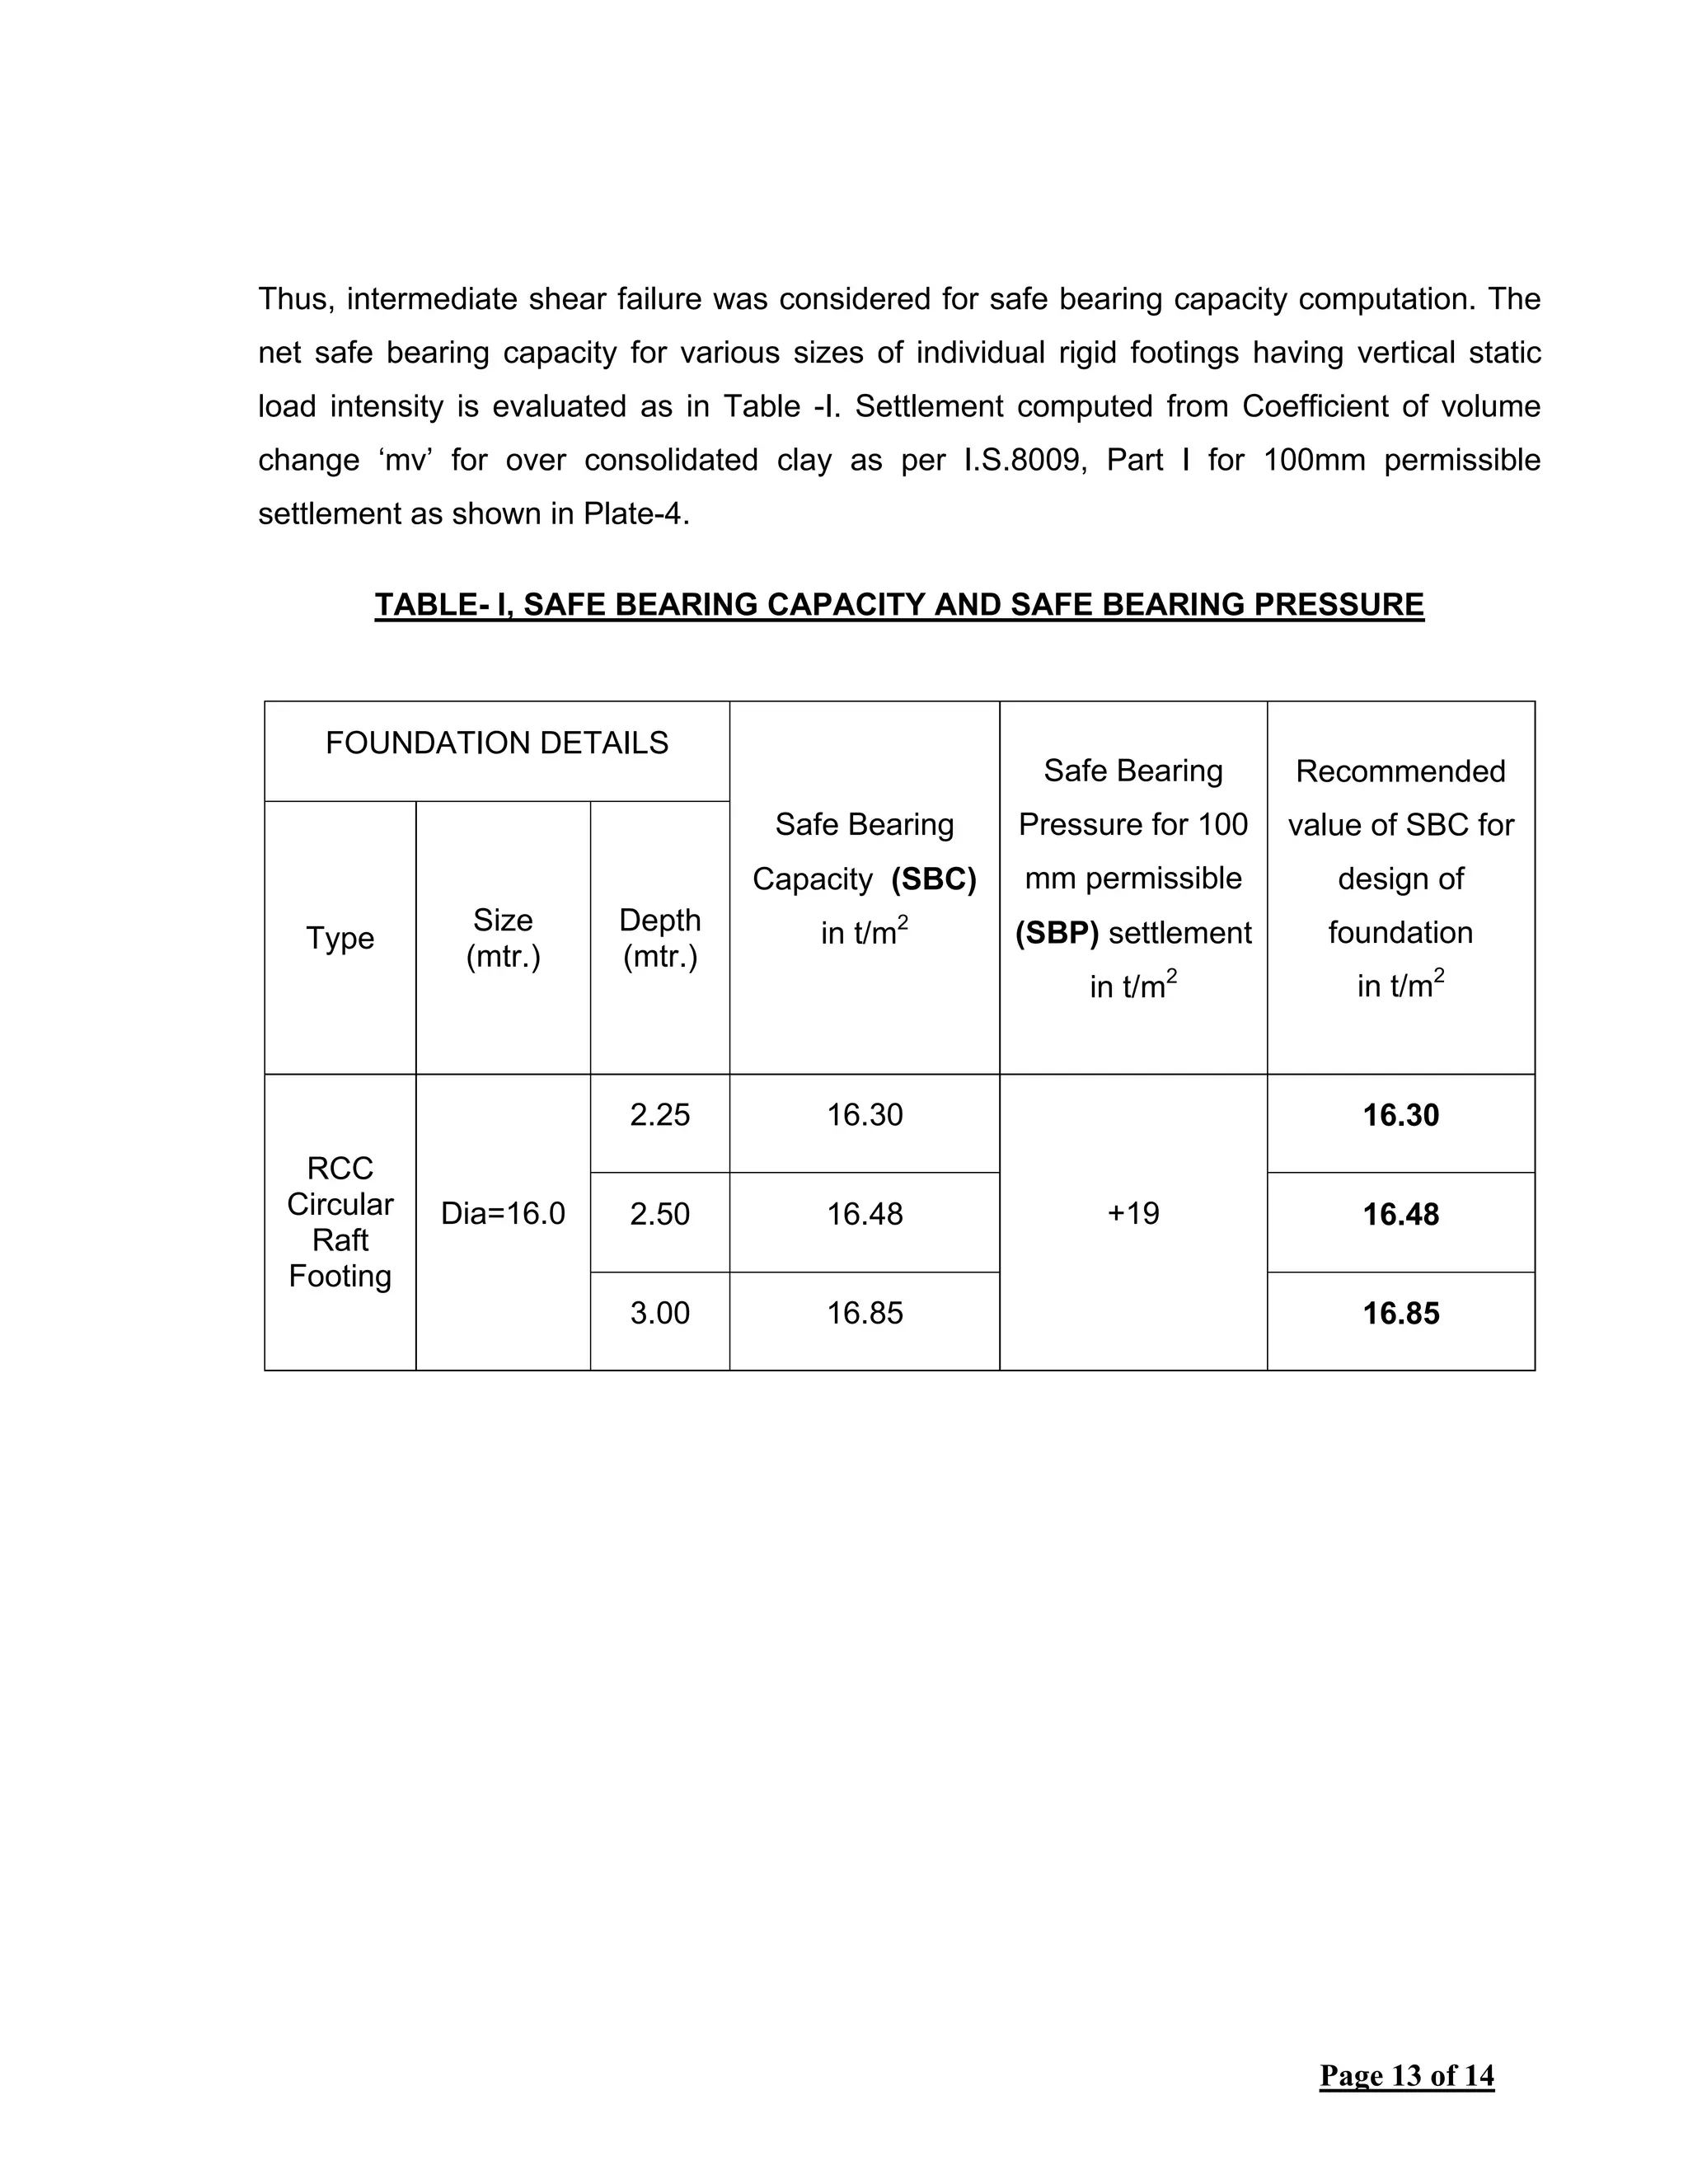
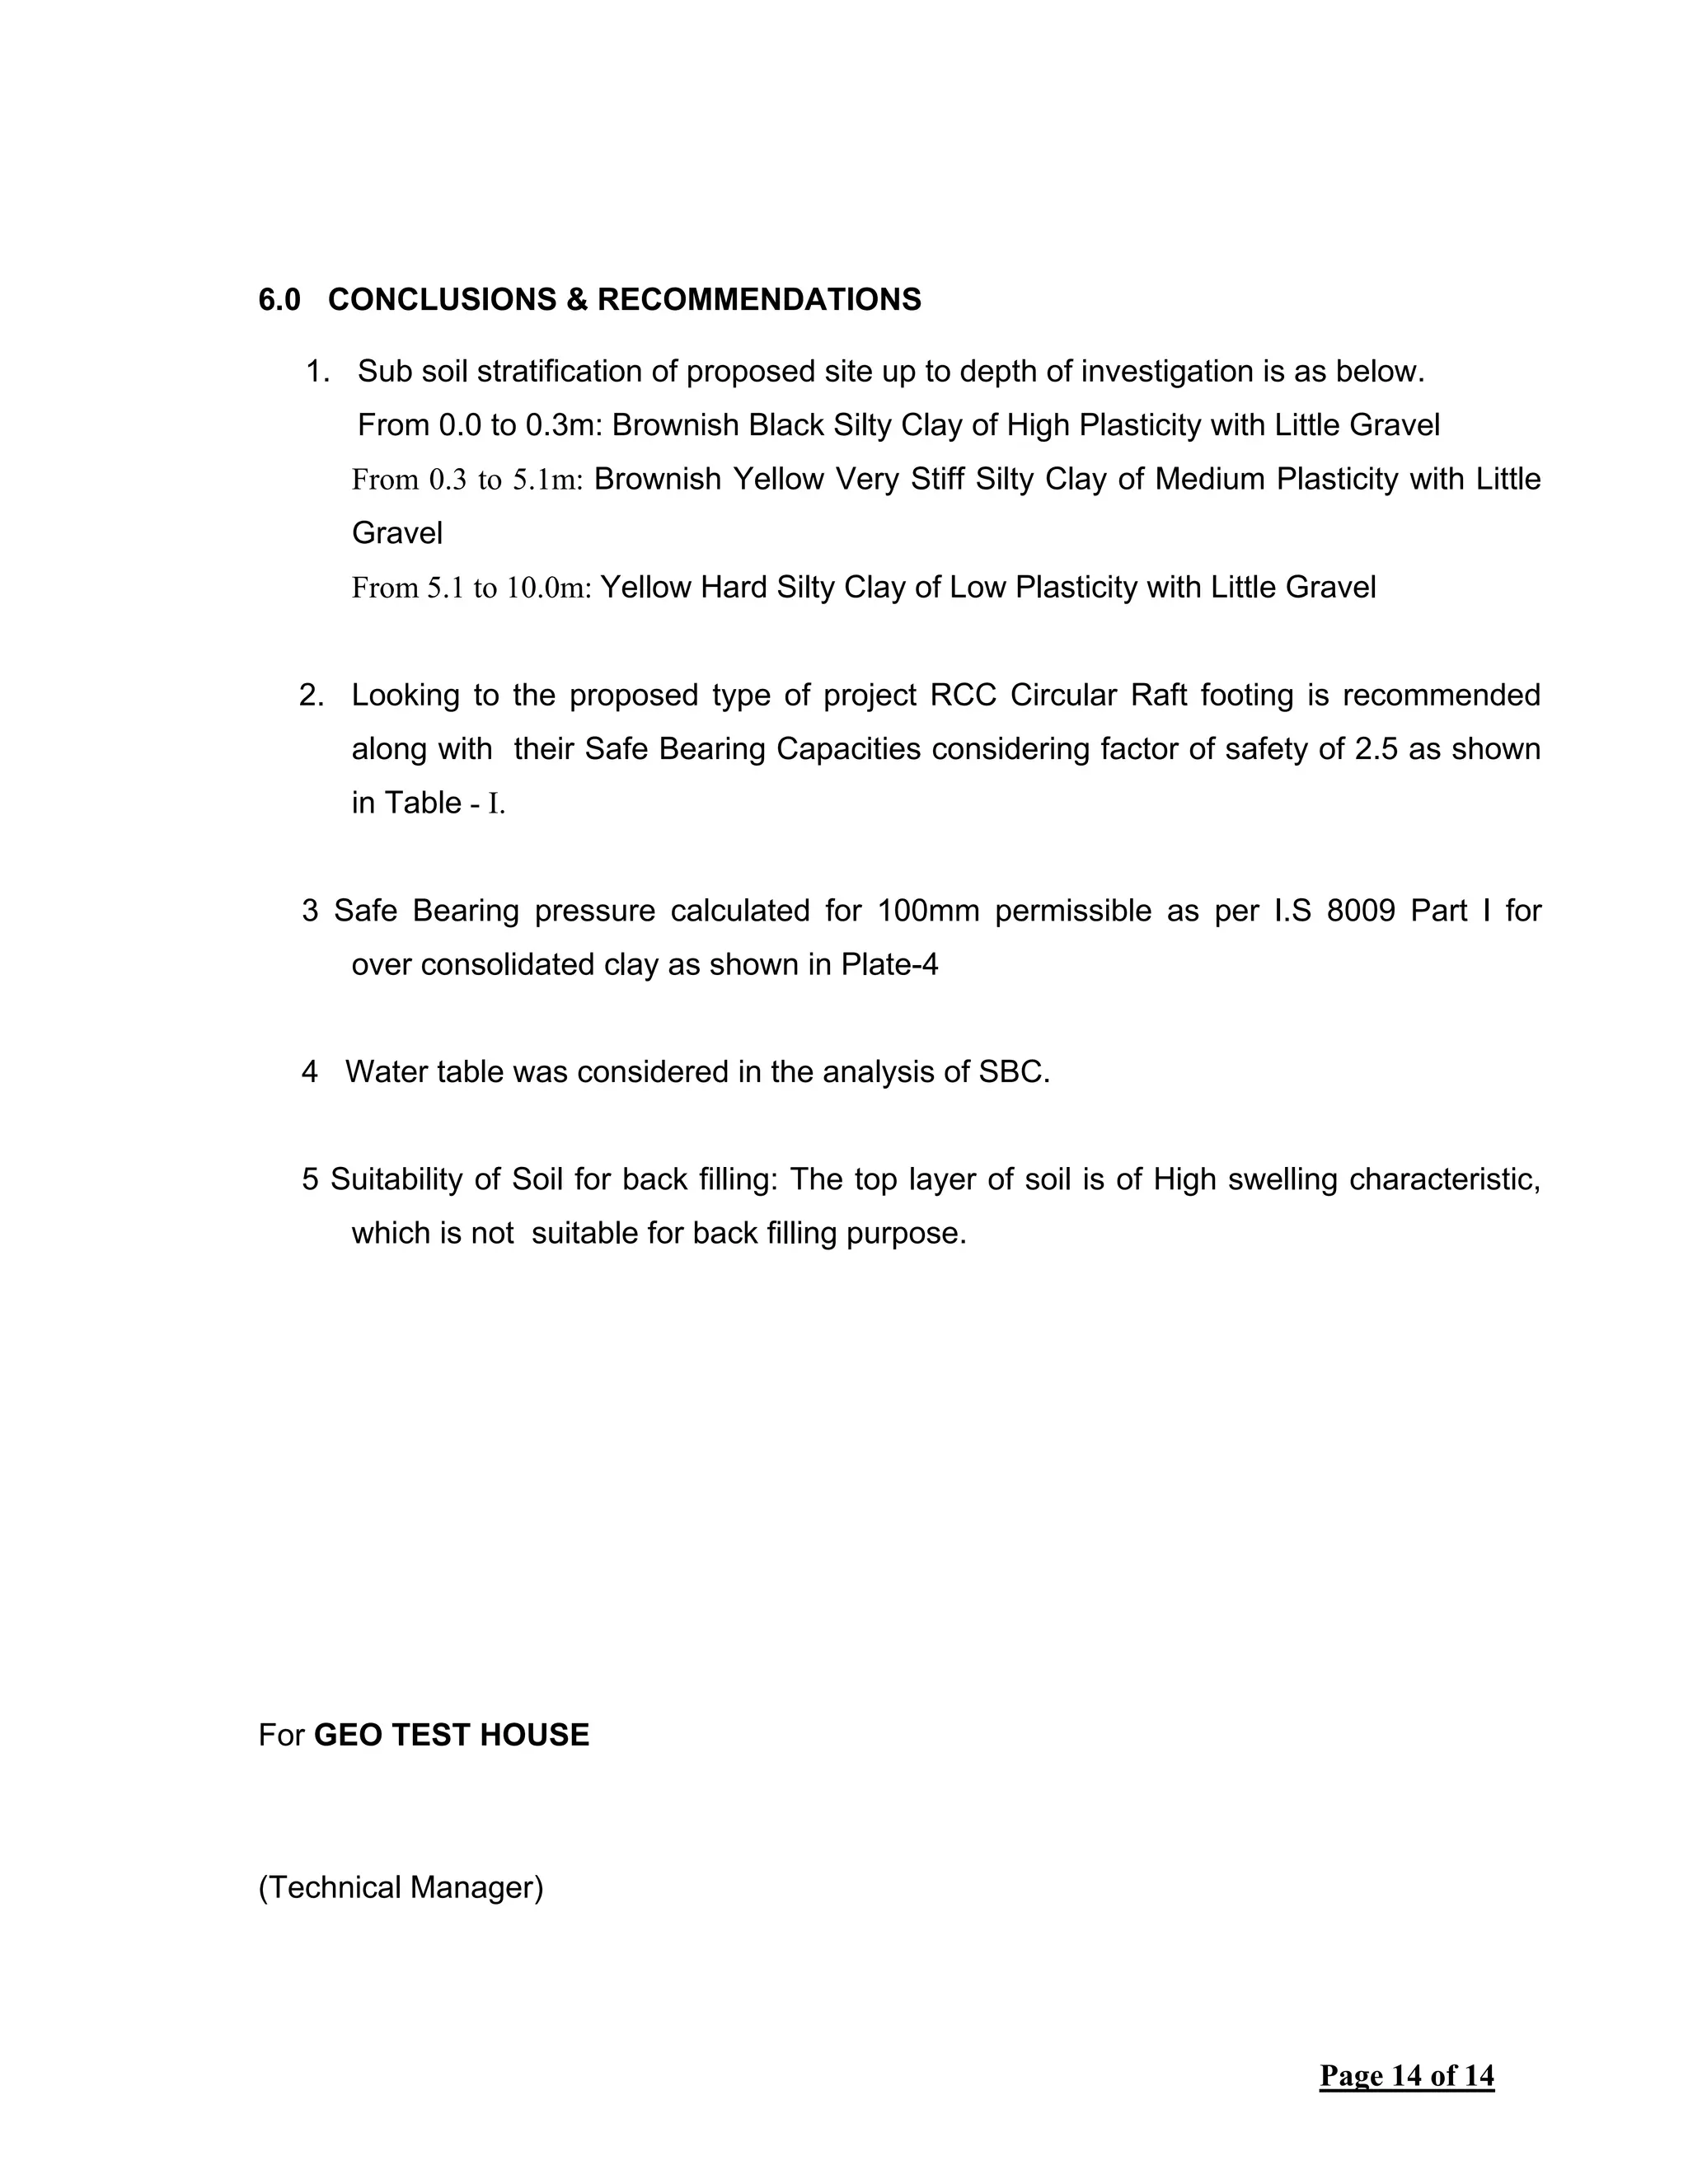
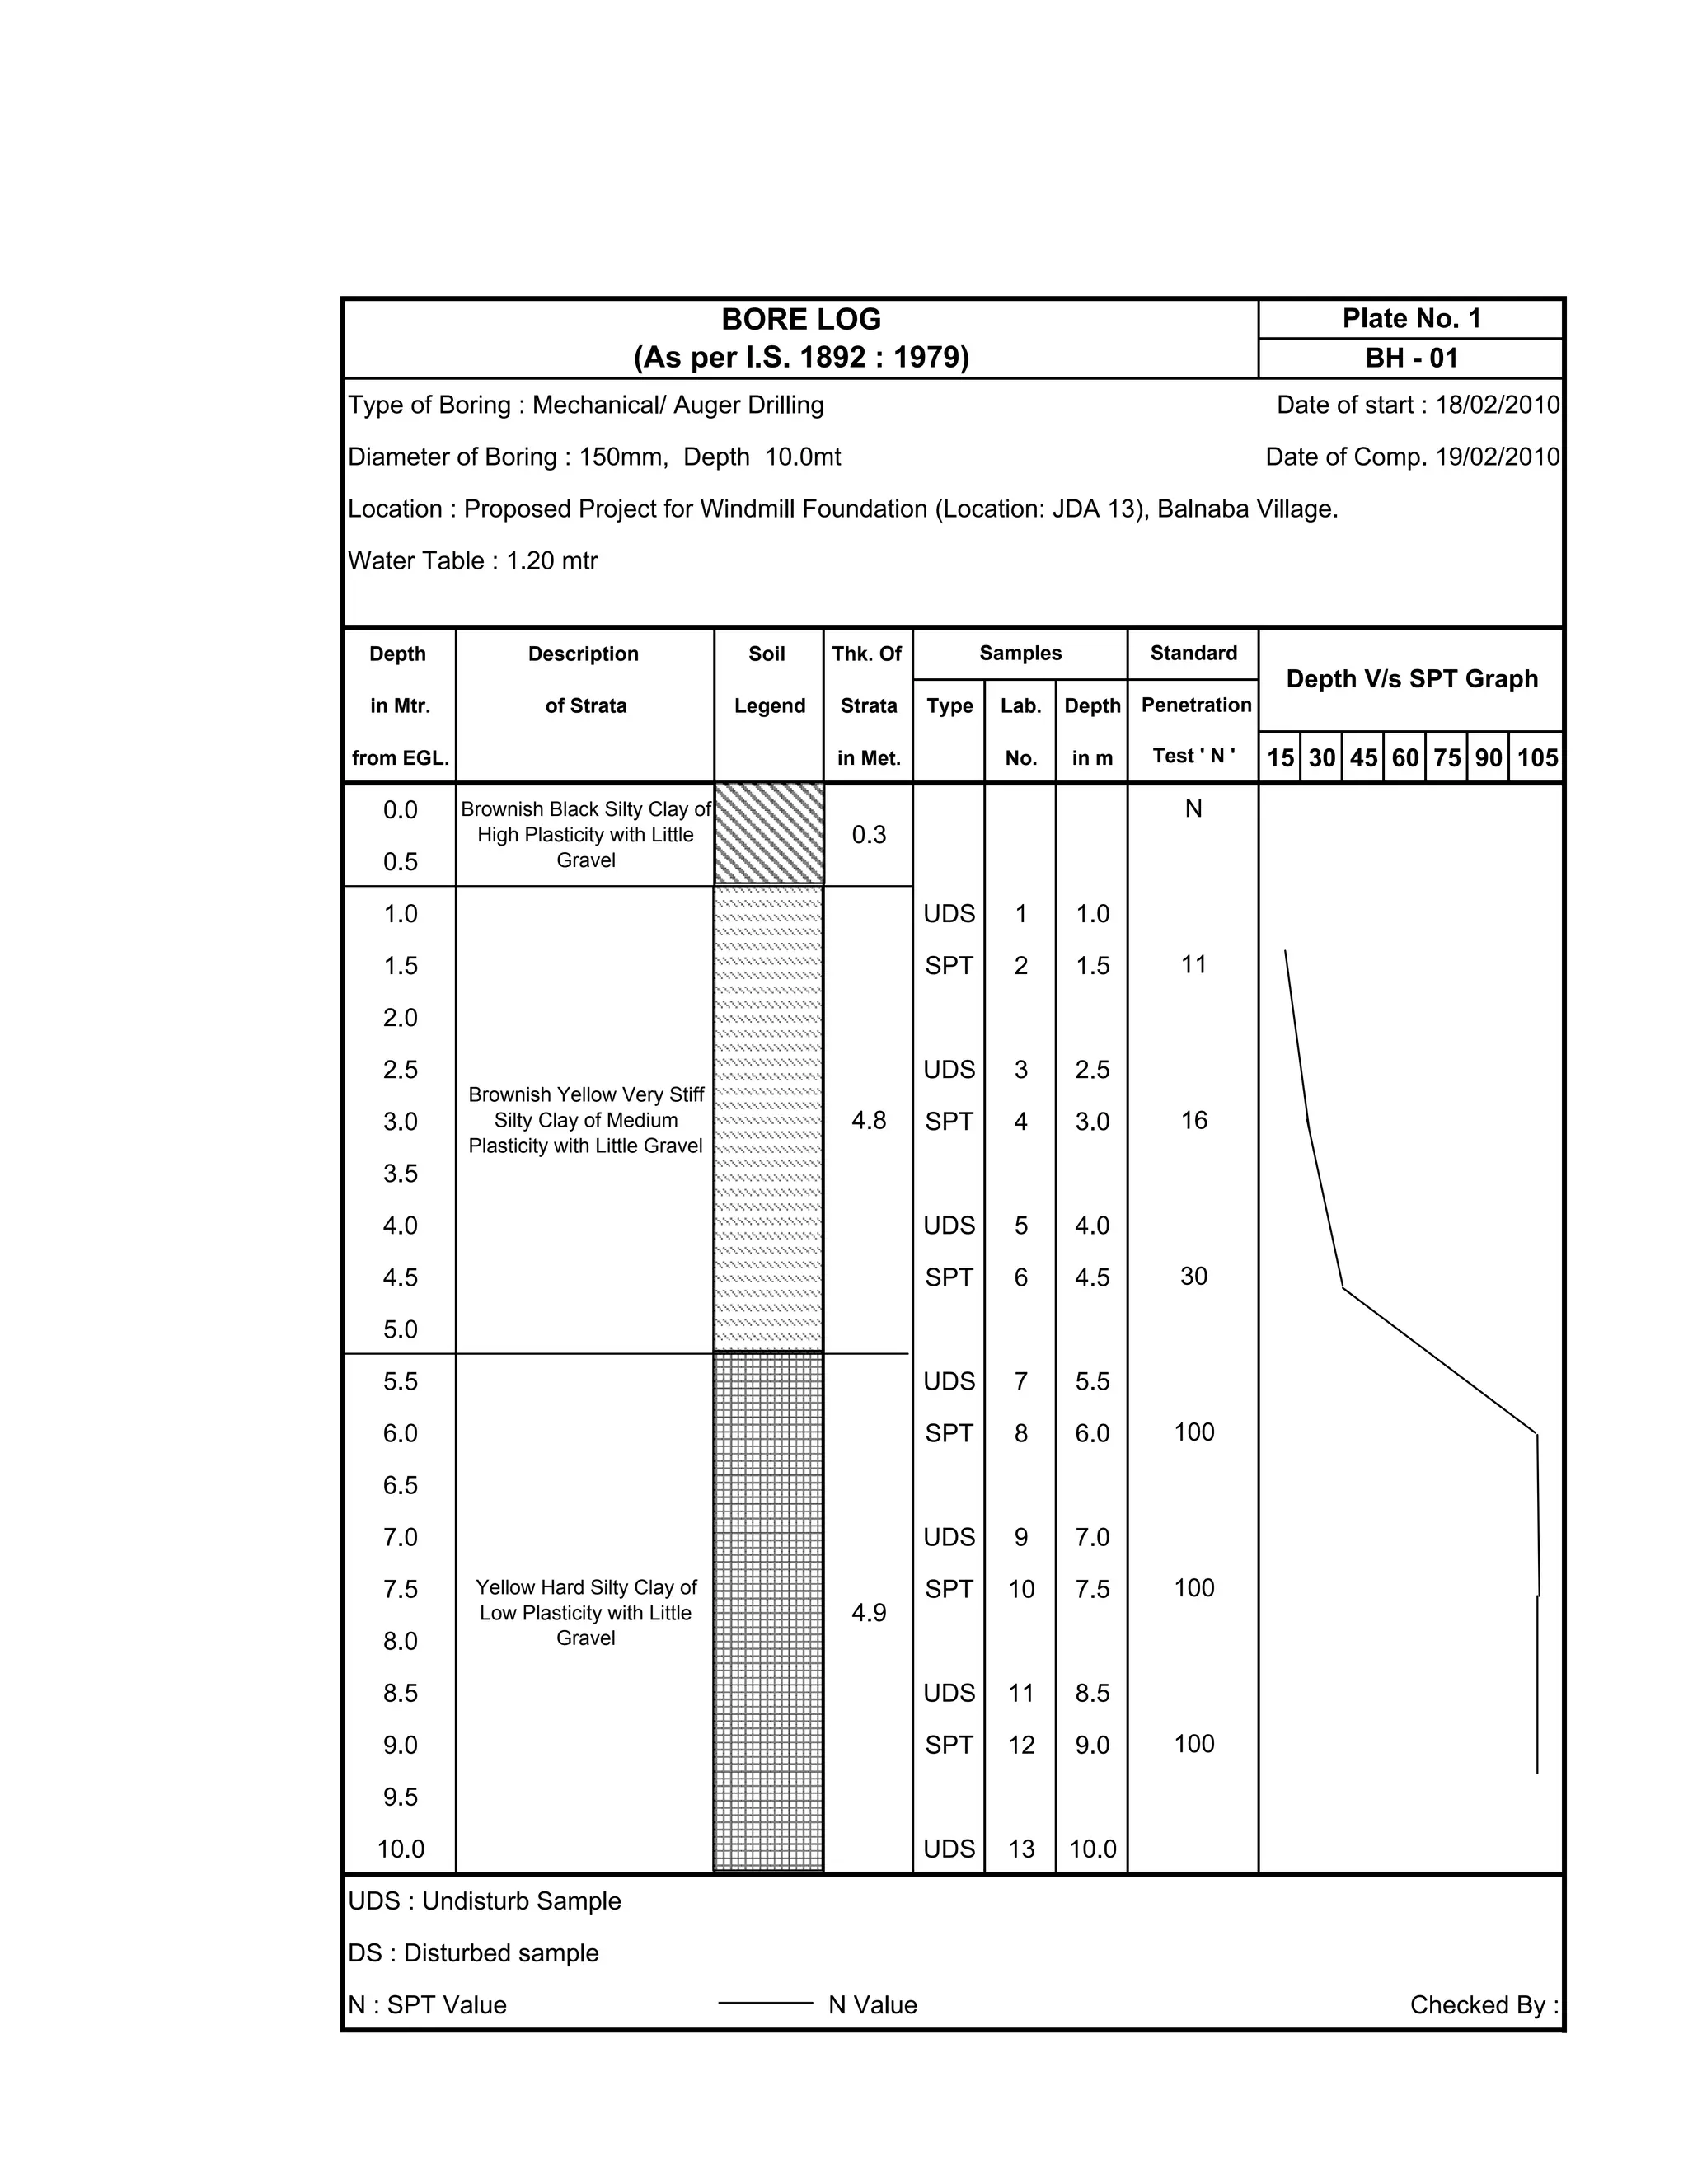
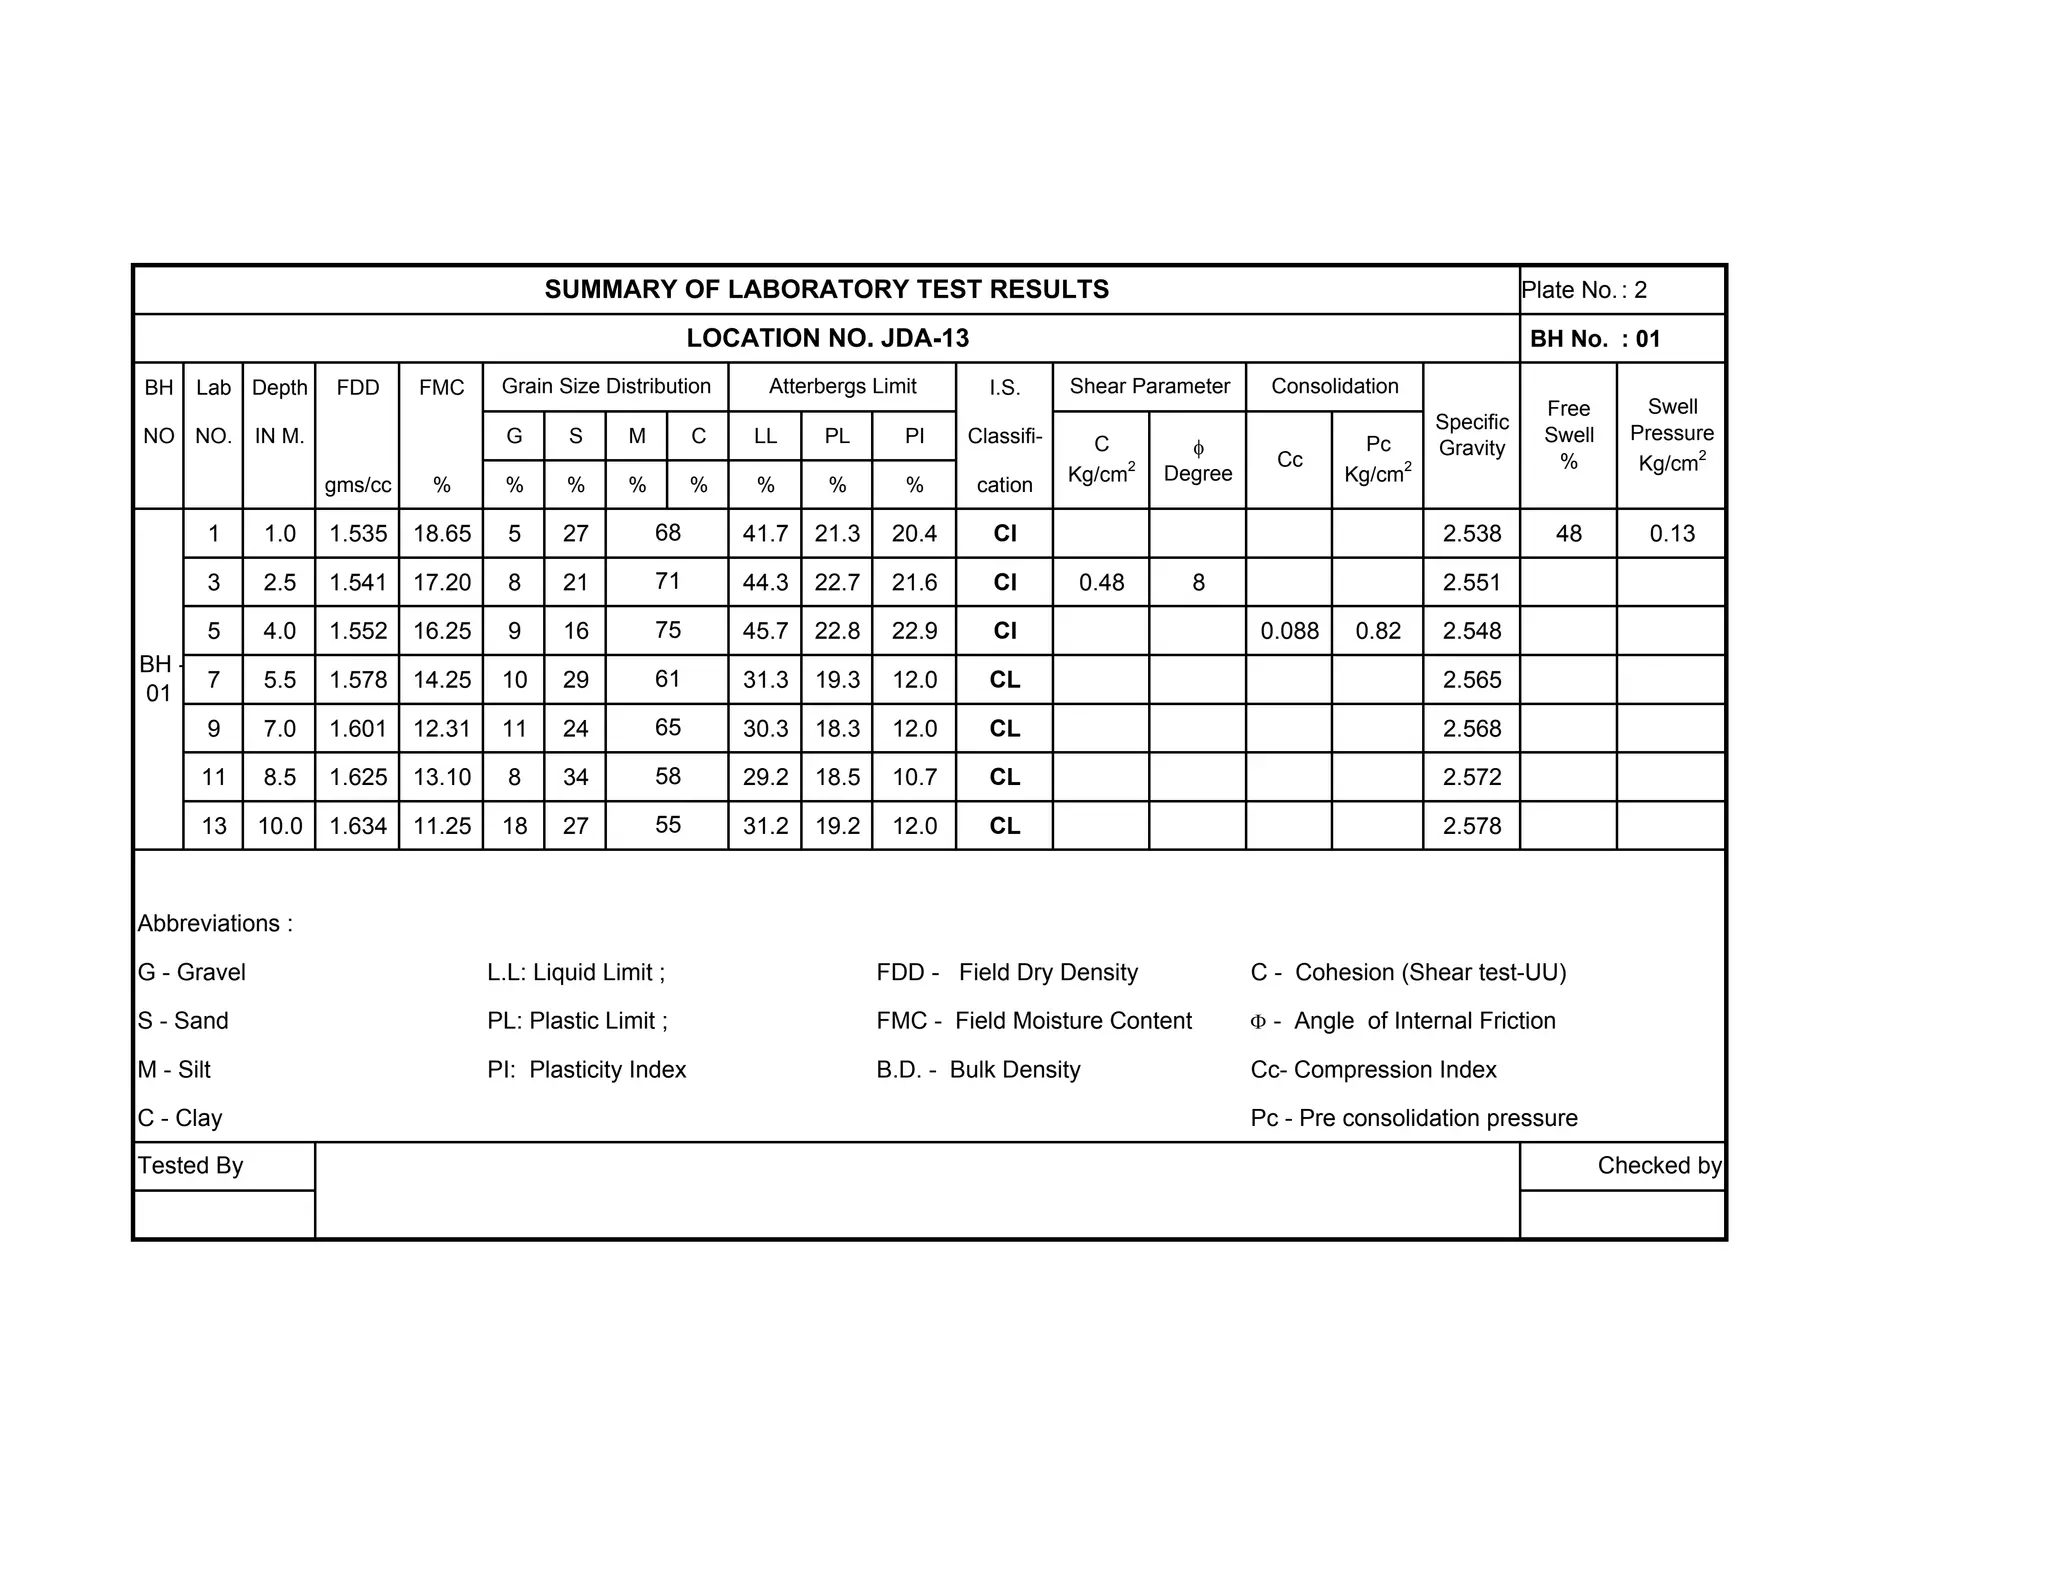
This soil investigation report summarizes subsurface exploration and laboratory testing conducted for a proposed wind turbine foundation project. One borehole was drilled to a depth of 10 meters and standard penetration and sampling tests were performed. Undisturbed and disturbed soil samples were collected and subjected to various laboratory tests to determine physical and engineering properties. These included dry density, particle size analysis, Atterberg limits, shear strength, consolidation, and free swell tests. The results were analyzed to evaluate the subsurface conditions and provide a safe bearing capacity for foundation design of the wind turbine.
Class notes of Geotechnical Engineering course I used to teach at UET Lahore. Feel free to download the slide show.
Anyone looking to modify these files and use them for their own teaching purposes can contact me directly to get hold of editable version.
Class notes of Geotechnical Engineering course I used to teach at UET Lahore. Feel free to download the slide show.
Anyone looking to modify these files and use them for their own teaching purposes can contact me directly to get hold of editable version.
Determination of minimum and maximum density of given soil specimen (Badarpur Sand).
1. Average minimum dry density of Badarpur sand came out to be 1.469 g/cm³ which is greater than Yamuna River sand by about 11%.
2. Average maximum dry density of Badarpur sand came out to be 1.679 g/cm³ which is greater than Yamuna River sand by about 15%.
3. By visual inspection, Badarpur sand was found ANGULAR in shape.
4. Γd, max and Γd, min values are not unique or intrinsic properties of coarse-grained soils and depend not only on material properties, but also on the variations in laboratory determination methods.
5. A potential for degradation of the soil grains, i.e., grain crushing, exists during testing depending on the method used to determine Γd, max. The amount of energy applied to the sand during compaction is an important factor. There is a need to investigate the issue further and possibly arrive at universally acceptable laboratory methods to determine these values, which address all possible influencing factors.
DETERMINATION OF UNCONFINED COMPRESSIVE STRENGTH OF SOILJaptyesh Singh
DETERMINATION OF UNCONFINED COMPRESSIVE STRENGTH OF SOIL in Foundation Engineering
INTRODUCTION
TERMINOLOGY
APPARATUS
SOIL SPECIMEN & ITS TYPES
THEORY
RELEVANCE OF THE EXPERIMENT
PROCEDURE
VIDEO
OBSERVATION
DISCUSSION
REMARKS
Sachpazis:Terzaghi Bearing Capacity Estimation in simple terms with Calculati...Dr.Costas Sachpazis
Terzaghi's soil bearing capacity theory, developed by Karl Terzaghi, is a fundamental principle in geotechnical engineering used to determine the bearing capacity of shallow foundations. This theory provides a method to calculate the ultimate bearing capacity of soil, which is the maximum load per unit area that the soil can support without undergoing shear failure. The Calculation HTML Code included.
Student information management system project report ii.pdfKamal Acharya
Our project explains about the student management. This project mainly explains the various actions related to student details. This project shows some ease in adding, editing and deleting the student details. It also provides a less time consuming process for viewing, adding, editing and deleting the marks of the students.
We have compiled the most important slides from each speaker's presentation. This year’s compilation, available for free, captures the key insights and contributions shared during the DfMAy 2024 conference.
Online aptitude test management system project report.pdfKamal Acharya
The purpose of on-line aptitude test system is to take online test in an efficient manner and no time wasting for checking the paper. The main objective of on-line aptitude test system is to efficiently evaluate the candidate thoroughly through a fully automated system that not only saves lot of time but also gives fast results. For students they give papers according to their convenience and time and there is no need of using extra thing like paper, pen etc. This can be used in educational institutions as well as in corporate world. Can be used anywhere any time as it is a web based application (user Location doesn’t matter). No restriction that examiner has to be present when the candidate takes the test.
Every time when lecturers/professors need to conduct examinations they have to sit down think about the questions and then create a whole new set of questions for each and every exam. In some cases the professor may want to give an open book online exam that is the student can take the exam any time anywhere, but the student might have to answer the questions in a limited time period. The professor may want to change the sequence of questions for every student. The problem that a student has is whenever a date for the exam is declared the student has to take it and there is no way he can take it at some other time. This project will create an interface for the examiner to create and store questions in a repository. It will also create an interface for the student to take examinations at his convenience and the questions and/or exams may be timed. Thereby creating an application which can be used by examiners and examinee’s simultaneously.
Examination System is very useful for Teachers/Professors. As in the teaching profession, you are responsible for writing question papers. In the conventional method, you write the question paper on paper, keep question papers separate from answers and all this information you have to keep in a locker to avoid unauthorized access. Using the Examination System you can create a question paper and everything will be written to a single exam file in encrypted format. You can set the General and Administrator password to avoid unauthorized access to your question paper. Every time you start the examination, the program shuffles all the questions and selects them randomly from the database, which reduces the chances of memorizing the questions.
HEAP SORT ILLUSTRATED WITH HEAPIFY, BUILD HEAP FOR DYNAMIC ARRAYS.
Heap sort is a comparison-based sorting technique based on Binary Heap data structure. It is similar to the selection sort where we first find the minimum element and place the minimum element at the beginning. Repeat the same process for the remaining elements.
Forklift Classes Overview by Intella PartsIntella Parts
Discover the different forklift classes and their specific applications. Learn how to choose the right forklift for your needs to ensure safety, efficiency, and compliance in your operations.
For more technical information, visit our website https://intellaparts.com
6th International Conference on Machine Learning & Applications (CMLA 2024)ClaraZara1
6th International Conference on Machine Learning & Applications (CMLA 2024) will provide an excellent international forum for sharing knowledge and results in theory, methodology and applications of on Machine Learning & Applications.
DESIGN AND ANALYSIS OF A CAR SHOWROOM USING E TABS
Soil investigation jda_13_194
1. Page 1 of 14
SOIL INVESTIGATION REPORT
PROJECT
GEOTECHNICAL INVESTIGATION FOR PROPOSED
WINDMILL FOUNDATION AT LOCATION JDA-13 AT
BALNABA VILLAGE, BHUJ-KUTCH
CLIENT
M/S SUZLON INFRASTRUCTURES SERVICES LTD
PROJECT NO.
GTH/SRBH-2010 /SUZLON/JDA-13, DT: 08/04/2010
2. Page 2 of 14
INDEX
SR. NO. CONTENT PAGE NO.
1. INTRODUCTION 3 of 14
2 SUB SURFACE EXPLORATION 3 of 14
3. LABORATORY TESTING 5 of 14
4. DISCUSSION ON FIELD AND LABORATORY TESTS 11 of 14
5. SAFE BEARING CAPACITY 12 of 14
6 CONCLUSIONS AND RECCOMENDATIONS 14 of 14
7. ANNEXURES
I BORELOG Plate - 1
II SUMMARY OF TEST RESULTS Plate - 2
III SAFE BEARING CALCULATION Plate – 3
IV SETTLEMENT ANALYSIS CALCULATION Plate - 4
3. Page 3 of 14
1.0 INTRODUCTION
Sub surface investigation and laboratory tests for proposed Wind Foundation project
was referred to us by Suzlon Infrastructures Services Ltd.
The objective of the exploration work was to determine the probable sub surface
conditions such as stratification, denseness or hardness of the strata, position of ground
water table etc. and to evaluate probable range of safe bearing capacity for the structure.
To fulfill the objective, the work carried out is comprises of:
• Drilling one borehole up to the depth of 10.0m below existing ground level in order to
know the sub surface stratification, conducting necessary field tests and to collect
disturbs and undisturbed soil samples for laboratory testing.
• Testing soil samples in the laboratory to determine its physical and engineering
properties of the soil samples, and
• Analyzing all field and laboratory data to evaluate safe bearing capacity of the soil for
given foundation sizes and necessary recommendations for foundation design and
construction.
The structure is located at JDA-13 Location near Balnaba Village, Bhuj
2.0 SUB SURFACE EXPLORATION
The actual investigation work was started on 18/02/2010 and was completed on 19/02/2010.
2.1 Drilling
One borehole of 150mm diameter is drill up to the depth of 10.0m. Where caving of the
borehole occurred, casing was used to keep the borehole stable. The work was in general
accordance with IS: 1892 – 1979. The borehole is located at the center of the wind mill
foundation.
2.1.1 Disturbed Samples: Disturbed representative samples were collected, logged,
labelled and placed in polythene bags.
4. Page 4 of 14
2.1.2 Undisturbed Samples: Undisturbed soil samples are collected in 100 mm diameter
thin walled sampler (Shelby tube) from the borehole. The sampler used for the sampling
had smooth surface and appropriate area ratio and cutting edge angle thereby minimizing
disturbance of soil during sampling. Samples are logged and labelled properly and transfer
to the laboratory for further testing.
2.1.3 Water Table: Water table was encountered during the sub soil exploration work carried
out in the month of February 2011.
2.1.4 Method of Sampling: Sampler is coupled together with a sampler head to form a
sampling assembly. The sampler head provide a non-flexible connection between the
sampling tube and the drill rods. Vent holes are provided in the sampler head to allow
escape of water from the top of sampler tube during penetration. The sampling tubes are
made free from dust and rust. Coating of oil is applied on both sides to obtain the
undisturbed samples in best possible manner.
The sampler is then lowered inside the bore hole on a string of rods and driven to a pre-
determined level. On completion of driving the sampler is first rotated within the
borehole to shear the soil sample at bottom and then pulled out. Upon removal of the
sampling tubes, the length of sample in the tube is recorded. The disturbed material in the
upper end of the tube, if any, is completely removed before sealing.
The soil at the lower end of the tube is trimmed to a distance of about 10 to 20 mm. After
cleaning and inserting an impervious disc at each end, both ends are sealed. The empty
space in the sampler, if any, is filled with the moist soil, and the ends covered with tight
wrapper. The identification mark is then made on each sample.
2.2 Standard Penetration Test
The standard penetration tests are conducted in each bore as per IS: 2131: 1981
(Reaffirmed 2002). The split spoon sampler resting on the bottom of bore hole is allowed to
sink under its own weight, then the split spoon sampler is seated 15 cm with the blows of
hammer falling through 750mm. The driving assembly consists of a driving head and a 63.5
kg weight. It is ensured that the energy of the falling weight is not reduced by friction between
the drive weight and the guides or between ropes. The rods to which the sampler is attached
5. Page 5 of 14
for driving are straight, tightly coupled and straight in alignment. Thereafter the split spoon
sampler is further driven by 30cm. The number of blows required to drive each 15cm
penetration is recorded. The first 15cm of drive considered as seating drive. The total
blows required for the second and third 15cm penetration is termed as a penetration
resistance - N value. The N-values for each bore hole are given in bore logs attached as
Plate 1.
3.0 LABORATORY TEST
The laboratory tests on soil samples were started immediately after the receipt of the same in
the laboratory. Following laboratory tests are carried out to determine the physical and
engineering properties of undisturbed and disturbed soil samples.
1. Dry density and moisture content (IS 2720 part – 2 & 29)
2. Particle size analysis – (IS 2720 part – 4 1985)
3. Atterberg's limit - (IS 2720 part – 5 1985)
4. Specific gravity - (IS 2720 part – 3/sec2 1980)
5. Shear test - (IS 2720 part – 11 1986)
6. Consolidation test – (IS 2720 part – 15 1986)
7 Free swell and Swell pressure test - (IS 2720 part – 40 1977, part – 41 1977))
All laboratory tests are carried out as per the respective Indian Standards.
3.1 Field Dry Density & Natural Moisture Content
The weight of undisturbed soil sample with sampler (Shelby tube) is determined after
removing paraffin wax and loose soil. The total length of soil sample recovery is determined
after deducting empty length from the total length of sampler. The volume of soil mass
retained in sampler is thus determined from the known inside diameter of sampler and total
length of soil mass. The soil mass is then removed and the average moisture content is
determined by keeping the soil sample along with crucible in oven at 100-105 degree
centigrade for 24 hours. The empty weight of the sampler is then found out. From the total
weight of sampler with soil mass, the weight of empty sampler is deducted. The field density
is then found out as
Field density (bulk)
masssoilofvolume
masssoilofweight
=
6. Page 6 of 14
And, Field dry density
w1
densitybulkField
+
=
Where w is water content.
3.2 Particle Size Analysis
The sieve analysis is carried out in accordance with IS: 2720 (Pt.IV). The results are
presented in the form of Grain size distribution curve.
Representative soil sample is obtained from the bulk soil sample collected or received from
site by method of coning and quartering. Quantity of soil taken will be dependent on the
maximum size of particle size present in the soil. Sieve analysis is conducted in two parts:
1) Soil fraction retained on 4.75mm ISS
Soil portion retained on 4.75 ISS is weighed. The sample is then separated into various
fractions by sieving through the following sieves:
100, 75, 19 and 4.75 mm ISS
While sieving through each sieve, sieve is agitated so that sample rolls in irregular motion
over the sieve, at no time the particles are pushed through; Care is also taken to see that no
individual soil particles are broken, though particles adhering one another are rubbed by
rubber pestle when required. Care is also taken not to over load the sieve beyond the
permitted maximum load for respective sieve.
The mass of the material retained on each sieve is recorded The percentage of soil retained
on each sieve is then calculated on the basis of the total mass of soil taken and from these
results, the percentage passing through each sieve is calculated.
2) Soil fraction passing 4.75 ISS
The portion of the soil passing 4.75 mm ISS is oven dried at 105 to 110 c. The portion is
coned & quartered to obtain required representative quantity of the material. The material is
weighed and placed in tray/bucket filled with water for soaking and loosening the adhered
cohesive materials. The soaked soil specimen is then washed on 75 micron IS Sieve until
7. Page 7 of 14
the water passing the sieve is almost clear. The material retained on 75 micron IS Sieve is
then transferred in a tray, dried in oven.
Sieve analysis is then conducted on a nest of sieves (viz. 2 mm, 425 and 75 micron ISS)
either by hand or by using mechanical sieve shaker. The fraction retained on each of the
sieves is weighed separately and masses recorded. Cumulative mass of soil fraction
retained on each sieve is then calculated The weights are then converted into cumulative
percentage retained and passing on the basis of the mass of the sample passing 4.75 ISS
taken. The combined gradation on the basis of the total sample taken for analysis is finally
calculated.
3.3 Atterberg’s Limit
Liquid and plastic limits are determined by using procedure given in IS: 2720 (Pt-V). The
results are given in result sheet. The weight of cone plus rod and plate is 148 gm. A soil
sample weighing about 150gm from the thoroughly mixed portion of soil passing 425 micron
was used for testing. The thoroughly wet soil paste is transferred to the cylindrical trough
150mm diameter and 50mm high of the cone penetrometer apparatus and leveled up to the
top of trough. The penetrometer is adjusted such that the cone point just touches the surface
of the soil paste in trough. The scale of the penetrometer is adjusted to zero and the vertical
rod is released so that the cone is allowed to penetrate into the soil paste under its own
weight. The penetration is noted after 30 sec. from the release of the cone. The reading is
considered if the penetration reading is between 20mm and 30 mm. The moisture content of
the soil paste corresponding to this is determined. The liquid limit of the soil which
corresponds to the moisture content of a paste which would give 25 mm penetration of the
cone is determined using formula:
WLL = Wx + 0.01 (25 - W) (Wx + 15)
For determination of plastic limit, a soil sample weighing at least 20 gm from the soil
sample passing 425micron IS sieve is thoroughly mixed with water such that it can be
easily moulded with fingers. A ball is formed with about 8 to 10 gm of this soil & is rolled
between the fingers and the glass plate with just sufficient pressure to roll the mass into a
thread of uniform diameter of 3mm throughout its length. The soil is then kneaded together to
a uniform mass and rolled again. The process is continued until the thread crumbles. The
8. Page 8 of 14
pieces of crumbled soil thread are collected and moisture content is determined and reported
as plastic limit.
3.4 Specific Gravity
The specific gravity of soil solids is determined by a 50ml density bottle. The weight (W1) of
the empty dry bottle is taken first. A sample of oven-dried soil about 10-20 g cooled in a
desiccator, is put in the bottle, and weight (W2) of the bottle and the soil is taken. The
bottle is then filled with distilled water gradually removing the entrapped air either by applying
vacuum or by shaking the bottle. The weight (W3) of the bottle, soil and water (full up to the
top) is then taken. Finally the bottle is emptied completely and thoroughly washed and clean
water is filled to the top and the weight (W4) is taken.
Specific Gravity (G) =
( )
( ) ( )4312
12
WWWW
WW
−−−
−
3.5 Shear Test
Tri-axial (undrained) tests are carried out to determine the shear parameters. The shear
tests are carried out in accordance with IS: 2720 (pt. X, XI, XII and XIII) on saturated
samples. For unconsolidated undrained tri-axial compression test, the undisturbed soil
specimen having diameter 38 mm and height to diameter ration 2 is prepared and placed on
the pedestal of the tri-axial cell. The cell is then assembled with the loading ram and then
placed in the loading machine. The cell fluid is admitted to the cell and the pressure is raised
to the desired value. An initial reading of the gauge measuring axial compression of the
specimen is recorded. The test is then commenced and sufficient number of simultaneous
readings of load and compression measuring gauge being taken. The test is continued until
the maximum value of the stress has been passed or until an axial strain of 20 per cent has
been reached. Additional tests are carried out on identical specimen at confining pressure of
1 kg/cm2
, 2 kg/cm2
and 3 kg/cm2
. The shear parameters are obtained from the plot of Mohr
circles.
Direct shear test is carried out using shear box with the specimens (60mmx60mm).
Specimen with plain grid plate at the bottom of the specimen and plain grid plate at the
top of the specimen is fitted into position in the shear box housing and assembly
9. Page 9 of 14
placed on the load frame. The serrations of the grid plates are kept at right angle to the
direction of shear. The loading pad is kept on the top grid plate. The required normal stress
is applied and the rate of longitudinal displacement/shear stress application so adjusted that
no drainage can occur in the sample during the test (1.25mm/min). The upper part of the
shear box is raised such that a gap of about 1mm is left between the two parts of the box.
The test is conducted by applying horizontal shear load to failure or to 20 percent longitudinal
displacement whichever occurs first. The test is repeated on identical specimens.
3.6 Consolidation Test
The consolidation tests were carried out on undisturbed soil specimen in order to
determine the settlement characteristics of soil at different depths. The tests were
conducted in accordance to IS: 2720 (Pt-XV).
An undisturbed soil specimen is extruded to the consolidation ring of 60mm diameter. The
edge is trimmed carefully such that the sample flushes with the top and bottom edges of the
ring. The thickness of the specimen is measured and the weight is recorded. The bottom
porous stone is then centered on the base of the consolidation cell.
The specimen is placed centrally between the bottom porous stone and the upper porous
stone. A filter paper is provided in-between specimen and porous stones. Then the loading
cap is placed on the top. The consolidometer is placed in position in the loading device and
suitably adjusted. The dial gauge is then clamped into position for recording the relative
movement between the base of the cell and the loading cap. A seating pressure of 0.05
kg/cm2
is applied to the specimen. The cell is kept filled with water. After 24 hours the test is
continued using a loading sequence on the soil specimen of 0.25, 0.5, 1.0, 2.0, 4.0,
and 8.0 kg/cm2
. For each loading increment after application of load, readings of the dial
gauge is taken using time sequence 0, 0.25, 1, 2.25, 2, 6.25, 9, 16, 25, 36, 49 ... up to 24
hrs. From the observations of all incremental pressure, void ratio versus log (pressure) curve
is obtained. The slope of the straight line portion is designated as compression index cc.
3.7 Differential Free Swell Test
In order to determine the swelling characteristics of the soil, differential free swell test is
carried out. An oven dried soil sample, 10 gm passing through 425 micron is poured in two
10. Page 10 of 14
100 ml graduated cylinders. One cylinder was filled with distilled water and another with
kerosene up to 100 ml mark. After removal of entrapped air, sample was allowed sufficient
time to attain equilibrium state of volume. The final volume of soil in each cylinder was
recorded.
100
keroseneinvolumesoil
keroseneinvolumesoil-in watervolumeSoil
×=Sp
Where Sp = Differential Free swell (%)
The swell pressure tests are carried out at field dry density with zero percent moisture
content and by constant volume method. An oven dry soil specimen is compacted into the
specimen ring with the specimen kept in between two porous stone saturated in boiling water
providing a filter paper between the soil specimen and the porous stones. The loading block
is then positioned centrally on the top of the porous stone. The assembly is then placed on
the platen of the loading unit. The load measuring proving ring is attached to the load frame
and placed in contact with the consolidation cell without any eccentricity. A direct strain
measuring dial gauge is fitted to the cell. The specimen is then inundated with distilled water
and allowed to swell. The initial reading of the proving ring is noted. The swelling of the
specimen with increasing volume is obtained in the strain measuring load gauge. The
specimen is kept at constant volume by adjusting the strain dial gauge always at original
reading. This adjustment is done at every 0.1mm of swell or earlier. The swell pressure is
then calculated from the difference between the final & initial dial readings of the proving ring.
11. Page 11 of 14
4.0 DISCUSSION ON FIELD AND LABORATORY TESTS:
Sub soil Stratification: The field data and laboratory classification reveals in general, the
proposed site is having single major layer up to depth of investigation i.e. 10.0m.
Layer I is Brownish Black Silty Clay of High Plasticity with Little Gravel
Layer II is Brownish Yellow Very Stiff Silty Clay of Medium Plasticity with Little Gravel
Layer III is Yellow Hard Silty Clay of Low Plasticity with Little Gravel
Standard Penetration Test: This test was conducted during the course of investigation
work. From the bore logs it is inferred that the SPT ` N ' value increases with depth as shown
below. Depth Vs N value graph is shown in Bore log.
Layer / Thk. Of Strata
in mt.
Identification
Range of
N
Consistency
II / From 0.3m to 5.1 m Brownish Yellow Silty Clay 11-30 Very Stiff
III / From 5.1m to
10.0m
Yellow Silty Clay >100 Hard
12. Page 12 of 14
5.0 SAFE BEARING CAPACITY:
Looking to the site conditions and sub soil stratification encountered and type of proposed
project RCC Circular Raft Foundation is recommended along with safe bearing capacity at
different depth. Intensity of bearable load determined as soil bearing capacity (SBC) and soil
bearing pressure (SBP) on soil.
SBC BASED ON SHEAR: The ultimate net bearing capacity is evaluated after taking into
consideration of shape factor and depth factor of the foundation in accordance with I.S.
6403-1981. The net bearing capacity worked out using the following equation. The sample
calculation of Soil Bearing Capacity is attached in the report as Plate No.3
Q = C Nc Sc dc + q (Nq -1) Sq dq + 0.5 B γ Nr Sr dr
Where, C = Cohesion
q = Overburden Pressure
γ = Density
Β = Width of the Footing
ΝγNq,Nr = Bearing capacity Factor
Sc,Sq,Sr = Shape Factor
dc,dq,dr = Depth Factor
5.1 Design Parameters for Shear and Settlement Criteria
Following parameters are adopted for the evaluation of bearing capacity for shallow
foundation.
Properties
Cohesion (kg/cm2
) 0.48
Angle of Internal Friction (Degree) 8
Dry Density ( in gm/cc) 1.541
Specific Gravity 2.551
Coefficient of volume change (mv) 0.0128
Factor of Safety 2.5
Void ratio, e (Computed) 0.655
Type of Shear Failure Considered Intermediate
13. Page 13 of 14
Thus, intermediate shear failure was considered for safe bearing capacity computation. The
net safe bearing capacity for various sizes of individual rigid footings having vertical static
load intensity is evaluated as in Table -I. Settlement computed from Coefficient of volume
change ‘mv’ for over consolidated clay as per I.S.8009, Part I for 100mm permissible
settlement as shown in Plate-4.
TABLE- I, SAFE BEARING CAPACITY AND SAFE BEARING PRESSURE
FOUNDATION DETAILS
Type
Size
(mtr.)
Depth
(mtr.)
Safe Bearing
Capacity (SBC)
in t/m2
Safe Bearing
Pressure for 100
mm permissible
(SBP) settlement
in t/m2
Recommended
value of SBC for
design of
foundation
in t/m2
2.25 16.30 16.30
2.50 16.48 16.48
RCC
Circular
Raft
Footing
Dia=16.0
3.00 16.85
+19
16.85
14. Page 14 of 14
6.0 CONCLUSIONS & RECOMMENDATIONS
1. Sub soil stratification of proposed site up to depth of investigation is as below.
From 0.0 to 0.3m: Brownish Black Silty Clay of High Plasticity with Little Gravel
From 0.3 to 5.1m: Brownish Yellow Very Stiff Silty Clay of Medium Plasticity with Little
Gravel
From 5.1 to 10.0m: Yellow Hard Silty Clay of Low Plasticity with Little Gravel
2. Looking to the proposed type of project RCC Circular Raft footing is recommended
along with their Safe Bearing Capacities considering factor of safety of 2.5 as shown
in Table - I.
3 Safe Bearing pressure calculated for 100mm permissible as per I.S 8009 Part I for
over consolidated clay as shown in Plate-4
4 Water table was considered in the analysis of SBC.
5 Suitability of Soil for back filling: The top layer of soil is of High swelling characteristic,
which is not suitable for back filling purpose.
For GEO TEST HOUSE
(Technical Manager)
15. Type of Boring : Mechanical/ Auger Drilling Date of start : 18/02/2010
Diameter of Boring : 150mm, Depth 10.0mt Date of Comp. 19/02/2010
Location : Proposed Project for Windmill Foundation (Location: JDA 13), Balnaba Village.
Water Table : 1.20 mtr
Depth Description Soil Thk. Of
in Mtr. of Strata Legend Strata Type Lab. Depth
from EGL. in Met. No. in m 15 30 45 60 75 90 105
0.0
0.5
1.0 UDS 1 1.0
1.5 SPT 2 1.5
2.0
2.5 UDS 3 2.5
3.0 SPT 4 3.0
3.5
4.0 UDS 5 4.0
4.5 SPT 6 4.5
5.0
5.5 UDS 7 5.5
6.0 SPT 8 6.0
6.5
7.0 UDS 9 7.0
7.5 SPT 10 7.5
8.0
8.5 UDS 11 8.5
9.0 SPT 12 9.0
9.5
10.0 UDS 13 10.0
UDS : Undisturb Sample
DS : Disturbed sample
N : SPT Value N Value Checked By :
30
100
100
100
11
16
Samples
Test ' N '
BORE LOG
(As per I.S. 1892 : 1979)
NBrownish Black Silty Clay of
High Plasticity with Little
Gravel
0.3
Plate No. 1
Standard
Depth V/s SPT Graph
Penetration
BH - 01
Yellow Hard Silty Clay of
Low Plasticity with Little
Gravel
Brownish Yellow Very Stiff
Silty Clay of Medium
Plasticity with Little Gravel
4.8
4.9
16. Plate No.: 2
BH No. : 01
BH Lab Depth FDD FMC I.S.
NO NO. IN M. G S M C LL PL PI Classifi-
gms/cc % % % % % % % % cation
1 1.0 1.535 18.65 5 27 41.7 21.3 20.4 CI 2.538 48 0.13
3 2.5 1.541 17.20 8 21 44.3 22.7 21.6 CI 0.48 8 2.551
5 4.0 1.552 16.25 9 16 45.7 22.8 22.9 CI 0.088 0.82 2.548
7 5.5 1.578 14.25 10 29 31.3 19.3 12.0 CL 2.565
9 7.0 1.601 12.31 11 24 30.3 18.3 12.0 CL 2.568
11 8.5 1.625 13.10 8 34 29.2 18.5 10.7 CL 2.572
13 10.0 1.634 11.25 18 27 31.2 19.2 12.0 CL 2.578
Abbreviations :
G - Gravel L.L: Liquid Limit ; FDD - Field Dry Density C - Cohesion (Shear test-UU)
S - Sand PL: Plastic Limit ; FMC - Field Moisture Content Φ - Angle of Internal Friction
M - Silt PI: Plasticity Index B.D. - Bulk Density Cc- Compression Index
C - Clay Pc - Pre consolidation pressure
Swell
Pressure
Kg/cm
2
Shear Parameter Consolidation
Specific
Gravity
Free
Swell
%
C
Kg/cm
2
φ
Degree
SUMMARY OF LABORATORY TEST RESULTS
LOCATION NO. JDA-13
Cc
Grain Size Distribution Atterbergs Limit
71
Pc
Kg/cm
2
61
68
BH -
01
58
55
65
Tested By Checked by
75
17. Shape of footing = Sample Calculation
Depth of footing D = 2.25 m
Width of footing B = 16.00 m
Length of footing L = - m
Cohesion C = 0.48 kg/sq cm
Angle of Int.Fric φ = 8 degrees
Specific Gravity G = 2.551
Inclination Angle α = 0 degrees
Water Table Occurrence 0.5 Water table Considered
Dry Density Yd = 1.541 d, s, i depth shape inclination
Sat.density Ysat = 1.937 factor factor factor
Submerged density= 0.937 dc, sc, ic 1.032 1.000 1.000
Factor of Safety = 2.5 dq, sq, iq 1.000 1.000 1.000
Void Ratio eo = G x Yw -1 d γ ,s γ ,i γ 1.000 1.000 1.000
Yd
= 0.6554 it is > 0.55 & < 0.75
hence it is an intermediate shear failure
Φ ' = Tan -1
(0.67 tan Φ)
= 5.38
Nc'' = 7.092 Nc' = 0.00 Nc = 0.000
Nq'' = 1.861 Nq' = 0.00 Nq = 0.000
N γ '' = 0.699 N γ ' = 0.00 N γ = 0.000
qu = cNcScdcic + q(Nq-1) Sqdqiq + 0.5 Bγ N γ S γ d γ i γ W'
for general shear failure
= 0.00 qs = 0.00 t/m
2
qu = 0.67cN'cScdcic + q(N'q-1) Sqdqiq + 0.5 Bγ N' γ S γ d γ i γ W'
for local shear failure
= 0.00 qs = 0.00 t/m
2
qu = cN''cScdcic + q(N''q-1) Sqdqiq + 0.5 Bγ N'' γ S γ d γ i γ W'
for intermediate shear failure
= 40.75 t/m
2
qs = 16.30 t/m
2
SAFE BEARING CAPACITY OF SOIL
Plate - 3
Raft
18. G.L PLATE : 4
Sample Calculation
D in m = 2.25
B = 16.00 mtr Width of Foundation
H = 7.75 mtr Total Thickness of compressible strata
L= 16.00 mtr Length of foundation
Assume pressure 19.84 t/m2
L/B = 1
1.98 kg/cm2
D / LB = 0.141
Zi Z = 2 x Zi B / Z L/Z C Influence factor Δ P
in m in m I = 4 x C = p x I H
Kg/cm2
cm
3.88 7.75 2.06 2.06 0.235 0.94 1.865 775 0.013 18.50 0.965 0.800 0.700 100.00
Total Settlement, mm 100.00
at 19.84 t/m2
pressure, settlement arrived is 100.00mm, which is equal to 100mm permissible settlement.
hence SBP recommended 19.84 t/m2
.
VERY SENSITIVE CLAYS ( SOFT ALLUVIAL, ESTUARINE AND MARINE CLAYS )
NORMALLY CONSOLIDATED CLAYS
OVER CONSOLIDATED CLAYS
HEAVILY OVERCONSOLIDATED CLAYS 0.20 TO 0.50
Depth factor considered from Fig. 12 of IS : 8009 Part-1
COEFFICIENTS FOR SOIL FACTOR AS PER IS : 8009 ( Part I ) - 1976
1.00 TO 1.20
0.70 TO 1.00
0.50 TO 0.70
SETTLEMENT ANALYSIS OF SOIL
Soil
factor
Final
settlement,
in mm
mV,
cm2
/kg
Settlement,
mv x Δp x H
cm
Depth
factor
Rigidity
factor