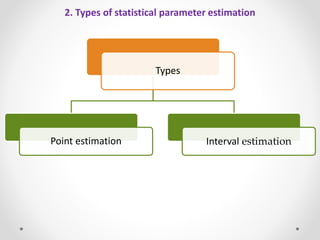
PES
MODERN COLLEGE OF PHARMACY (Ladies)
MOSHI, PUNE
Savitribai Phule Pune University
M.PHARM
Semester- II
By
Mrs. Sneha Patil
Assistant Professor
Dept. of Pharmaceutics
Statistical parameter
estimation
Content
1. Introduction
2. Types
3. Point estimation
4. Interval estimation
5. Reference
1. Introduction
 Once the model functional form has been decided upon and the
experimental data have been collected, a value for the model
parameters (point estimation) and a confidence region for this value
(interval estimation) must be estimated from the available data
 One of the main tasks of statistical interference is the estimation of
population parameters from the available sample statistics which are
also called estimator
 From the sample data we can estimate the population data like
population mean
2. Types of statistical parameter estimation
Types
Point estimation Interval estimation
3. Point estimation
 Point estimation requires the use of sample data to measure a single value
that acts as an unknown population parameter's 'best estimate‘
 Generally, data from a sample is used to calculate the population data in the
inferential statistics
 Sample mean is the unbiased estimate of the population mean (u)
 Maximum-likelihood estimation (MLE) uses the mean and variance as
parameters and seeks parametric values that make the observed outcomes
the most likely
 MLE is a method of estimating parameters of a statistical model
 It provides estimates of a parameter when applied to a data set and with a
given statistical model
 In general, the maximum likelihood approach selects the set of values of
the model parameters for a fixed data set and the underlying statistical
model that maximizes the probability function
 MLE provides a unified estimation method, which is well defined in the case
of normal distribution and several other problems
 MLE are not suitable for certain complex problems
Point estimation continue.…
 Linear least square method is another popular estimation approach
 Linear least squares is a method that suits a mathematical model
with data where the desired value is expressed linearly for any data
point in terms of the unknown model parameters
 To summarize the data, understand the mechanism of the system and
to estimate unobserved values, the resulting fitted model can be
used
 Mathematically, the problem of approximately solving an over-
determined set of linear equations is linear least squares, where the
best approximation is defined as minimizing the number of square
differences between the values of the data and their corresponding
modelled values
 The assumed function is linear to the parameters to be estimated,
the approach is called linear least squares
4. Interval estimation
 This is the estimation of a population parameter specified by two
values (lower and upper)
 This is better than the point estimation because this indicates range
or precision of an estimate
 Upper confidence limit (UL) and Lower confidence limit (LL) are
present in the confidence interval of the interval estimation
 A probability is assigned that this interval contains true population.
We can't get the exact population parameter if we report or have a
point estimate
 Population and sample size influence the width of confidence interval
 It is suggested to have a certain range of confidence in our estimate
and the statistic should lie within the confidence range
Interval estimation continue.…
 The most prevalent forms of interval estimation are Confidence
intervals (frequentist method) and Credible intervals(Bayesian
Method)
 A probability is assigned to the hypothesis in a Bayesian method
 In contrary to the Bayesian method, in a Frequentist method a
hypothesis is tested without assigning a probability to the hypothesis
4. Reference
 Karri V V S Narayana Reddy, K Gowthamarajan, Arun Radhakrishnan,
Arun Radhakrishnan. A Textbook of Computer aided drug
development. S. vikas and company, PV Publication; 2021 edition; Pg.
no. 270, 271
Unit I - Statistical parameter estimation.pptx

Unit I - Statistical parameter estimation.pptx

  • 1.
    PES MODERN COLLEGE OFPHARMACY (Ladies) MOSHI, PUNE Savitribai Phule Pune University M.PHARM Semester- II By Mrs. Sneha Patil Assistant Professor Dept. of Pharmaceutics Statistical parameter estimation
  • 2.
    Content 1. Introduction 2. Types 3.Point estimation 4. Interval estimation 5. Reference
  • 3.
    1. Introduction  Oncethe model functional form has been decided upon and the experimental data have been collected, a value for the model parameters (point estimation) and a confidence region for this value (interval estimation) must be estimated from the available data  One of the main tasks of statistical interference is the estimation of population parameters from the available sample statistics which are also called estimator  From the sample data we can estimate the population data like population mean
  • 4.
    2. Types ofstatistical parameter estimation Types Point estimation Interval estimation
  • 5.
    3. Point estimation Point estimation requires the use of sample data to measure a single value that acts as an unknown population parameter's 'best estimate‘  Generally, data from a sample is used to calculate the population data in the inferential statistics  Sample mean is the unbiased estimate of the population mean (u)  Maximum-likelihood estimation (MLE) uses the mean and variance as parameters and seeks parametric values that make the observed outcomes the most likely  MLE is a method of estimating parameters of a statistical model  It provides estimates of a parameter when applied to a data set and with a given statistical model  In general, the maximum likelihood approach selects the set of values of the model parameters for a fixed data set and the underlying statistical model that maximizes the probability function  MLE provides a unified estimation method, which is well defined in the case of normal distribution and several other problems  MLE are not suitable for certain complex problems
  • 6.
    Point estimation continue.… Linear least square method is another popular estimation approach  Linear least squares is a method that suits a mathematical model with data where the desired value is expressed linearly for any data point in terms of the unknown model parameters  To summarize the data, understand the mechanism of the system and to estimate unobserved values, the resulting fitted model can be used  Mathematically, the problem of approximately solving an over- determined set of linear equations is linear least squares, where the best approximation is defined as minimizing the number of square differences between the values of the data and their corresponding modelled values  The assumed function is linear to the parameters to be estimated, the approach is called linear least squares
  • 7.
    4. Interval estimation This is the estimation of a population parameter specified by two values (lower and upper)  This is better than the point estimation because this indicates range or precision of an estimate  Upper confidence limit (UL) and Lower confidence limit (LL) are present in the confidence interval of the interval estimation  A probability is assigned that this interval contains true population. We can't get the exact population parameter if we report or have a point estimate  Population and sample size influence the width of confidence interval  It is suggested to have a certain range of confidence in our estimate and the statistic should lie within the confidence range
  • 8.
    Interval estimation continue.… The most prevalent forms of interval estimation are Confidence intervals (frequentist method) and Credible intervals(Bayesian Method)  A probability is assigned to the hypothesis in a Bayesian method  In contrary to the Bayesian method, in a Frequentist method a hypothesis is tested without assigning a probability to the hypothesis
  • 9.
    4. Reference  KarriV V S Narayana Reddy, K Gowthamarajan, Arun Radhakrishnan, Arun Radhakrishnan. A Textbook of Computer aided drug development. S. vikas and company, PV Publication; 2021 edition; Pg. no. 270, 271