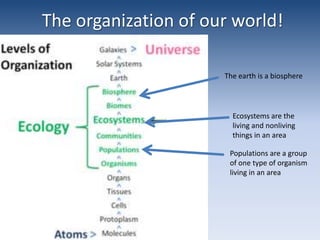
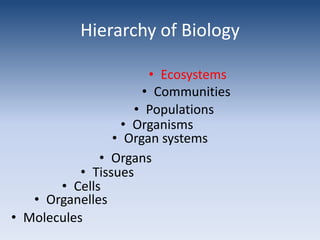
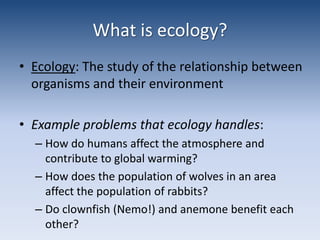
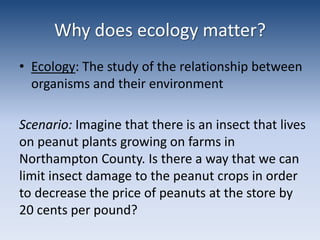
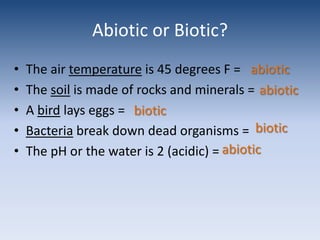
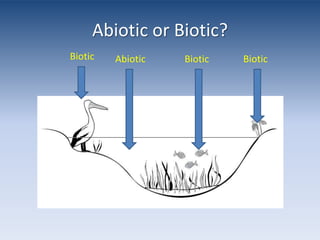
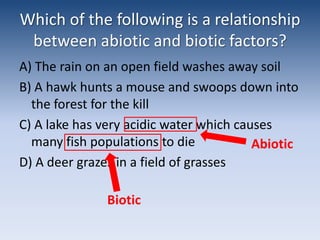
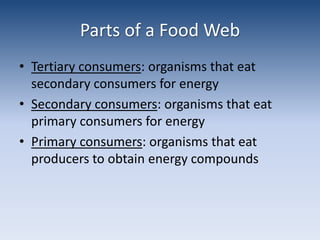
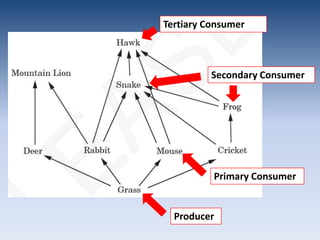
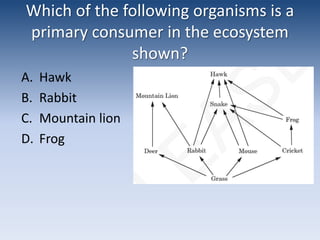
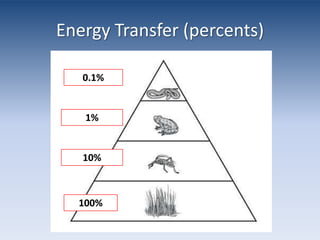
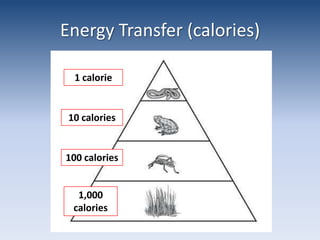
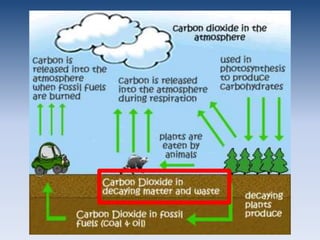
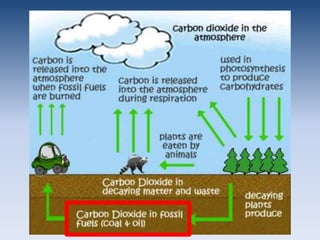
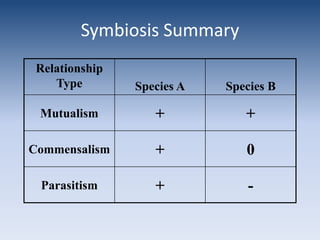
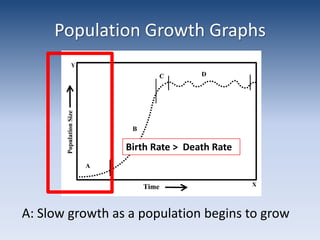
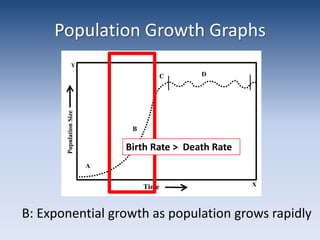
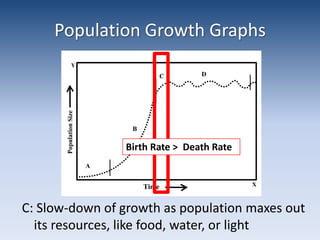
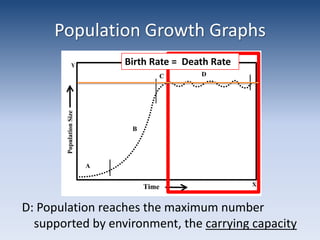
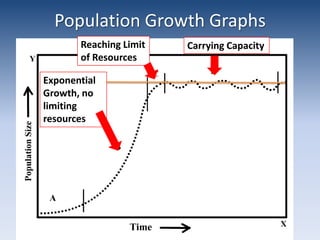
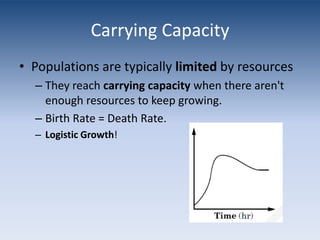
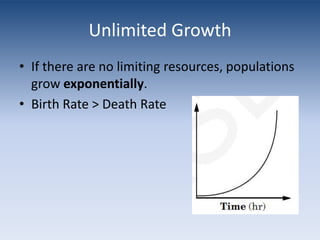
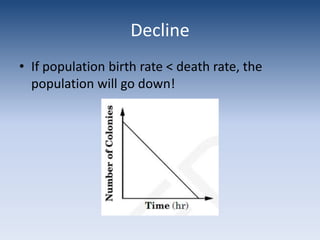
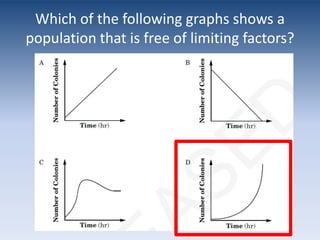
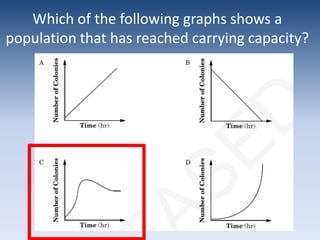
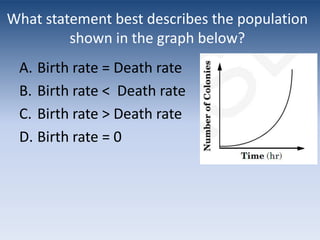
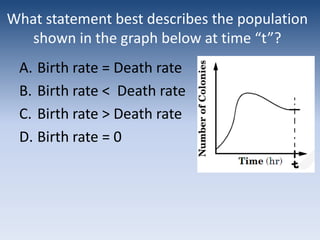
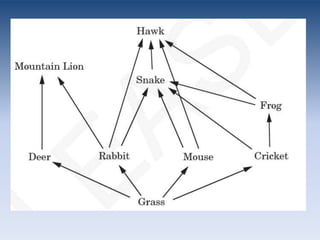
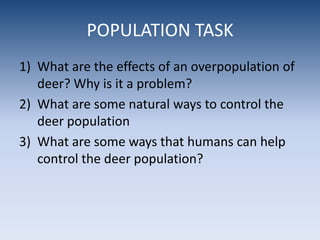
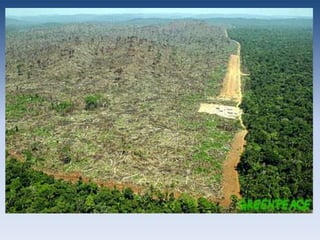
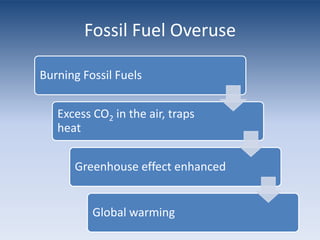
EcologyInteractions Between Organisms and their EnvironmentsMr. BroderickNC SCOS Goal 5
Lesson #1: Living and non-living parts of an EcosystemObjectivesIdentify abiotic and biotic factors in a given description of an ecosystem interactionGenerate an example relationship using abiotic and biotic factorsDetermine if a solution is acidic, basic, or neutral given its pHSet-up an experiment to test the effect of pH on the sprouting of a lima beanDevelop hypothesis, procedure
Key Vocabulary to DefineEcosystemAbioticBioticpHAcidicBasicNeutral
The organization of our world!The earth is a biosphereEcosystems are the living and nonliving things in an areaPopulations are a group of one type of organism living in an area
Hierarchy of BiologyEcosystemsCommunitiesPopulationsOrganismsOrgan systemsOrgansTissuesCellsOrganellesMolecules
What is ecology?Ecology: The study of the relationship between organisms and their environmentExample problems that ecology handles: How do humans affect the atmosphere and contribute to global warming? How does the population of wolves in an area affect the population of rabbits?Do clownfish (Nemo!) and anemone benefit each other?
Why does ecology matter?Ecology: The study of the relationship between organisms and their environmentScenario: Imagine that there is an insect that lives on peanut plants growing on farms in Northampton County. Is there a way that we can limit insect damage to the peanut crops in order to decrease the price of peanuts at the store by 20 cents per pound?
How do we study environments?Quadrant Studies: Tracking changes in a small section of the environment
How do we study environments?Sampling: Only measuring a small, random part of an environment
EcosystemsEcosystem: An area containing an interaction of living and non-living factors in an area/regionExample ecosystems: North Carolina forests (pine forests)Coastal Plains of NCOuter banks coastal water ecosystemLake Gaston ecosystem
What is in an Ecosystem?Abiotic Factors: The non-living parts of an ecosystemRocks, soil, temperature, gases in the air, lightBiotic Factors: The living parts of an ecosystemPlants, animals, bacteria, fungusProducers: use light to make their own energyConsumers: eat other organisms to obtain energyDecomposers: break down dead organisms for energy
Word Parts!Placing an “a” before a word makes it an opposite or notAbiotic (not biotic; not living)Atypical (not typical)Anonymous (no name)
AbioticBioticHumansBacteriaFungusPlantsInsectsAmphibiansReptilesMammalsBirdsWaterSoilWind or AirGases oxygen, carbon dioxide, nitrogenTemperatureSunlightpHAcid or base
Abiotic or Biotic?Biotic (plant)Abiotic (rainwater)
Abiotic or Biotic?The air temperature is 45 degrees F = The soil is made of rocks and minerals =A bird lays eggs =Bacteria break down dead organisms = The pH or the water is 2 (acidic) =abioticabioticbioticbioticabiotic
Abiotic or Biotic?BioticBioticBioticAbiotic
Which of the following is a relationship between abiotic and biotic factors?A) The rain on an open field washes away soilB) A hawk hunts a mouse and swoops down into the forest for the killC) A lake has very acidic water which causes many fish populations to dieD) A deer grazes in a field of grassesAbioticBiotic
Independent WorkRead your scenario cardIdentify the abiotic and biotic factors in the scenarioNow, find others with your letter and check your work.
Mini-Lesson: pHpH: the measurement of how acidic, basic, or neutral a solution is1  ------------ 4 ----------- 7 ------------ 11 ------------- 14Weakly AcidicWeakly BasicNeutralStrong Base(very basic)Strong Acid(very acidic)
Guided ExamplesVinegarpH of 4Baking SodapH of 8-9Tap waterpH of about 71 M HCl (hydrochloric acid)pH of about 11M NaOHpH of about 14AcidicBasicNeutralAcidicBasic
Guided ExamplesWhich is more acidic?pH of 2pH of 5pH of 7pH of 11Which is more basic?pH of 2pH of 5pH of 7pH of 11
A scientist performs an experiment to see if acids have an effect on the health of a particular type of plant.  Three sets of plants were treated with acidic solutions of known pH while the control set was treated with a solution of neutral pH 7. What is the best conclusion for this experiment?Acid has no effect on the health of this type of plantHigh acidity is helpful to this type of plantLow acidity is harmful to this type of plantHigh acidity is harmful to this type of plant
Energy Transfer in an EcosystemNCSCOS 5.02b
Food ChainsA food chain shows the flow of energy between the organisms in an environment
Food ChainsNotice that the arrow points from the organism being eatento the organism that eats it.Like the burger you eat goes into you	Plants  Cow (burger)  Human
What do the arrows in the food chain below indicate?SunlightEnergy flowHeat transferToxins
What is energy?The energy that is transferred in an ecosystem is stored in carbon-compounds, or organic compounds.Organic compounds: molecules that contain a carbon atomCarbohydrates: glucose, starch, cellulose (mostly plants)Proteins: the muscles of animals (steak!)Fats: in muscle of animal tissues (fatty steak!)
Food WebsWhen we put many food chains together in one ecosystem, it is called a food web
Food WebsFood webs show the direction that energy flows in an ecosystem.
Energy Moves in a Food WebOther animals get energy from the fat and protein in other animalsSome animals get glucose from plantsPlants make glucose from light
Parts of a Food WebProducers: organisms that use light to store energy in organic compounds.  (examples: plants, algae, phytoplankton)
Parts of a Food WebWhere are the producers in the food web below?
Parts of a Food WebConsumers: organisms that eat other organisms to get organic compounds that they use for energy (examples: humans, cows, insects, birds…)
Parts of a Food WebWhere are the consumers in the food web below?
Parts of a Food WebTertiary consumers: organisms that eat secondary consumers for energySecondary consumers: organisms that eat primary consumers for energyPrimary consumers: organisms that eat producers to obtain energy compounds
Tertiary ConsumerSecondary ConsumerPrimary ConsumerProducer
How is energy stored and transferred in an ecosystem?In lightIn oxygen and carbon dioxideIn carbon compounds like glucoseIn the process of decomposition
Which of the following organisms is a primary consumer in the ecosystem shown?HawkRabbitMountain lionFrog
Population Impacts in a Food WebIf the population of organisms at any level of the food web changes, it will affect the population at other levels
Population Impacts in a Food WebIf the population of producers decreases, then the population of primary consumers will decrease if they don’t have enough food.
Population Impacts in a Food WebIf the population of primary consumers decreases,  then…The producers will increase because there are less consumers eating themThe secondary consumers will decrease because there is less food for them
Which organism would be most affected if the cricket population decreased?SnakeDeerFrogHawk
Energy PyramidsEnergy Pyramids show the amount of energy at each level of a food webTrophic Level: the total amount of energy in all organisms at one level in the food web.
Energy PyramidsMore energy at the bottom, decreases as the pyramid moves up the food webLess EnergyMore Energy
Energy Pyramid LabelsTertiary ConsumersSecondary ConsumersPrimary ConsumersProducers
Energy Transfer in Energy PyramidsEach trophic level of the energy pyramid supplies energy to the level above it.Each transfer loses 90% of the energyOnly 10% of the energy at a level is passed to the next level up!
Energy Transfer (percents)0.1%1%10%100%
Energy Transfer (calories)1 calorie10 calories100 calories1,000 calories
Energy Transfer in Energy PyramidsWe can say that the energy transfer from level to level is inefficient(not a lot of the energy at each level makes it up)This means that there can’t be many levels ina  food web or pyramidThe amount of energy decreases, and it cannot typically support organisms at higher levels than tertiary consumer
Why are there a limited number of energy levels in an energy pyramid or food web?Energy transfer is very efficientEnergy is captured as heatEnergy transfer is inefficientEnergy is not transferred in a food web
Energy Transfer and FlowNCSCOS 5.02a, 2.05bc
How does energy enter the food web?
Better question… where does the weight of a producer come from?How does this...                         become this?
PhotosynthesisPhotosynthesis: a toxin process that occurs in producersand converts light, carbon dioxide, and water into glucose (sugar) and oxygen.
GlucoseOxygenSunlightCarbon DioxideWater
More PhotosynthesisPhotosynthesis removes carbon dioxide from the air.The carbon dioxide in the air is the building block for glucose.The light energy helps bond CO2and H2O together to make glucose.
The energy in light is now stored in the glucose molecule
Starch  Fat(nuts)GlucoseO2Light           CO2           H2O
How do consumers get energy?Digestionof organic moleculesConsumers eat other organisms to obtain organic molecules, which are forms of stored energy.Energy is stored in the bonds of the molecules.
The Carbon CycleNCSCOS 5.02a
Carbon CycleCarbon is found throughout the environmentCarbon is found in the atmosphere and in water as carbon dioxide (CO2)Carbon is found in organisms as organic molecules, like glucose (sugars) and fatsCarbon is found buried in the ground as fossil fuels
Carbon CycleCarbon is cycled, or movesAtmosphere: Carbon is in the form of CO2
CO2
Carbon Cycle2) Producers: Use photosynthesis to make sugars from CO2 in the atmosphere (carbon is moved!)
C6H12O6
Carbon Cycle3) Consumers: Eat organic molecules and release   	CO2 into the atmosphere during respiration, or die and go into the soil
CO2
Carbon Cycle4)  Soil: decomposers break down organisms, 		         releasing carbon into the atmosphere OR 	         trapping it in the ground (fossils)
Carbon Cycle5) Fossil Fuels: carbon from some dead organisms   	are trapped as fossil fuel until we burn it
Carbon Cycle StationsStart at one of the stationsMake your way to each different station based on a correct path through the carbon cycleIf you can go to two different places, choose between them and then go backWrite all answers on your sheet!After you are done, explain to your partner the “story” of the carbon cycle, and have them explain back to you!
Greenhouse Effect and Global WarmingGreenhouse EffectHeat is trapped near the Earth’s surface because once light gets in, it warms the surface but cannot escape out of the atmosphere.It is trapped by the gases in the atmosphere, like CO2
Global WarmingGlobal WarmingThe Earth has been warming on average.Could be due to increased CO2 emissions into the atmosphere, which enhances the greenhouse effect and traps extra heat.
Global WarmingExcess CO2   Enhanced       Global Warming	       Greenhouse		Effect
Relationships in an EcosystemNCSCOS 5.01
SymbiosisSymbiosis: a long-term relationship between two organisms in an ecosystem.
Types of SymbiosisMutualism: both organisms benefit from their relationshipCommensalism: one organism benefits, and the other is unaffectedParasitism: one organisms benefits, and the other is harmed
Symbiosis Summary
Name That SymbiosisLeeches feed off of the lamprey below, and eventually cause it to die.
Name That SymbiosisA clown fish lives among the sea anemone. The clown fish gains protection, but the anemone is neither harmed nor helped.
Name That SymbiosisOx-peckers live on the heads of the ox, eating insects and keeping the ox clean. The birds also get a place to live.
Example: The Malaria ParasiteSpecies: Plasmodium VivaxOrganism: ProtistDisease: Malaria, which is prevalent in Africa
 Plasmodium Vivax is a one-celled organism that is transmitted to humans through the bite of the female AnophelesmosquitoIt enters livercells and begins to reproduceThe reproductive cells infect blood cells.Which causes them to lyse or burst.The reproductive cells can be picked up by another mosquito, where they reproduce (G) and are transmitted to another human (H)
Population Growth and OverpopulationNCSCOS 5.03
PopulationsPopulation: the number of organism from one species that live in a specific areaExamples: the human population in different cities, the squirrel population in a forest, the grass population in a meadow
PopulationsPopulations are affected by many resources. These include:The amount of food available in an areaThe amount of sunlight (if it is a plant population)The amount of waterThe competition for food/shelterThe predators in an area
Population Growth GraphsBirth Rate >  Death RateA: Slow growth as a population begins to grow
Population Growth GraphsBirth Rate >  Death RateB: Exponential growth as population grows rapidly
Population Growth GraphsBirth Rate >  Death RateC: Slow-down of growth as population maxes out its resources, like food, water, or light
Population Growth GraphsBirth Rate =  Death RateD: Population reaches the maximum number supported by environment, the carrying capacity
Carrying CapacityCarrying Capacity: the maximum number of organisms in a population that are supported by the environmentPopulation Growth GraphsReaching Limit of ResourcesCarrying CapacityExponential Growth, no limiting resources
Carrying CapacityPopulations are typically limited by resourcesThey reach carrying capacity when there aren't enough resources to keep growing. Birth Rate = Death Rate.Logistic Growth!
Unlimited GrowthIf there are no limiting resources, populations grow exponentially. Birth Rate > Death Rate
DeclineIf population birth rate < death rate, the population will go down!
Which of the following graphs shows a population that is free of limiting factors?
Which of the following graphs shows a population that has reached carrying capacity?
How would a scientists determine the growth rate of a population?Birth Rate + Death RateBirth Rate – Death RateBirth Rate x Death RateBirth Rate / Death RateClick To Go Back and Analyze The GraphsIn Terms of Birth And Death Rates (with the class)
What statement best describes the population shown in the graph below?Birth rate = Death rateBirth rate <  Death rateBirth rate > Death rateBirth rate = 0
What statement best describes the population shown in the graph below at time “t”?Birth rate = Death rateBirth rate <  Death rateBirth rate > Death rateBirth rate = 0
Predator vs PreyPredator and Prey populations can affect one anotherAs prey increases, predator will increase in responseAs predators increase, prey will decreaseAs prey decrease, predators will decrease
POPULATION TASK
POPULATION TASKDeer control is a major issue in North CarolinaWe are going to work as small groups to figure out the problems concerning deer managementWe will also brainstorm solutions to the problem.
POPULATION TASKWhat are the effects of an overpopulation of deer? Why is it a problem?What are some natural ways to control the deer populationWhat are some ways that humans can help control the deer population?
Human Population and ImpactNC SCOS 5.03
ObjectivesWe can analyze the growth patterns of the human populationWe can explain the impacts of deforestation, pollution, and resource overuse on the environmentWe can inform the public about the dangers of human impacts and how to avoid resource overuse
Human PopulationHuman population is currently about 6.8 billionHuman population growth has been exponential
Population Pyramid GraphsDeveloping countries tend to have high growth rates, whereas developed countries tend to have stable growth.Population age distributionLarger at the bottom = more future growthEqual at each age = stable growth or even decline
Population age distributionLarger at the bottom = more future growthEqual at each age = stable growth or even decline
Overpopulation: The BadThe problems with overpopulation include abuse of resources:DeforestationFossil Fuel OveruseFreshwater OverusePollutionLack of adequate foodNon-native species
DeforestationCutting down forests leads to a loss of biodiversity: not as many different species in an areaCan affect local food webs, other species, and even medicine!
Fossil Fuel Overuse
Freshwater OverusePoor water quality, not enough freshwater in areas of need	Polluted runoff from factories
PollutionAcid rain:Sulfurand nitrogen gases released from factories into the air Sulfur dioxide: SO2Falls in rain drops, slowly impacts pH of water, soil, etc.
PollutionOzone Layer DestructionCFCs:chlorofluorocarbons – released into the air through old refrigerator and spray cans, destroy ozone layer.Low ozone leadstohigh UV radiationUV radiation: can cause skin cancer through mutation
Why you should wear sunblock!
FoodLack of food sourcesMost important in poor, developing countries
Introducing Non-native speciesPutting species into new ecosystems that aren’t supposed to be thereThe introduced species generally outcompete, or do better, than the native species. Example: pythons in the everglades.
What Can We Do?Use renewable resources for energyWater, wind, solar, and geothermal energy
What Can We Do?Reduce carbon dioxide emissionsReduce water wasteInvestigate factories and their pollution levelsIncrease public awareness of the issues
What Can We Do?Promote sustainable practicesUsing renewable energy, rotating crops, avoiding pesticides and toxins, making sure we keep fishing populations high, conserve resources
BioaccumulationNC SCOS 5.03, 5.02b
Quick VocabularyAutotroph: makes its own energy, a producerHeterotroph: gets its energy from somewhere else, a consumer
Quick VocabularyAccumulate: to gain over time
BioaccumulationBioaccumulation: the buildup of toxins in top consumers after eating many smaller organisms in a food web Also called biomagnification or bioamplification
BioaccumulationImagine that a toxin, a pesticide, was sprayed on the grass in the food web below. It cannot be released by the plant and is always stored.
http://www.ruralni.gov.uk/print/index/publications/press_articles/beef_and_sheep/archive-10/grass-attack.htm
BioacummulationEach level of organisms above the grass in the food web will accumulate more and more of the toxin because they eat so much of the level below themFor example, the mouse eats a large amount of grass, and stores all of the toxins in its body. Then the snake eats many mice, storing all of their toxins. Finally the hawk eats many snakes and stores all of their toxins in its body
BioaccumulationEats 10 snakes= 1gEats 100 mice = .1gEats 1,000 grasses = .001g1 grass has 0.000001g
BioaccumulationHighest toxin levelsEven more toxinMore toxin, concentratedLots of toxin, spread out
Why is biomagnification a problem?What do you think?Depends on the type of toxinIf the toxin is toxic, it might cause problems with the functions of an organismImpairs reproductionKills off members of a speciesPrevents organisms from reproducing
What happens to the food web?What do you think?Decreased top consumers means more low level consumersMore low level consumers means increased amounts of the toxic toxin!The top level consumers don’t stand a chance!Are we top level consumers? Can this happen to us?
Unit 1 Ecology Powerpoint (Goal 5)

Unit 1 Ecology Powerpoint (Goal 5)

  • 1.
    EcologyInteractions Between Organismsand their EnvironmentsMr. BroderickNC SCOS Goal 5
  • 2.
    Lesson #1: Livingand non-living parts of an EcosystemObjectivesIdentify abiotic and biotic factors in a given description of an ecosystem interactionGenerate an example relationship using abiotic and biotic factorsDetermine if a solution is acidic, basic, or neutral given its pHSet-up an experiment to test the effect of pH on the sprouting of a lima beanDevelop hypothesis, procedure
  • 3.
    Key Vocabulary toDefineEcosystemAbioticBioticpHAcidicBasicNeutral
  • 4.
    The organization ofour world!The earth is a biosphereEcosystems are the living and nonliving things in an areaPopulations are a group of one type of organism living in an area
  • 5.
    Hierarchy of BiologyEcosystemsCommunitiesPopulationsOrganismsOrgansystemsOrgansTissuesCellsOrganellesMolecules
  • 6.
    What is ecology?Ecology:The study of the relationship between organisms and their environmentExample problems that ecology handles: How do humans affect the atmosphere and contribute to global warming? How does the population of wolves in an area affect the population of rabbits?Do clownfish (Nemo!) and anemone benefit each other?
  • 7.
    Why does ecologymatter?Ecology: The study of the relationship between organisms and their environmentScenario: Imagine that there is an insect that lives on peanut plants growing on farms in Northampton County. Is there a way that we can limit insect damage to the peanut crops in order to decrease the price of peanuts at the store by 20 cents per pound?
  • 8.
    How do westudy environments?Quadrant Studies: Tracking changes in a small section of the environment
  • 9.
    How do westudy environments?Sampling: Only measuring a small, random part of an environment
  • 10.
    EcosystemsEcosystem: An areacontaining an interaction of living and non-living factors in an area/regionExample ecosystems: North Carolina forests (pine forests)Coastal Plains of NCOuter banks coastal water ecosystemLake Gaston ecosystem
  • 20.
    What is inan Ecosystem?Abiotic Factors: The non-living parts of an ecosystemRocks, soil, temperature, gases in the air, lightBiotic Factors: The living parts of an ecosystemPlants, animals, bacteria, fungusProducers: use light to make their own energyConsumers: eat other organisms to obtain energyDecomposers: break down dead organisms for energy
  • 21.
    Word Parts!Placing an“a” before a word makes it an opposite or notAbiotic (not biotic; not living)Atypical (not typical)Anonymous (no name)
  • 22.
  • 23.
    Abiotic or Biotic?Biotic(plant)Abiotic (rainwater)
  • 24.
    Abiotic or Biotic?Theair temperature is 45 degrees F = The soil is made of rocks and minerals =A bird lays eggs =Bacteria break down dead organisms = The pH or the water is 2 (acidic) =abioticabioticbioticbioticabiotic
  • 25.
  • 26.
    Which of thefollowing is a relationship between abiotic and biotic factors?A) The rain on an open field washes away soilB) A hawk hunts a mouse and swoops down into the forest for the killC) A lake has very acidic water which causes many fish populations to dieD) A deer grazes in a field of grassesAbioticBiotic
  • 27.
    Independent WorkRead yourscenario cardIdentify the abiotic and biotic factors in the scenarioNow, find others with your letter and check your work.
  • 28.
    Mini-Lesson: pHpH: themeasurement of how acidic, basic, or neutral a solution is1 ------------ 4 ----------- 7 ------------ 11 ------------- 14Weakly AcidicWeakly BasicNeutralStrong Base(very basic)Strong Acid(very acidic)
  • 29.
    Guided ExamplesVinegarpH of4Baking SodapH of 8-9Tap waterpH of about 71 M HCl (hydrochloric acid)pH of about 11M NaOHpH of about 14AcidicBasicNeutralAcidicBasic
  • 30.
    Guided ExamplesWhich ismore acidic?pH of 2pH of 5pH of 7pH of 11Which is more basic?pH of 2pH of 5pH of 7pH of 11
  • 31.
    A scientist performsan experiment to see if acids have an effect on the health of a particular type of plant. Three sets of plants were treated with acidic solutions of known pH while the control set was treated with a solution of neutral pH 7. What is the best conclusion for this experiment?Acid has no effect on the health of this type of plantHigh acidity is helpful to this type of plantLow acidity is harmful to this type of plantHigh acidity is harmful to this type of plant
  • 32.
    Energy Transfer inan EcosystemNCSCOS 5.02b
  • 33.
    Food ChainsA foodchain shows the flow of energy between the organisms in an environment
  • 34.
    Food ChainsNotice thatthe arrow points from the organism being eatento the organism that eats it.Like the burger you eat goes into you Plants  Cow (burger)  Human
  • 35.
    What do thearrows in the food chain below indicate?SunlightEnergy flowHeat transferToxins
  • 36.
    What is energy?Theenergy that is transferred in an ecosystem is stored in carbon-compounds, or organic compounds.Organic compounds: molecules that contain a carbon atomCarbohydrates: glucose, starch, cellulose (mostly plants)Proteins: the muscles of animals (steak!)Fats: in muscle of animal tissues (fatty steak!)
  • 37.
    Food WebsWhen weput many food chains together in one ecosystem, it is called a food web
  • 38.
    Food WebsFood websshow the direction that energy flows in an ecosystem.
  • 39.
    Energy Moves ina Food WebOther animals get energy from the fat and protein in other animalsSome animals get glucose from plantsPlants make glucose from light
  • 40.
    Parts of aFood WebProducers: organisms that use light to store energy in organic compounds. (examples: plants, algae, phytoplankton)
  • 41.
    Parts of aFood WebWhere are the producers in the food web below?
  • 42.
    Parts of aFood WebConsumers: organisms that eat other organisms to get organic compounds that they use for energy (examples: humans, cows, insects, birds…)
  • 43.
    Parts of aFood WebWhere are the consumers in the food web below?
  • 44.
    Parts of aFood WebTertiary consumers: organisms that eat secondary consumers for energySecondary consumers: organisms that eat primary consumers for energyPrimary consumers: organisms that eat producers to obtain energy compounds
  • 45.
  • 46.
    How is energystored and transferred in an ecosystem?In lightIn oxygen and carbon dioxideIn carbon compounds like glucoseIn the process of decomposition
  • 47.
    Which of thefollowing organisms is a primary consumer in the ecosystem shown?HawkRabbitMountain lionFrog
  • 48.
    Population Impacts ina Food WebIf the population of organisms at any level of the food web changes, it will affect the population at other levels
  • 49.
    Population Impacts ina Food WebIf the population of producers decreases, then the population of primary consumers will decrease if they don’t have enough food.
  • 50.
    Population Impacts ina Food WebIf the population of primary consumers decreases, then…The producers will increase because there are less consumers eating themThe secondary consumers will decrease because there is less food for them
  • 51.
    Which organism wouldbe most affected if the cricket population decreased?SnakeDeerFrogHawk
  • 52.
    Energy PyramidsEnergy Pyramidsshow the amount of energy at each level of a food webTrophic Level: the total amount of energy in all organisms at one level in the food web.
  • 53.
    Energy PyramidsMore energyat the bottom, decreases as the pyramid moves up the food webLess EnergyMore Energy
  • 54.
    Energy Pyramid LabelsTertiaryConsumersSecondary ConsumersPrimary ConsumersProducers
  • 55.
    Energy Transfer inEnergy PyramidsEach trophic level of the energy pyramid supplies energy to the level above it.Each transfer loses 90% of the energyOnly 10% of the energy at a level is passed to the next level up!
  • 56.
  • 57.
    Energy Transfer (calories)1calorie10 calories100 calories1,000 calories
  • 58.
    Energy Transfer inEnergy PyramidsWe can say that the energy transfer from level to level is inefficient(not a lot of the energy at each level makes it up)This means that there can’t be many levels ina food web or pyramidThe amount of energy decreases, and it cannot typically support organisms at higher levels than tertiary consumer
  • 59.
    Why are therea limited number of energy levels in an energy pyramid or food web?Energy transfer is very efficientEnergy is captured as heatEnergy transfer is inefficientEnergy is not transferred in a food web
  • 60.
    Energy Transfer andFlowNCSCOS 5.02a, 2.05bc
  • 61.
    How does energyenter the food web?
  • 62.
    Better question… wheredoes the weight of a producer come from?How does this... become this?
  • 64.
    PhotosynthesisPhotosynthesis: a toxinprocess that occurs in producersand converts light, carbon dioxide, and water into glucose (sugar) and oxygen.
  • 65.
  • 66.
    More PhotosynthesisPhotosynthesis removescarbon dioxide from the air.The carbon dioxide in the air is the building block for glucose.The light energy helps bond CO2and H2O together to make glucose.
  • 67.
    The energy inlight is now stored in the glucose molecule
  • 68.
  • 69.
    How do consumersget energy?Digestionof organic moleculesConsumers eat other organisms to obtain organic molecules, which are forms of stored energy.Energy is stored in the bonds of the molecules.
  • 70.
  • 71.
    Carbon CycleCarbon isfound throughout the environmentCarbon is found in the atmosphere and in water as carbon dioxide (CO2)Carbon is found in organisms as organic molecules, like glucose (sugars) and fatsCarbon is found buried in the ground as fossil fuels
  • 72.
    Carbon CycleCarbon iscycled, or movesAtmosphere: Carbon is in the form of CO2
  • 73.
  • 74.
    Carbon Cycle2) Producers:Use photosynthesis to make sugars from CO2 in the atmosphere (carbon is moved!)
  • 75.
  • 76.
    Carbon Cycle3) Consumers:Eat organic molecules and release CO2 into the atmosphere during respiration, or die and go into the soil
  • 77.
  • 79.
    Carbon Cycle4) Soil: decomposers break down organisms, releasing carbon into the atmosphere OR trapping it in the ground (fossils)
  • 81.
    Carbon Cycle5) FossilFuels: carbon from some dead organisms are trapped as fossil fuel until we burn it
  • 83.
    Carbon Cycle StationsStartat one of the stationsMake your way to each different station based on a correct path through the carbon cycleIf you can go to two different places, choose between them and then go backWrite all answers on your sheet!After you are done, explain to your partner the “story” of the carbon cycle, and have them explain back to you!
  • 84.
    Greenhouse Effect andGlobal WarmingGreenhouse EffectHeat is trapped near the Earth’s surface because once light gets in, it warms the surface but cannot escape out of the atmosphere.It is trapped by the gases in the atmosphere, like CO2
  • 87.
    Global WarmingGlobal WarmingTheEarth has been warming on average.Could be due to increased CO2 emissions into the atmosphere, which enhances the greenhouse effect and traps extra heat.
  • 88.
    Global WarmingExcess CO2 Enhanced  Global Warming Greenhouse Effect
  • 90.
    Relationships in anEcosystemNCSCOS 5.01
  • 91.
    SymbiosisSymbiosis: a long-termrelationship between two organisms in an ecosystem.
  • 92.
    Types of SymbiosisMutualism:both organisms benefit from their relationshipCommensalism: one organism benefits, and the other is unaffectedParasitism: one organisms benefits, and the other is harmed
  • 93.
  • 94.
    Name That SymbiosisLeechesfeed off of the lamprey below, and eventually cause it to die.
  • 95.
    Name That SymbiosisAclown fish lives among the sea anemone. The clown fish gains protection, but the anemone is neither harmed nor helped.
  • 96.
    Name That SymbiosisOx-peckerslive on the heads of the ox, eating insects and keeping the ox clean. The birds also get a place to live.
  • 97.
    Example: The MalariaParasiteSpecies: Plasmodium VivaxOrganism: ProtistDisease: Malaria, which is prevalent in Africa
  • 99.
     Plasmodium Vivax isa one-celled organism that is transmitted to humans through the bite of the female AnophelesmosquitoIt enters livercells and begins to reproduceThe reproductive cells infect blood cells.Which causes them to lyse or burst.The reproductive cells can be picked up by another mosquito, where they reproduce (G) and are transmitted to another human (H)
  • 100.
    Population Growth andOverpopulationNCSCOS 5.03
  • 101.
    PopulationsPopulation: the numberof organism from one species that live in a specific areaExamples: the human population in different cities, the squirrel population in a forest, the grass population in a meadow
  • 102.
    PopulationsPopulations are affectedby many resources. These include:The amount of food available in an areaThe amount of sunlight (if it is a plant population)The amount of waterThe competition for food/shelterThe predators in an area
  • 103.
    Population Growth GraphsBirthRate > Death RateA: Slow growth as a population begins to grow
  • 104.
    Population Growth GraphsBirthRate > Death RateB: Exponential growth as population grows rapidly
  • 105.
    Population Growth GraphsBirthRate > Death RateC: Slow-down of growth as population maxes out its resources, like food, water, or light
  • 106.
    Population Growth GraphsBirthRate = Death RateD: Population reaches the maximum number supported by environment, the carrying capacity
  • 107.
    Carrying CapacityCarrying Capacity:the maximum number of organisms in a population that are supported by the environmentPopulation Growth GraphsReaching Limit of ResourcesCarrying CapacityExponential Growth, no limiting resources
  • 108.
    Carrying CapacityPopulations aretypically limited by resourcesThey reach carrying capacity when there aren't enough resources to keep growing. Birth Rate = Death Rate.Logistic Growth!
  • 109.
    Unlimited GrowthIf thereare no limiting resources, populations grow exponentially. Birth Rate > Death Rate
  • 110.
    DeclineIf population birthrate < death rate, the population will go down!
  • 111.
    Which of thefollowing graphs shows a population that is free of limiting factors?
  • 112.
    Which of thefollowing graphs shows a population that has reached carrying capacity?
  • 113.
    How would ascientists determine the growth rate of a population?Birth Rate + Death RateBirth Rate – Death RateBirth Rate x Death RateBirth Rate / Death RateClick To Go Back and Analyze The GraphsIn Terms of Birth And Death Rates (with the class)
  • 114.
    What statement bestdescribes the population shown in the graph below?Birth rate = Death rateBirth rate < Death rateBirth rate > Death rateBirth rate = 0
  • 115.
    What statement bestdescribes the population shown in the graph below at time “t”?Birth rate = Death rateBirth rate < Death rateBirth rate > Death rateBirth rate = 0
  • 117.
    Predator vs PreyPredatorand Prey populations can affect one anotherAs prey increases, predator will increase in responseAs predators increase, prey will decreaseAs prey decrease, predators will decrease
  • 118.
  • 119.
    POPULATION TASKDeer controlis a major issue in North CarolinaWe are going to work as small groups to figure out the problems concerning deer managementWe will also brainstorm solutions to the problem.
  • 121.
    POPULATION TASKWhat arethe effects of an overpopulation of deer? Why is it a problem?What are some natural ways to control the deer populationWhat are some ways that humans can help control the deer population?
  • 122.
    Human Population andImpactNC SCOS 5.03
  • 123.
    ObjectivesWe can analyzethe growth patterns of the human populationWe can explain the impacts of deforestation, pollution, and resource overuse on the environmentWe can inform the public about the dangers of human impacts and how to avoid resource overuse
  • 124.
    Human PopulationHuman populationis currently about 6.8 billionHuman population growth has been exponential
  • 126.
    Population Pyramid GraphsDevelopingcountries tend to have high growth rates, whereas developed countries tend to have stable growth.Population age distributionLarger at the bottom = more future growthEqual at each age = stable growth or even decline
  • 127.
    Population age distributionLargerat the bottom = more future growthEqual at each age = stable growth or even decline
  • 129.
    Overpopulation: The BadTheproblems with overpopulation include abuse of resources:DeforestationFossil Fuel OveruseFreshwater OverusePollutionLack of adequate foodNon-native species
  • 130.
    DeforestationCutting down forestsleads to a loss of biodiversity: not as many different species in an areaCan affect local food webs, other species, and even medicine!
  • 133.
  • 134.
    Freshwater OverusePoor waterquality, not enough freshwater in areas of need Polluted runoff from factories
  • 136.
    PollutionAcid rain:Sulfurand nitrogengases released from factories into the air Sulfur dioxide: SO2Falls in rain drops, slowly impacts pH of water, soil, etc.
  • 138.
    PollutionOzone Layer DestructionCFCs:chlorofluorocarbons– released into the air through old refrigerator and spray cans, destroy ozone layer.Low ozone leadstohigh UV radiationUV radiation: can cause skin cancer through mutation
  • 140.
    Why you shouldwear sunblock!
  • 141.
    FoodLack of foodsourcesMost important in poor, developing countries
  • 142.
    Introducing Non-native speciesPuttingspecies into new ecosystems that aren’t supposed to be thereThe introduced species generally outcompete, or do better, than the native species. Example: pythons in the everglades.
  • 145.
    What Can WeDo?Use renewable resources for energyWater, wind, solar, and geothermal energy
  • 146.
    What Can WeDo?Reduce carbon dioxide emissionsReduce water wasteInvestigate factories and their pollution levelsIncrease public awareness of the issues
  • 147.
    What Can WeDo?Promote sustainable practicesUsing renewable energy, rotating crops, avoiding pesticides and toxins, making sure we keep fishing populations high, conserve resources
  • 148.
  • 149.
    Quick VocabularyAutotroph: makesits own energy, a producerHeterotroph: gets its energy from somewhere else, a consumer
  • 151.
  • 152.
    BioaccumulationBioaccumulation: the buildupof toxins in top consumers after eating many smaller organisms in a food web Also called biomagnification or bioamplification
  • 153.
    BioaccumulationImagine that atoxin, a pesticide, was sprayed on the grass in the food web below. It cannot be released by the plant and is always stored.
  • 154.
  • 155.
    BioacummulationEach level oforganisms above the grass in the food web will accumulate more and more of the toxin because they eat so much of the level below themFor example, the mouse eats a large amount of grass, and stores all of the toxins in its body. Then the snake eats many mice, storing all of their toxins. Finally the hawk eats many snakes and stores all of their toxins in its body
  • 156.
    BioaccumulationEats 10 snakes=1gEats 100 mice = .1gEats 1,000 grasses = .001g1 grass has 0.000001g
  • 157.
    BioaccumulationHighest toxin levelsEvenmore toxinMore toxin, concentratedLots of toxin, spread out
  • 158.
    Why is biomagnificationa problem?What do you think?Depends on the type of toxinIf the toxin is toxic, it might cause problems with the functions of an organismImpairs reproductionKills off members of a speciesPrevents organisms from reproducing
  • 159.
    What happens tothe food web?What do you think?Decreased top consumers means more low level consumersMore low level consumers means increased amounts of the toxic toxin!The top level consumers don’t stand a chance!Are we top level consumers? Can this happen to us?

Editor's Notes

  • #4 These are words students must know at the end of the lesson
  • #6 This list, with a few deletions, is on my back wall in big words. It serves as a reminder of the organization, and it also covers test items with the answers like “organism, population, community, ecosystem” as levels in ecology! I refer to it as we move up and down the list during our studies.
  • #7 Sell it to them!
  • #8 Make it relevant to money in their pockets! Generate other examples using local resources!
  • #9 Students can model this and sampling in a mini-lab, or they can go outside and actually sample populations near the end of the unit, like dandelions in a field.
  • #12 Do you see living and non-living things in this ecosystem?
  • #13 PhD student at Duke participating in ecology research, using 2x2 quadrants to determine effects of biodiversity on nitrogen cycles in NC wetlands.
  • #14 Swamp in Big Cypress National Preserve, near Everglades National Park, Florida.
  • #15 Mr. B… so shy
  • #16 The ghost orchid, a very rare flower.
  • #17 eek
  • #28 I typically create some abiotic and biotic interaction cards, and have them figure out the types and then check with partners. Could work however you would like. Could be straight worksheet, or a CPS clicker game.
  • #29 Fits in as an abiotic factor, and is needed later on. Make sure to emphasize that 2 is MORE acidic than 3, 4, 7, 10 etc. Similarly, 12 is MORE basic than 10, 6, etc.
  • #90 Stress moving average as evidence of global warming, which may be caused by an enhanced greenhouse effect, which is a result of excess CO2! It’s a cause -&gt; effect chain
  • #98 NC SCOS 4.03, covering malaria now saves time later.
  • #113 Two correct answers, but D is the best. A is correct, but populations don’t grow like that because of the exponential nature of reproduction. EXAMPLE: having 3 kids, which each have 3, which each have 3 = 81 new babies! Exponential growth.
  • #115 Click the link to go back and review birth and death rates using the first graph as a guide, if necessary.
  • #116 No true misconceptions. Points out a lack of understanding of growth rate and birth/death relationship
  • #117 Common misconception: D. Most students think 0 is no change, when it is really just a lack of births. There will always be deaths, so 0 – a large number = a negative number, and a decline.
  • #118 Have a bright group of students point out trends. Guide students to finding the relationship between prey levels and the predators, which rely on prey for food. If food goes up, population can go up, but then food goes down!
  • #120 Time permitting, I have the students work with partners to brainstorm answers to the questions on the next page, using the food web on the subsequent slide as a springboard. This can be open, guided, or controlled by the teacher. It is useful to connect the population growth to food webs and food web changes. Also, symbiosis and competition can be reviewed during the discussion. A structured decision worksheet could be useful to make.
  • #154 Root words: Bio -&gt; Life, accumulate -&gt; to gain over time
  • #162 Lake Gaston = pretty, but there is a mercury problem!