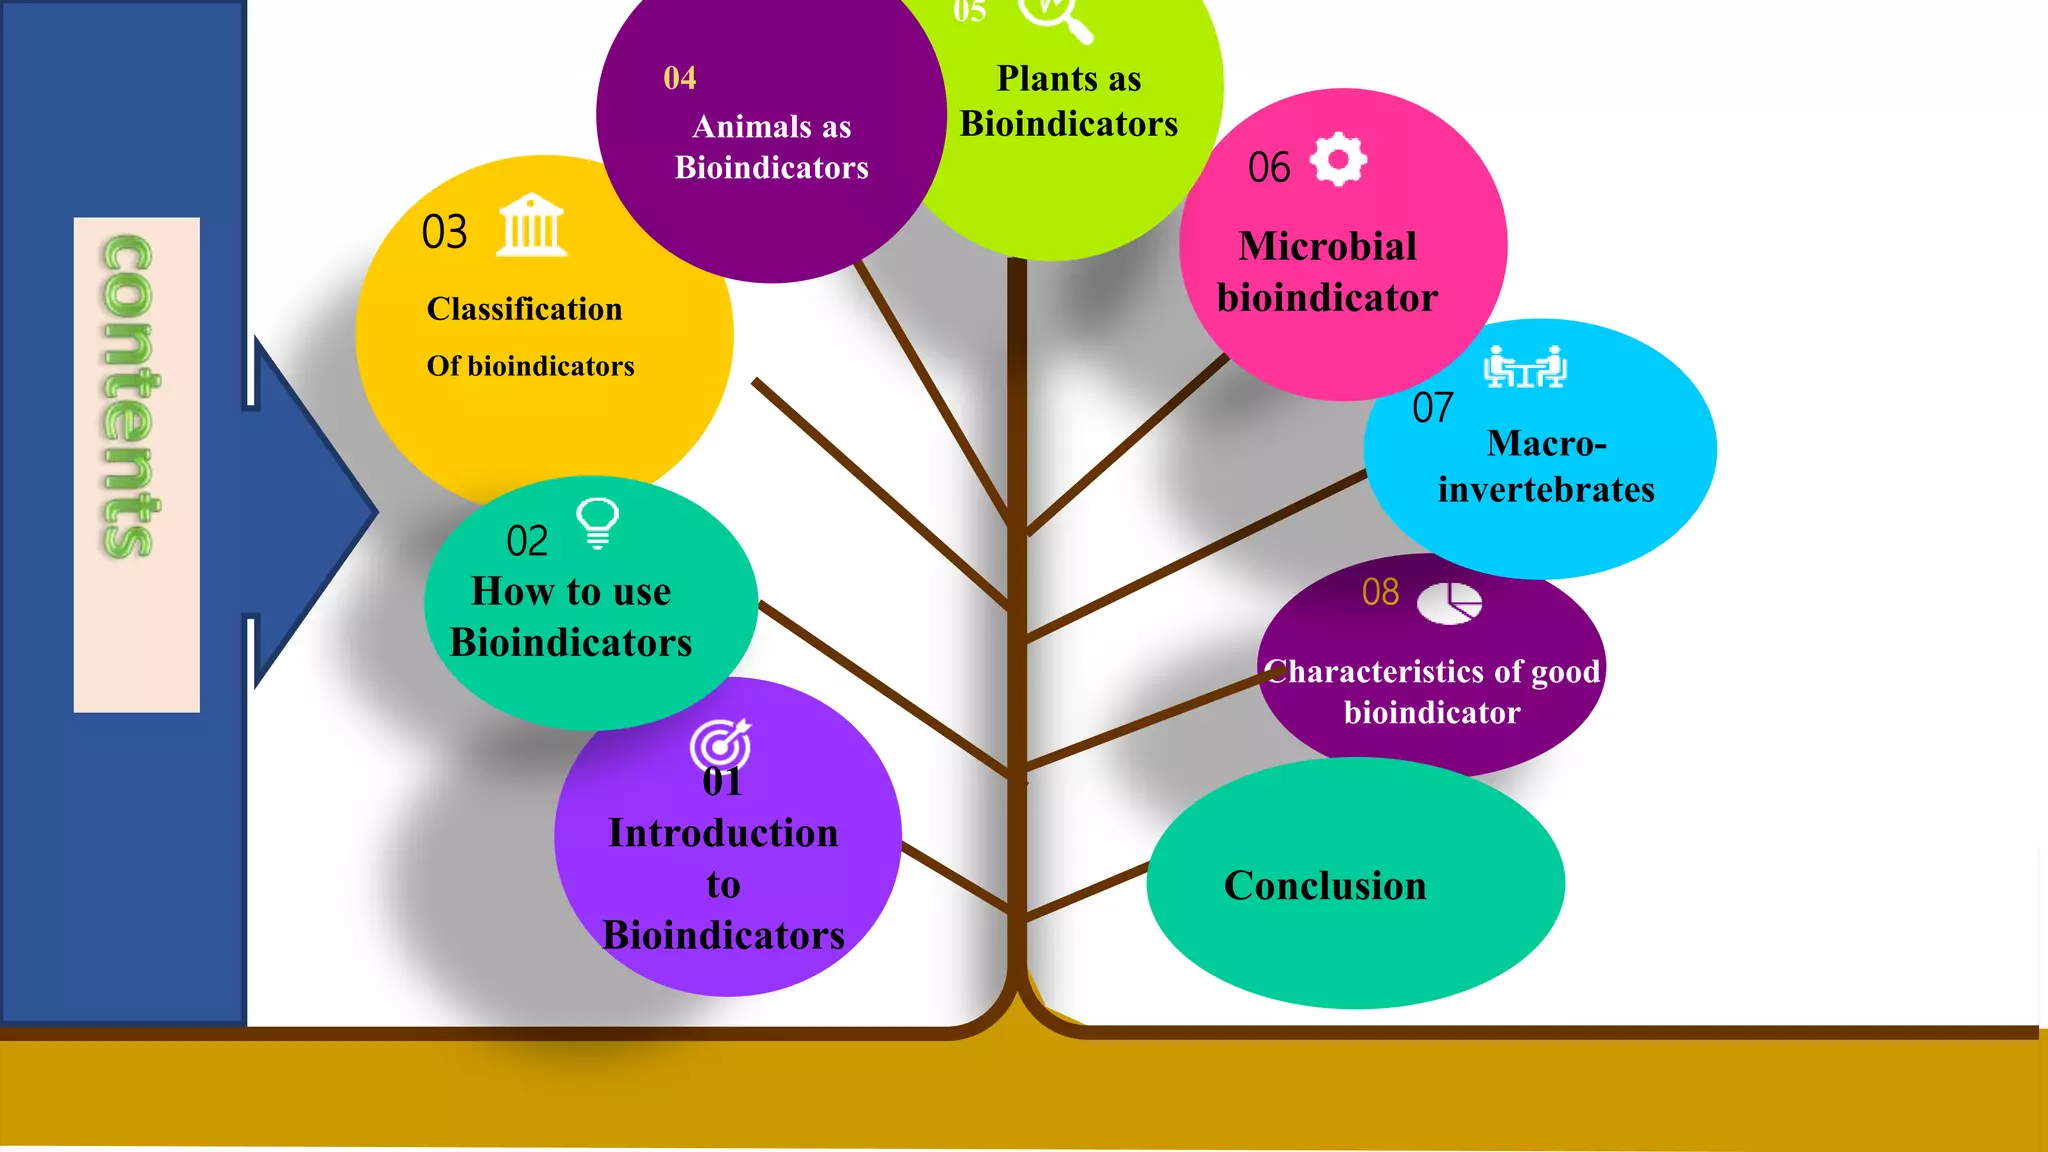
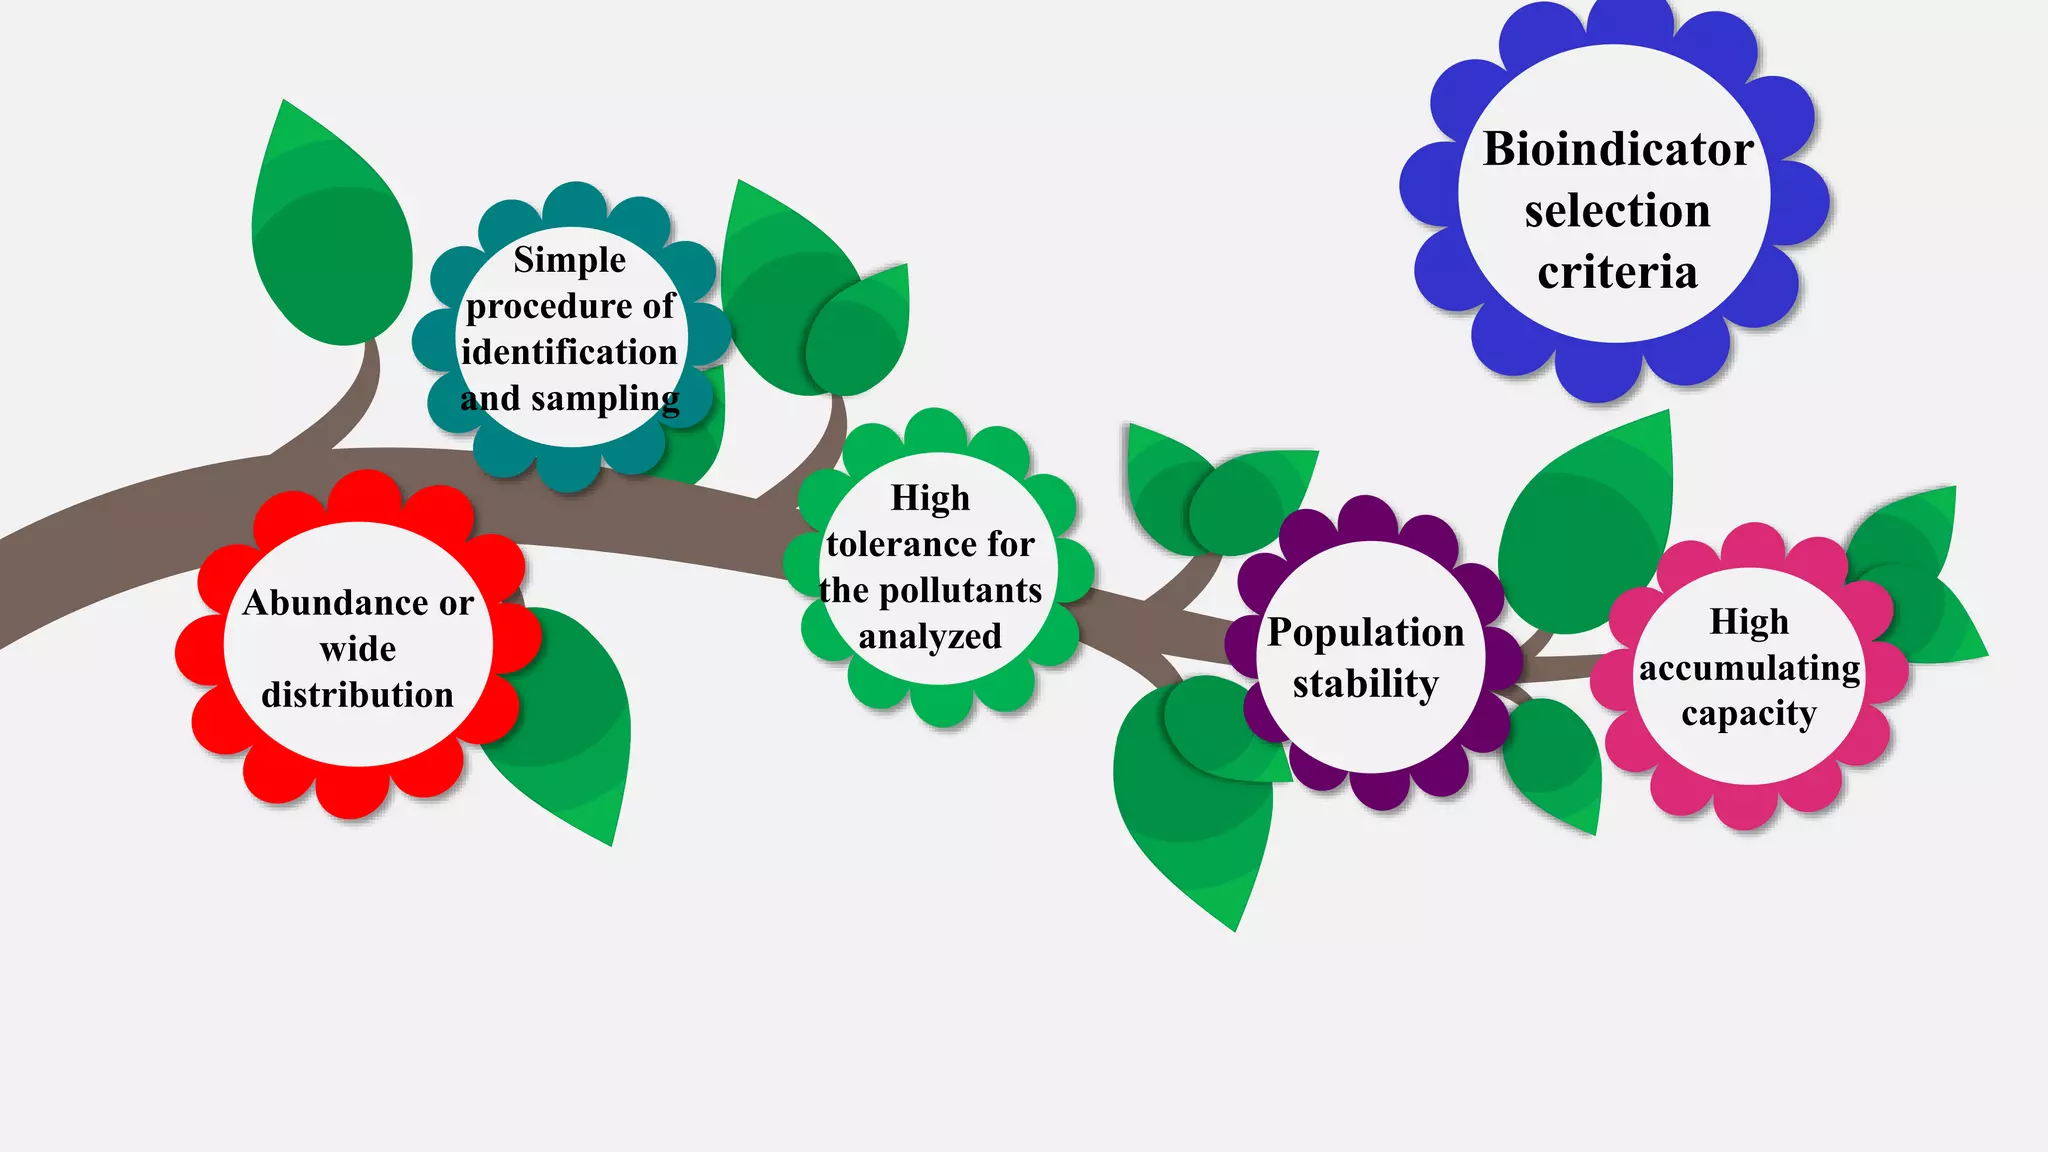
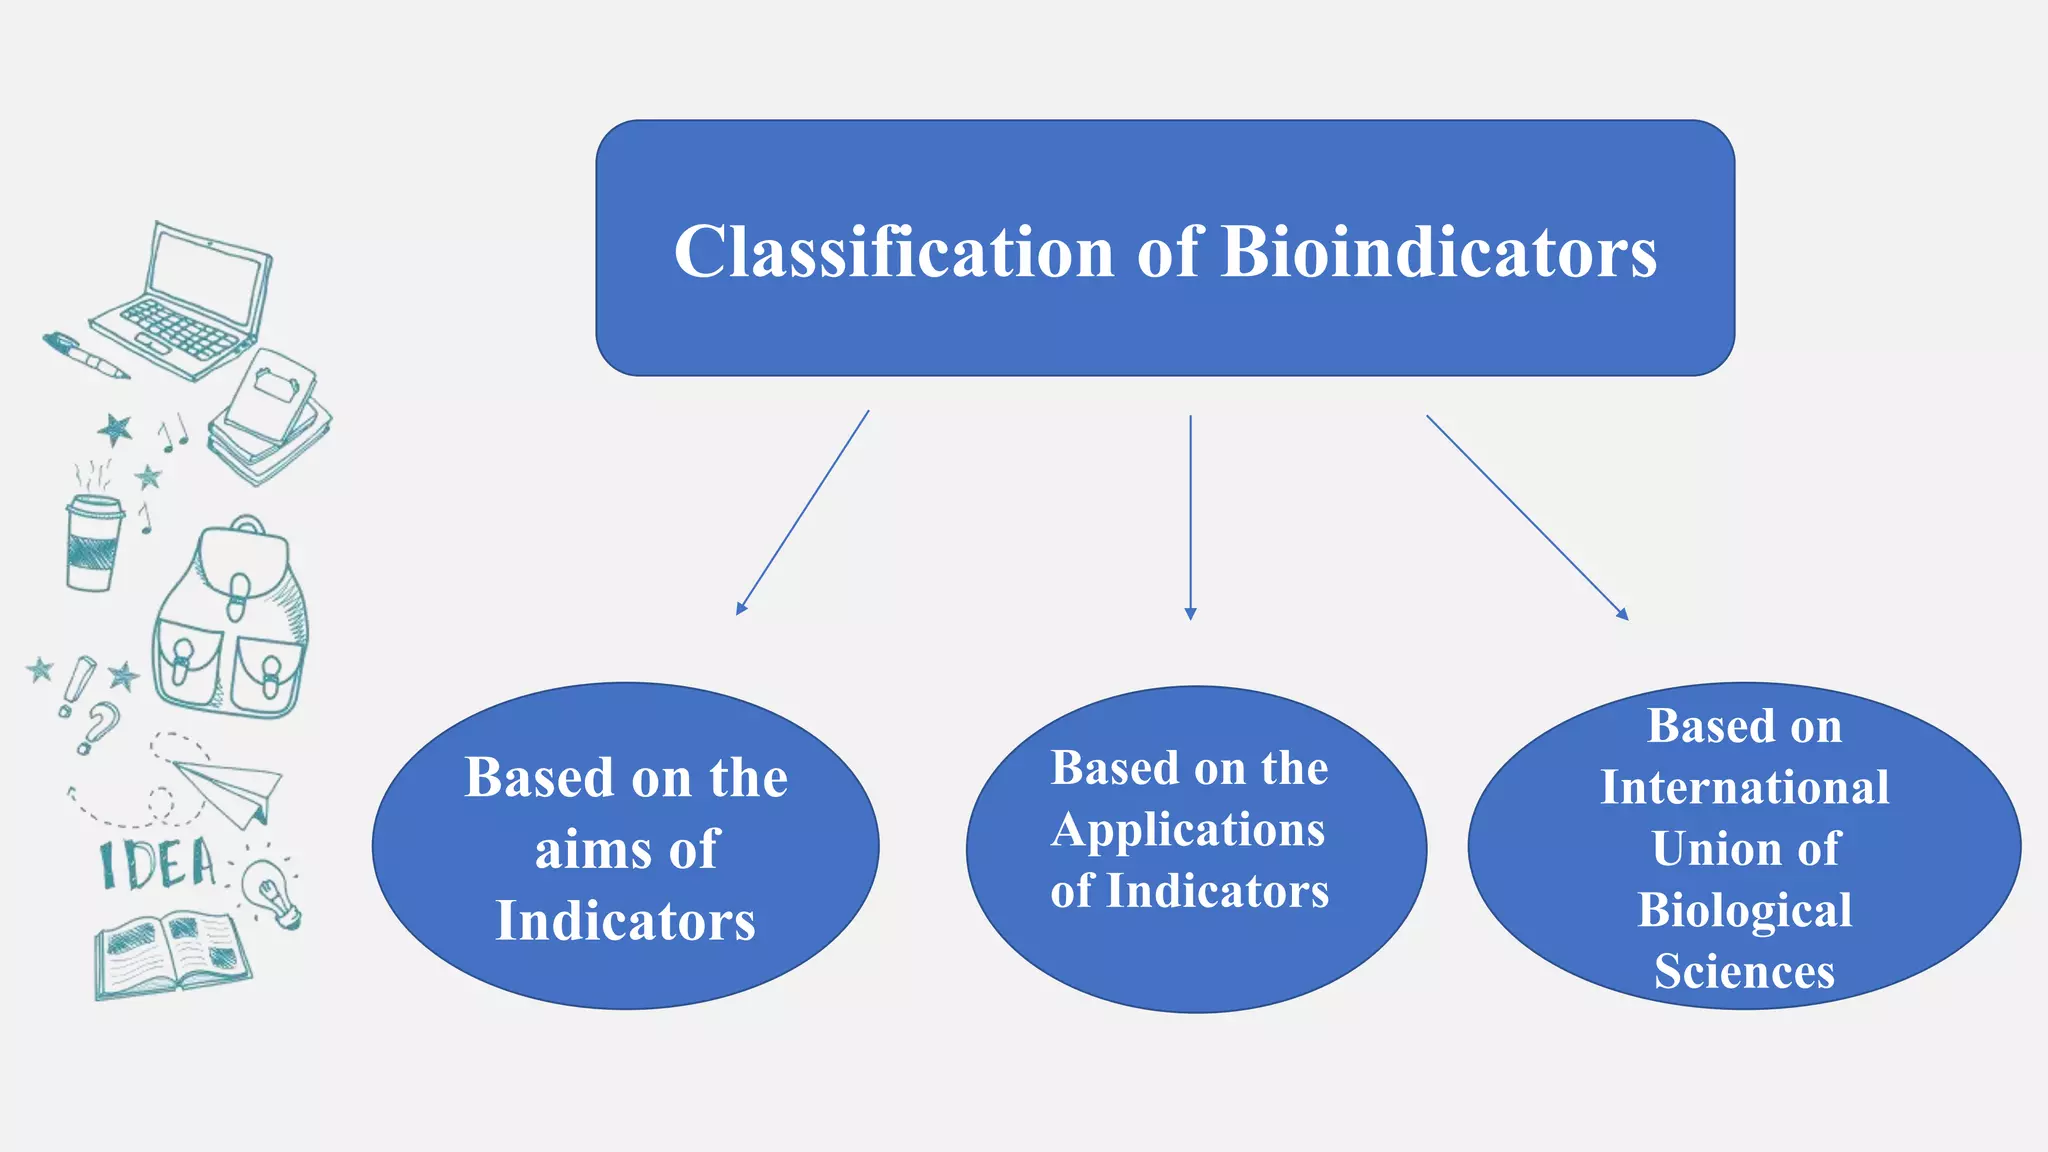
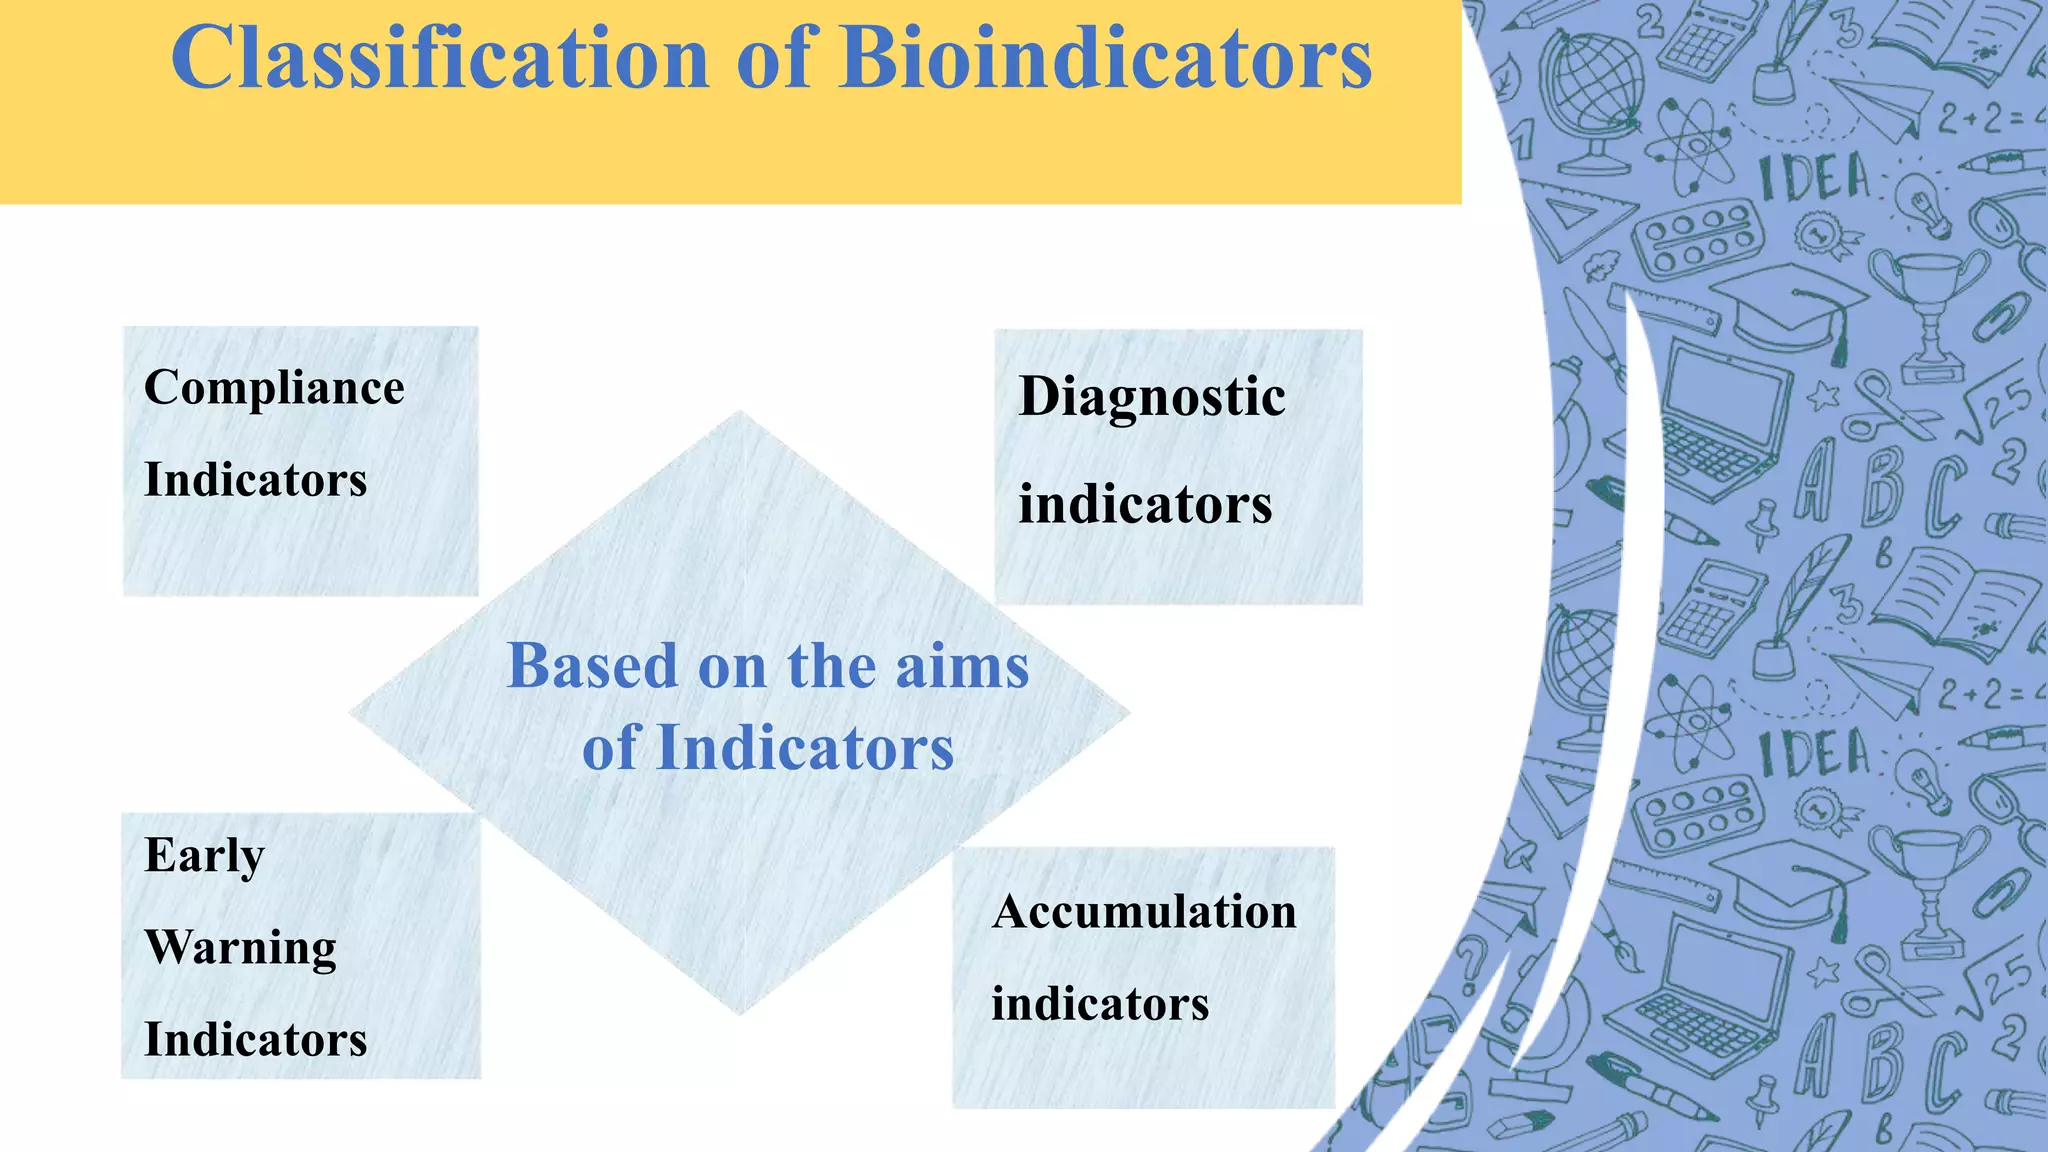
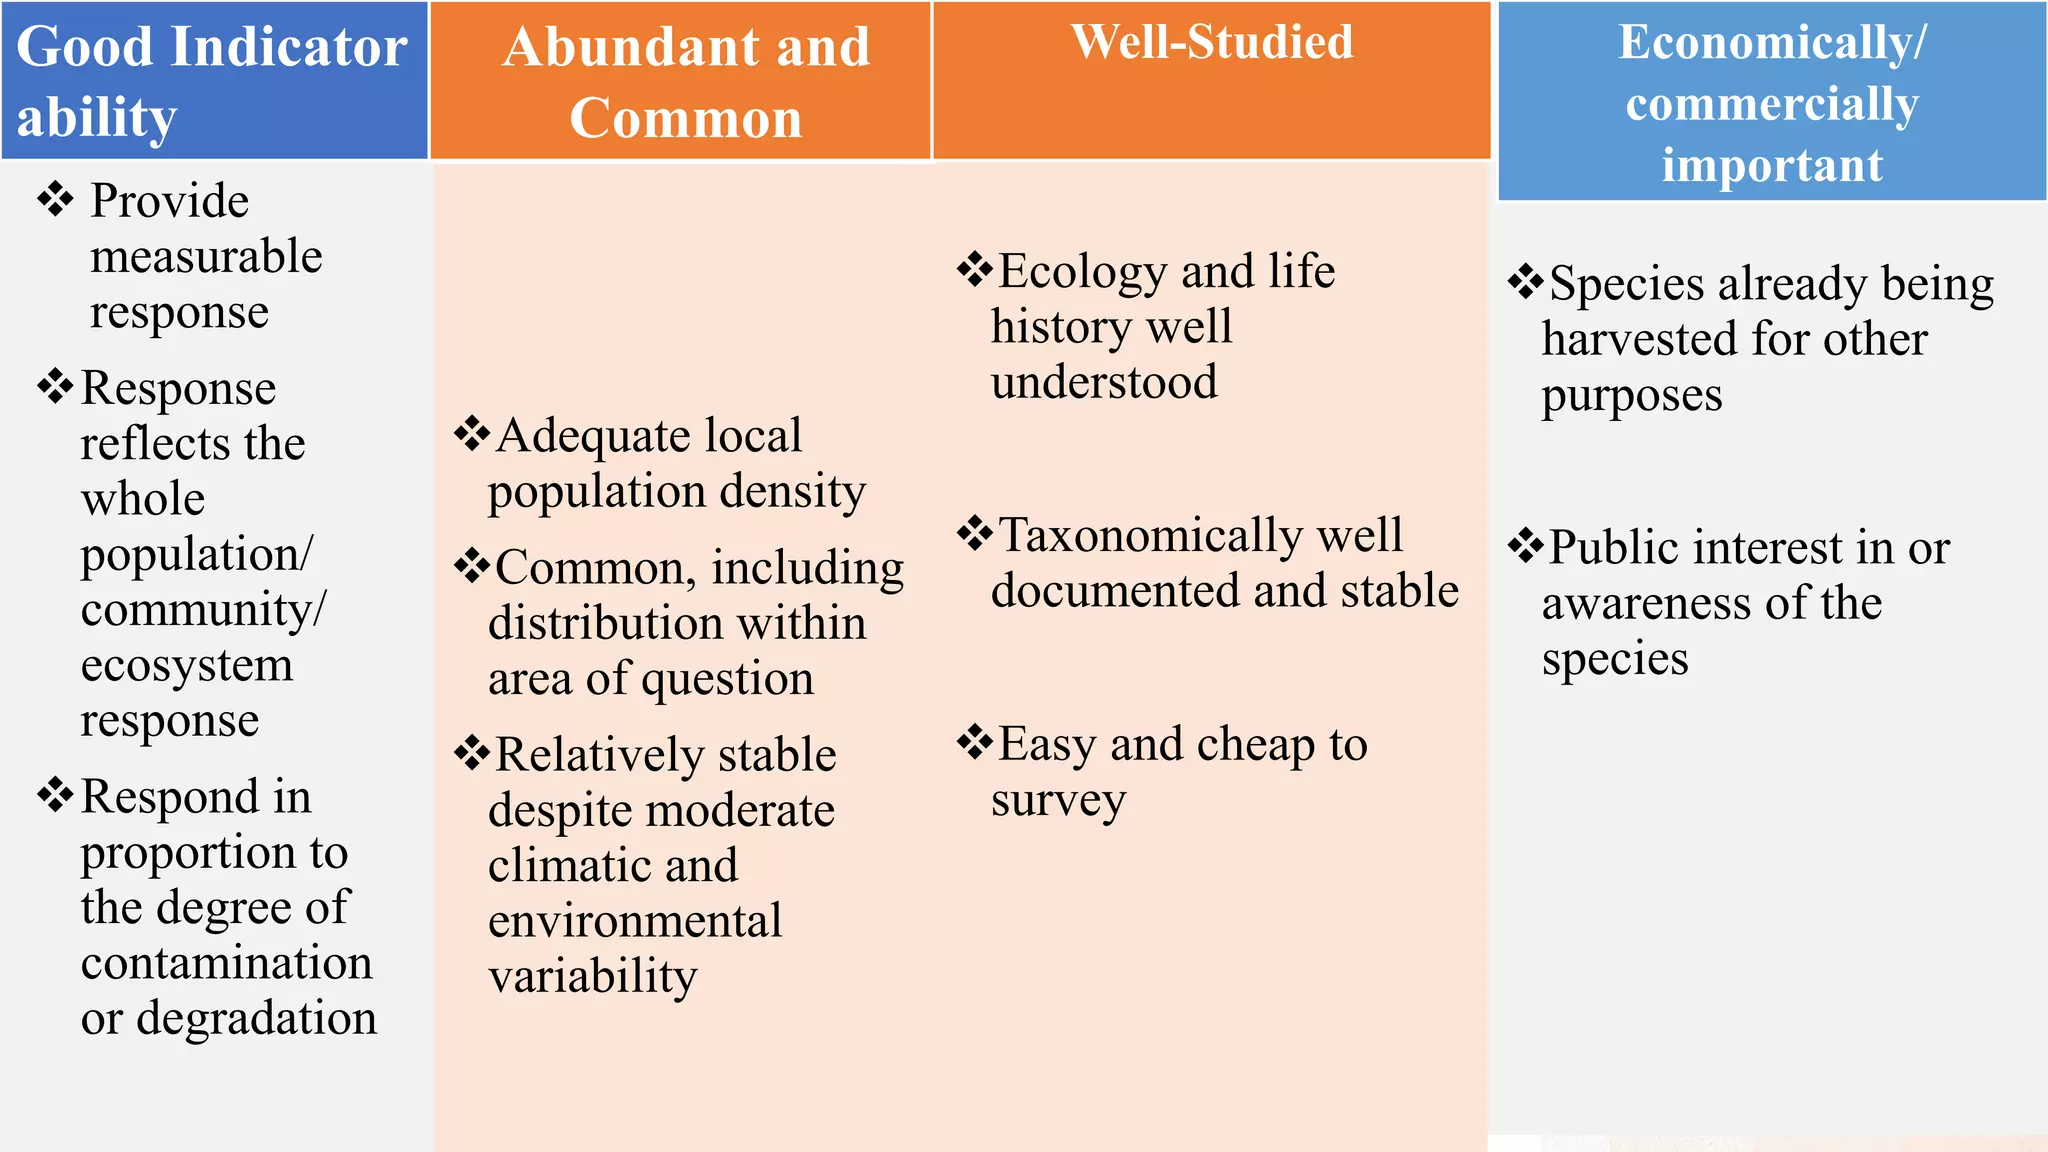
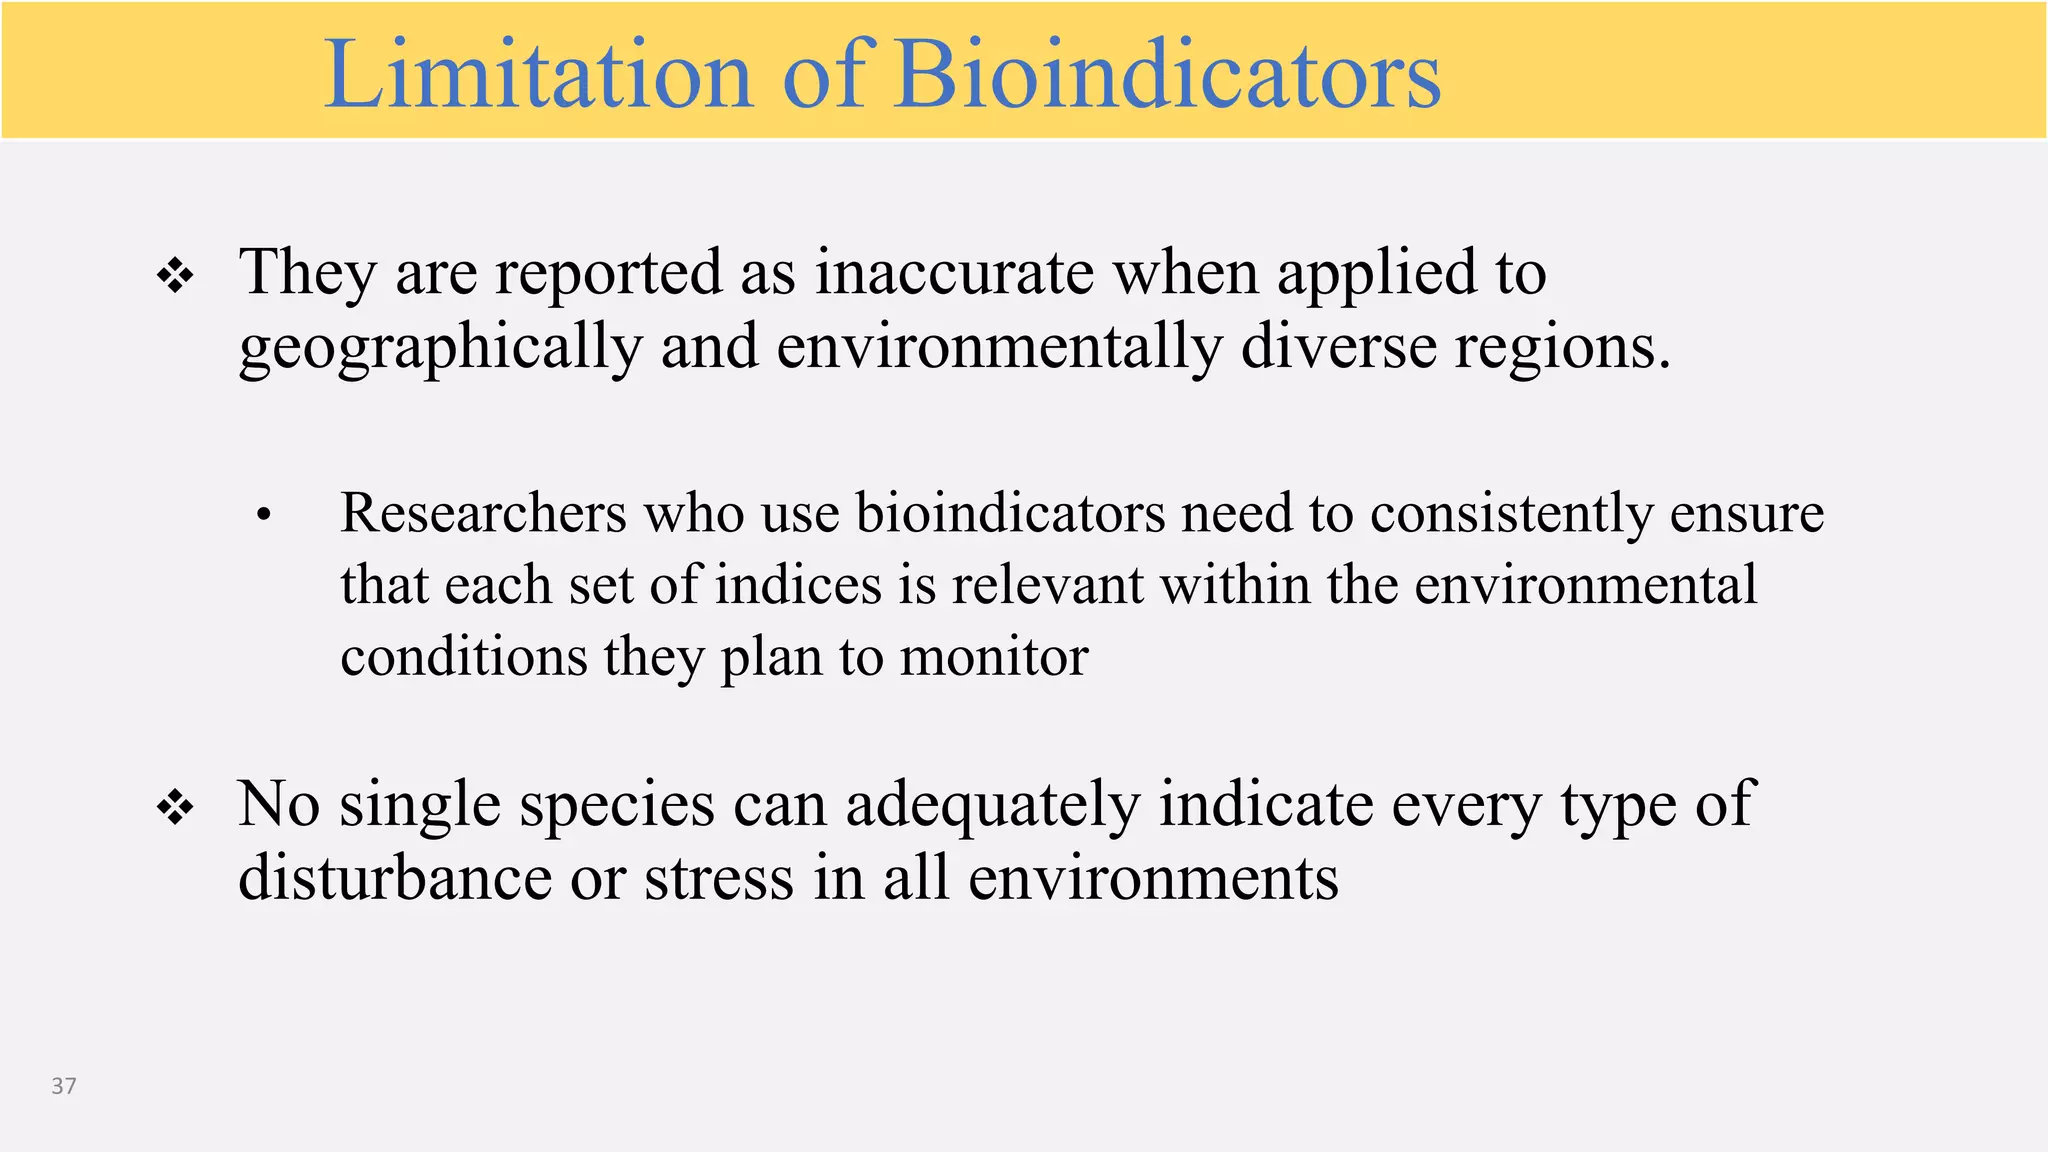
1
Topic name BIOINDICATORS
Presented To Dr. Safura Bibi
Presented By GROUP 1
Farah Sarfraz 2018-ag-942
Huma Hanif 2018-ag-1161
Tahira Yasmeen 2018-ag-1203
Saman Ihsan 2020-ag-1729
Muhammad Aslan Sohail 2020-ag-1734
Rafia Aslam 2020-ag-1737
Anber Javed 2020-ag-1738
Semester 2nd Morning
Course title Plant Biodiversity and Conservation
Course code BOT-705
UNIVERSITY OF AGRICULTURE, FAISALABAD
BIOINDICATORS
01
Introduction
to
Bioindicators
08
Characteristics of good
bioindicator
07
Macro-
invertebrates
06
Microbial
bioindicator
05
Plants as
Bioindicators
Classification
Of bioindicators
03
02
How to use
Bioindicators
04
Animals as
Bioindicators
Conclusion
BIOINDICATORS
 A bioindicator is any species (an indicator species) or group of species
whose function, population, or status can reveal the qualitative status of the
environment.
 For example,
 Copepods and other small water Crustaceans that are present in many water
bodies can be monitored for changes
▹ Greasewood indicates saline soil
▹ mosses often indicate acid soil
4
1. Their content of certain elements or compounds
2. Their morphological or cellular structure
3. Metabolic biochemical processes
4. Behaviour
5. Population structure(s).
5
The information from Bioindicators can be deduced through the
study of:
 In most instances, baseline data for biotic conditions within a pre-determined
reference site are collected.
• Reference sites must be characterized by little to no outside disturbance (e.g.
anthropogenic disturbances, land use change, invasive species).
 The biotic conditions of a specific indicator species are measured within both
the reference site and the study region over time.
 Data collected from the study region are compared against similar data
collected from the reference site in order to infer the relative environmental
health or integrity of the study region.
How to use Bioindicators
Bioindicator
selection
criteria
Abundance or
wide
distribution
Simple
procedure of
identification
and sampling
Population
stability
High
accumulating
capacity
High
tolerance for
the pollutants
analyzed
Classification of
Bioindicators
Classification of Bioindicators
Based on the
aims of
Indicators
Based on
International
Union of
Biological
Sciences
Based on the
Applications
of Indicators
Classification of Bioindicators
Compliance
Indicators
Diagnostic
indicators
Based on the aims
of Indicators
Early
Warning
Indicators
Accumulation
indicators
02
04
05
03
Animal system
Microbial system
Plants system
Macro-invertebrates
Based on International Union of
Biological Sciences
1
Cell Biology and
Genetics system
Animals that act as Bioindicators
▸ Frogs and toads
▸ Earthworm
▸ Fishes
Frogs and toads
Amphibians, particularly anurans (frogs and toads), are increasingly used as
bioindicators of contaminant accumulation in pollution studies
How they Act:
• Anurans absorb toxic chemicals through their skin.
• Their larval gill membranes and are sensitive to alterations in their environment
• They have a poor ability to detoxify pesticides.
• The residues, especially of organochlorine pesticides thus accumulate in their systems.
• Have permeable skin that can easily absorb toxic chemicals
• Thus act as model organism for assessing the effects of environmental factors .
Result:
• This may cause the decline of the amphibians population.
• These factors allow them to be used as bioindicator organisms to follow changes in their
habitats and in ecotoxicological studies due to humans increasing demands on the
environment.
Effect of exposure of Anurans to Chemicals
 Effects of exposure may result in
• Shorter body length
• Lower body mass
• Malformations of limbs or other organs.
 The slow development, late morphological change, and small metamorph size result
in
• Increased risk of mortality
• Exposure to predation.
Earthworms as Bioindicators
Earthworm density and biomass are strongly influence by contamination.
The earth worm is used as bioindicator to determine acute toxicity
Act as bio-monitoring organism for soil pollutants
Among metals, methyl mercury might be more easily absorbed by and
accumulated in earthworms, suggesting that the earthworm is an ideal candidate
for monitoring methyl mercury
Metal bioaccumulation by earthworms could be used as an ecological indicator
of metal availability.
The earthworm, Eisenia fetida, accumulates cadmium in its seminal vesicles.
 All worms living in dirt with microplastics lost weight.
Fishes as Bioindicators
 Fish is a good indicator of water pollution
 Potentially harmful substances-e.g. pesticides, heavy metals and hydrocarbons-are
often released into the aquatic environment.
 There may be an immediate impact as measured by large-scale sudden mortalities of
aquatic organisms, e.g. fish
 The end results, which may occur long after the pollutants have passed through the
environment include
• Immunosuppression
• Reduced metabolism
• Damage to gills and epithelia.
 Alleged pollution-related diseases include
• epidermal papilloma
• fin/tail rot
• gill disease
• hyperplasia
• liver damage
• neoplasia and ulceration.
Plants System
Plants can effectively be used as cheap and naturally available monitoring
systems or bioassays of the level and type of air, soil and water pollution in an
area.
The type and concentration of a pollutant can be reliably found out by various
characteristics damage symptoms produced in the plants because such damage
symptoms are pollutant specific as well as concentration specific
For example, in young needles of Pinus:
• Chlorosis indicates SO2pollution
• Necrosis indicates HF pollution
• Bleaching indicates NO2 pollution
• Chlorotic mottle indicates Cl2 pollution in the atmosphere.
Equisetum spp. indicate the presence of gold in the soil.
Plants In Freshwater Bodies
 Spread of Sphagnum moss indicate increased water acidity
 Eutrophication and water blooms indicate:
• Sewage
• Organic matter
• Chemical fertilizer
• Pollution of water.
Plants In Terrestrial Areas
 Decrease in the populations of mosses (Sphagnum, Byrum) and lichens (Parmelia)
generally indicates air pollution by SO2, NO2, fluorides and HCl.
 Absence of most bryophytes, particularly Sphagnum and Byrum indicates
atmospheric SO2 pollution of 0.17 ppm or more.
 Poikilohydrous mosses are particularly useful as pollution indicators.
 The degree of ‘Crown die-back’ and death of trees is directly related to the level of
SO2, NO2 HF and HCl pollution of air
 Changes in soil microorganism populations indicate soil pollution.
 Increase in ammonifying bacteria shows NH4 pollution,
 Reduction in nitrate and nitrite bacteria shows NO3 pollution.
 Decrease in decomposer bacterial populations indicates
• Soil acidification
• Pesticide pollution.
Microbial Bioindicator
• Microorganisms are diverse group of organisms found in large quantities and are
easier to detect
• Some microorganisms serves as standard indicator of pollution
• Bioluminescent bacteria:
• These are used to test water for environmental toxins. If there are toxins present
in the water, the cellular metabolism of bacteria is inhibited or disrupted. This
affects quality or amount of light emitted by bacteria. It is very quick method and
takes just 30 minutes to complete but could not identify the toxin
e.g. Vibrio fischeri.
Macro-invertebrates
Characteristics
of Good
Bioindicator
35
 Provide
measurable
response
Response
reflects the
whole
population/
community/
ecosystem
response
Respond in
proportion to
the degree of
contamination
or degradation
Species already being
harvested for other
purposes
Public interest in or
awareness of the
species
Ecology and life
history well
understood
Taxonomically well
documented and stable
Easy and cheap to
survey
Good Indicator
ability
Abundant and
Common
Economically/
commercially
important
Adequate local
population density
Common, including
distribution within
area of question
Relatively stable
despite moderate
climatic and
environmental
variability
Well-Studied
36
1. Scientists have traditionally conducted chemical tests and measured physical
parameters of the environment (e.g., ambient temperature, salinity, nutrients,
pollutants, available light and gas levels), whereas the use of bioindicators uses
the biota to measure the cumulative impacts of both chemical pollutants and
habitat alterations over time.
2. They indicate indirect biotic effects of pollutants when many physical or chemical
measurements cannot.
3. Through bioindicators, only the single indicating species observed to check on the
environment, there’s no need to monitor whole community.
Bioindicators Better than Traditional Methods
 They are reported as inaccurate when applied to
geographically and environmentally diverse regions.
• Researchers who use bioindicators need to consistently ensure
that each set of indices is relevant within the environmental
conditions they plan to monitor
 No single species can adequately indicate every type of
disturbance or stress in all environments
37
Limitation of Bioindicators
Conclusion
Bioindicators have a remarkable potential in
o forecasting of disasters
o prevention of pollution,
o exploration and conservation of natural resources
All aiming at a sustainable development with minimum
destruction of the biosphere.
 Bioindicator can be applied in predicting the impact of
anthropogenic activities particularly pollutants and
predicting environmental change in a timely manner.
“
39

Bioindicators

  • 1.
    1 Topic name BIOINDICATORS PresentedTo Dr. Safura Bibi Presented By GROUP 1 Farah Sarfraz 2018-ag-942 Huma Hanif 2018-ag-1161 Tahira Yasmeen 2018-ag-1203 Saman Ihsan 2020-ag-1729 Muhammad Aslan Sohail 2020-ag-1734 Rafia Aslam 2020-ag-1737 Anber Javed 2020-ag-1738 Semester 2nd Morning Course title Plant Biodiversity and Conservation Course code BOT-705 UNIVERSITY OF AGRICULTURE, FAISALABAD
  • 2.
  • 3.
    01 Introduction to Bioindicators 08 Characteristics of good bioindicator 07 Macro- invertebrates 06 Microbial bioindicator 05 Plantsas Bioindicators Classification Of bioindicators 03 02 How to use Bioindicators 04 Animals as Bioindicators Conclusion
  • 4.
    BIOINDICATORS  A bioindicatoris any species (an indicator species) or group of species whose function, population, or status can reveal the qualitative status of the environment.  For example,  Copepods and other small water Crustaceans that are present in many water bodies can be monitored for changes ▹ Greasewood indicates saline soil ▹ mosses often indicate acid soil 4
  • 5.
    1. Their contentof certain elements or compounds 2. Their morphological or cellular structure 3. Metabolic biochemical processes 4. Behaviour 5. Population structure(s). 5 The information from Bioindicators can be deduced through the study of:
  • 6.
     In mostinstances, baseline data for biotic conditions within a pre-determined reference site are collected. • Reference sites must be characterized by little to no outside disturbance (e.g. anthropogenic disturbances, land use change, invasive species).  The biotic conditions of a specific indicator species are measured within both the reference site and the study region over time.  Data collected from the study region are compared against similar data collected from the reference site in order to infer the relative environmental health or integrity of the study region. How to use Bioindicators
  • 7.
    Bioindicator selection criteria Abundance or wide distribution Simple procedure of identification andsampling Population stability High accumulating capacity High tolerance for the pollutants analyzed
  • 8.
  • 9.
    Classification of Bioindicators Basedon the aims of Indicators Based on International Union of Biological Sciences Based on the Applications of Indicators
  • 10.
    Classification of Bioindicators Compliance Indicators Diagnostic indicators Basedon the aims of Indicators Early Warning Indicators Accumulation indicators
  • 12.
    02 04 05 03 Animal system Microbial system Plantssystem Macro-invertebrates Based on International Union of Biological Sciences 1 Cell Biology and Genetics system
  • 13.
    Animals that actas Bioindicators ▸ Frogs and toads ▸ Earthworm ▸ Fishes
  • 14.
    Frogs and toads Amphibians,particularly anurans (frogs and toads), are increasingly used as bioindicators of contaminant accumulation in pollution studies How they Act: • Anurans absorb toxic chemicals through their skin. • Their larval gill membranes and are sensitive to alterations in their environment • They have a poor ability to detoxify pesticides. • The residues, especially of organochlorine pesticides thus accumulate in their systems. • Have permeable skin that can easily absorb toxic chemicals • Thus act as model organism for assessing the effects of environmental factors . Result: • This may cause the decline of the amphibians population. • These factors allow them to be used as bioindicator organisms to follow changes in their habitats and in ecotoxicological studies due to humans increasing demands on the environment.
  • 17.
    Effect of exposureof Anurans to Chemicals  Effects of exposure may result in • Shorter body length • Lower body mass • Malformations of limbs or other organs.  The slow development, late morphological change, and small metamorph size result in • Increased risk of mortality • Exposure to predation.
  • 18.
    Earthworms as Bioindicators Earthwormdensity and biomass are strongly influence by contamination. The earth worm is used as bioindicator to determine acute toxicity Act as bio-monitoring organism for soil pollutants Among metals, methyl mercury might be more easily absorbed by and accumulated in earthworms, suggesting that the earthworm is an ideal candidate for monitoring methyl mercury Metal bioaccumulation by earthworms could be used as an ecological indicator of metal availability. The earthworm, Eisenia fetida, accumulates cadmium in its seminal vesicles.  All worms living in dirt with microplastics lost weight.
  • 20.
    Fishes as Bioindicators Fish is a good indicator of water pollution  Potentially harmful substances-e.g. pesticides, heavy metals and hydrocarbons-are often released into the aquatic environment.  There may be an immediate impact as measured by large-scale sudden mortalities of aquatic organisms, e.g. fish  The end results, which may occur long after the pollutants have passed through the environment include • Immunosuppression • Reduced metabolism • Damage to gills and epithelia.  Alleged pollution-related diseases include • epidermal papilloma • fin/tail rot • gill disease • hyperplasia • liver damage • neoplasia and ulceration.
  • 22.
    Plants System Plants caneffectively be used as cheap and naturally available monitoring systems or bioassays of the level and type of air, soil and water pollution in an area. The type and concentration of a pollutant can be reliably found out by various characteristics damage symptoms produced in the plants because such damage symptoms are pollutant specific as well as concentration specific For example, in young needles of Pinus: • Chlorosis indicates SO2pollution • Necrosis indicates HF pollution • Bleaching indicates NO2 pollution • Chlorotic mottle indicates Cl2 pollution in the atmosphere. Equisetum spp. indicate the presence of gold in the soil.
  • 25.
    Plants In FreshwaterBodies  Spread of Sphagnum moss indicate increased water acidity  Eutrophication and water blooms indicate: • Sewage • Organic matter • Chemical fertilizer • Pollution of water.
  • 27.
    Plants In TerrestrialAreas  Decrease in the populations of mosses (Sphagnum, Byrum) and lichens (Parmelia) generally indicates air pollution by SO2, NO2, fluorides and HCl.  Absence of most bryophytes, particularly Sphagnum and Byrum indicates atmospheric SO2 pollution of 0.17 ppm or more.  Poikilohydrous mosses are particularly useful as pollution indicators.  The degree of ‘Crown die-back’ and death of trees is directly related to the level of SO2, NO2 HF and HCl pollution of air  Changes in soil microorganism populations indicate soil pollution.  Increase in ammonifying bacteria shows NH4 pollution,  Reduction in nitrate and nitrite bacteria shows NO3 pollution.  Decrease in decomposer bacterial populations indicates • Soil acidification • Pesticide pollution.
  • 30.
    Microbial Bioindicator • Microorganismsare diverse group of organisms found in large quantities and are easier to detect • Some microorganisms serves as standard indicator of pollution • Bioluminescent bacteria: • These are used to test water for environmental toxins. If there are toxins present in the water, the cellular metabolism of bacteria is inhibited or disrupted. This affects quality or amount of light emitted by bacteria. It is very quick method and takes just 30 minutes to complete but could not identify the toxin e.g. Vibrio fischeri.
  • 32.
  • 34.
  • 35.
    35  Provide measurable response Response reflects the whole population/ community/ ecosystem response Respondin proportion to the degree of contamination or degradation Species already being harvested for other purposes Public interest in or awareness of the species Ecology and life history well understood Taxonomically well documented and stable Easy and cheap to survey Good Indicator ability Abundant and Common Economically/ commercially important Adequate local population density Common, including distribution within area of question Relatively stable despite moderate climatic and environmental variability Well-Studied
  • 36.
    36 1. Scientists havetraditionally conducted chemical tests and measured physical parameters of the environment (e.g., ambient temperature, salinity, nutrients, pollutants, available light and gas levels), whereas the use of bioindicators uses the biota to measure the cumulative impacts of both chemical pollutants and habitat alterations over time. 2. They indicate indirect biotic effects of pollutants when many physical or chemical measurements cannot. 3. Through bioindicators, only the single indicating species observed to check on the environment, there’s no need to monitor whole community. Bioindicators Better than Traditional Methods
  • 37.
     They arereported as inaccurate when applied to geographically and environmentally diverse regions. • Researchers who use bioindicators need to consistently ensure that each set of indices is relevant within the environmental conditions they plan to monitor  No single species can adequately indicate every type of disturbance or stress in all environments 37 Limitation of Bioindicators
  • 38.
    Conclusion Bioindicators have aremarkable potential in o forecasting of disasters o prevention of pollution, o exploration and conservation of natural resources All aiming at a sustainable development with minimum destruction of the biosphere.  Bioindicator can be applied in predicting the impact of anthropogenic activities particularly pollutants and predicting environmental change in a timely manner.
  • 39.