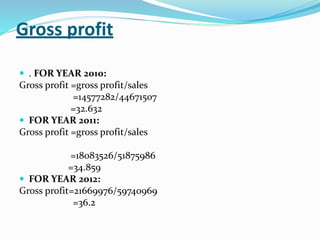
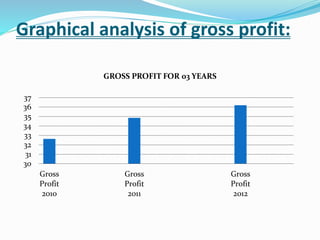
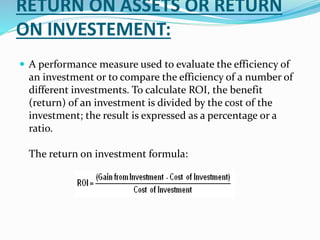
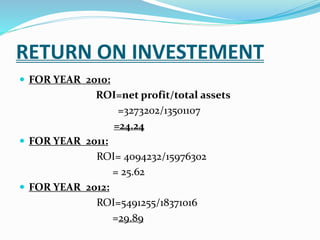
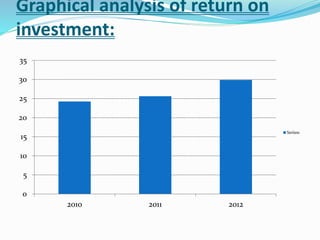
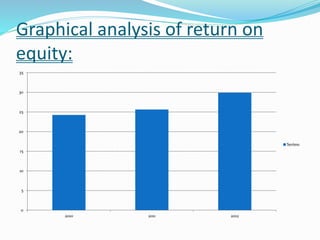
PROFITIBLITY OF
UNILEVER PAKISTAN
Introduction to Unilever
 No matter who you are, or where in the world you are, the chances
are that our products are a familiar part of your daily routine.
Every day, around the world, people reach for Unilever products.
A global management team
Sandy
Ogg
Chief HR
Officer
Geneviève
Berger
Chief R&D
Officer
Michael Polk
President
Global Foods,
Home &
Personal Care
Harish
Manwani
President
Asia, Africa
and Central
& Eastern
Europe
Doug
Baillie
President
Western
Europe
Dave Lewis
President
AmericasPaul Polman
Chief Executive
Officer
Pier Luigi
Sigismondi
Chief Supply
Chain Officer
Jean-Marc
Huët
Chief
Financial
Officer
Keith Weed
Chief Marketing
and
Communications
Officer
A global management team
A global management teamA global management team
Top 25 brands =
almost 75% of Unilever’s sales*.
* As at end 2009
Big global brands
PROFITIBLITY OF UNILEVER
PAKISTAN
 There are four basic financial ratios, which helps in
finding the profitability of a company:
 They are as follows:
 Net Profit Margin
 Gross profit
 Return on Asset or Investment
 Return on Equity
Calculation of Profitability Ratios of Unilever Company
from
Year 2010 to 2012
NET PROFT MARGIN
 A ratio of profitability calculated as net income
divided by revenues, or net profits divided by sales. It
measures how much out of every dollar of sales a
company actually keeps in earnings.
Net Profit Margin= net profit after taxes
Net sales
NET PROFIT MARGIN
 FOR YEAR 2010:
Profit margin =net profit after taxes/net sales
=3273202/44671507
=7.327
 FOR YEAR 2011:
Profit margin =net profit after taxes/net sales
=4094232/51875986
=7.892
 FOR YEAR 2012:
Profit margin =net profit after taxes/net sales
=5491255/59740969
=9.1
Graphical analysis of profit margin
0
1
2
3
4
5
6
7
8
9
10
Net P.M
in 2010
Net P.M
in 2011
Net P.M
in 2012
N.PMargin
NET PROFIT MARGIN FOR 03 YEARS
Gross profit
 A gross profit measure the efficiency of operations and
firm pricing policies.
Gross profit=gross profit
Net sales
 Gross profit =sales -cost of sales
Gross profit
 . FOR YEAR 2010:
Gross profit =gross profit/sales
=14577282/44671507
=32.632
 FOR YEAR 2011:
Gross profit =gross profit/sales
=18083526/51875986
=34.859
 FOR YEAR 2012:
Gross profit=21669976/59740969
=36.2
Graphical analysis of gross profit:
30
31
32
33
34
35
36
37
Gross
Profit
2010
Gross
Profit
2011
Gross
Profit
2012
GROSS PROFIT FOR 03 YEARS
RETURN ON ASSETS OR RETURN
ON INVESTEMENT:
 A performance measure used to evaluate the efficiency of
an investment or to compare the efficiency of a number of
different investments. To calculate ROI, the benefit
(return) of an investment is divided by the cost of the
investment; the result is expressed as a percentage or a
ratio.
The return on investment formula:
RETURN ON INVESTEMENT
 FOR YEAR 2010:
ROI=net profit/total assets
=3273202/13501107
=24.24
 FOR YEAR 2011:
ROI= 4094232/15976302
= 25.62
 FOR YEAR 2012:
ROI=5491255/18371016
=29.89
Graphical analysis of return on
investment:
0
5
10
15
20
25
30
35
2010 2011 2012
Series1
RETURN ON EQUITY
 The amount of net income returned as a percentage of shareholders
equity. Return on equity measures a corporation's profitability by
revealing how much profit a company generates with the money
shareholders have invested.
ROE is expressed as a percentage and calculated as:
Return on Equity = Net Income / Shareholder's Equity
RETURN ON EQUITY:
 FOR YEAR 2010:
Return on equity = net profit after sales/shareholder equity
Or
Return on equity = net profit after sales/net
(*net sales /total assets*total assets/shareholder equity)
FOR YEAR 2010: =3273202/3560318
=91.618
 FOR YEAR 2011:
Return on equity =4094232/4183635
=97.863
 FOR YEAR 2012:
Return on equity= 5491255/5249418
=104.606
Graphical analysis of return on
equity:
0
5
10
15
20
25
30
35
2010 2011 2012
Series1
Conclusion:
 Conclusionly,we can say that Unilever Company’s
overall profitability performance is quite good and
rapidly increasing with the passage of year as per
calculated. The sales of the company are increasing
and the taxation is very low, as Unilever is among the
world’s leading brand. The graphical representation of
the ratios has clearly shown the image of the profit
returns of the company. And finally, financial ratio
plays a leading role in finding the company or an
industry’s yearly performance among its competitors
Unilever Pakistan

Unilever Pakistan

  • 2.
  • 3.
    Introduction to Unilever No matter who you are, or where in the world you are, the chances are that our products are a familiar part of your daily routine. Every day, around the world, people reach for Unilever products.
  • 4.
    A global managementteam Sandy Ogg Chief HR Officer Geneviève Berger Chief R&D Officer Michael Polk President Global Foods, Home & Personal Care Harish Manwani President Asia, Africa and Central & Eastern Europe Doug Baillie President Western Europe Dave Lewis President AmericasPaul Polman Chief Executive Officer Pier Luigi Sigismondi Chief Supply Chain Officer Jean-Marc Huët Chief Financial Officer Keith Weed Chief Marketing and Communications Officer A global management team A global management teamA global management team
  • 5.
    Top 25 brands= almost 75% of Unilever’s sales*. * As at end 2009 Big global brands
  • 6.
    PROFITIBLITY OF UNILEVER PAKISTAN There are four basic financial ratios, which helps in finding the profitability of a company:  They are as follows:  Net Profit Margin  Gross profit  Return on Asset or Investment  Return on Equity
  • 7.
    Calculation of ProfitabilityRatios of Unilever Company from Year 2010 to 2012
  • 8.
    NET PROFT MARGIN A ratio of profitability calculated as net income divided by revenues, or net profits divided by sales. It measures how much out of every dollar of sales a company actually keeps in earnings. Net Profit Margin= net profit after taxes Net sales
  • 9.
    NET PROFIT MARGIN FOR YEAR 2010: Profit margin =net profit after taxes/net sales =3273202/44671507 =7.327  FOR YEAR 2011: Profit margin =net profit after taxes/net sales =4094232/51875986 =7.892  FOR YEAR 2012: Profit margin =net profit after taxes/net sales =5491255/59740969 =9.1
  • 10.
    Graphical analysis ofprofit margin 0 1 2 3 4 5 6 7 8 9 10 Net P.M in 2010 Net P.M in 2011 Net P.M in 2012 N.PMargin NET PROFIT MARGIN FOR 03 YEARS
  • 11.
    Gross profit  Agross profit measure the efficiency of operations and firm pricing policies. Gross profit=gross profit Net sales  Gross profit =sales -cost of sales
  • 12.
    Gross profit  .FOR YEAR 2010: Gross profit =gross profit/sales =14577282/44671507 =32.632  FOR YEAR 2011: Gross profit =gross profit/sales =18083526/51875986 =34.859  FOR YEAR 2012: Gross profit=21669976/59740969 =36.2
  • 13.
    Graphical analysis ofgross profit: 30 31 32 33 34 35 36 37 Gross Profit 2010 Gross Profit 2011 Gross Profit 2012 GROSS PROFIT FOR 03 YEARS
  • 14.
    RETURN ON ASSETSOR RETURN ON INVESTEMENT:  A performance measure used to evaluate the efficiency of an investment or to compare the efficiency of a number of different investments. To calculate ROI, the benefit (return) of an investment is divided by the cost of the investment; the result is expressed as a percentage or a ratio. The return on investment formula:
  • 15.
    RETURN ON INVESTEMENT FOR YEAR 2010: ROI=net profit/total assets =3273202/13501107 =24.24  FOR YEAR 2011: ROI= 4094232/15976302 = 25.62  FOR YEAR 2012: ROI=5491255/18371016 =29.89
  • 16.
    Graphical analysis ofreturn on investment: 0 5 10 15 20 25 30 35 2010 2011 2012 Series1
  • 17.
    RETURN ON EQUITY The amount of net income returned as a percentage of shareholders equity. Return on equity measures a corporation's profitability by revealing how much profit a company generates with the money shareholders have invested. ROE is expressed as a percentage and calculated as: Return on Equity = Net Income / Shareholder's Equity
  • 18.
    RETURN ON EQUITY: FOR YEAR 2010: Return on equity = net profit after sales/shareholder equity Or Return on equity = net profit after sales/net (*net sales /total assets*total assets/shareholder equity) FOR YEAR 2010: =3273202/3560318 =91.618  FOR YEAR 2011: Return on equity =4094232/4183635 =97.863  FOR YEAR 2012: Return on equity= 5491255/5249418 =104.606
  • 19.
    Graphical analysis ofreturn on equity: 0 5 10 15 20 25 30 35 2010 2011 2012 Series1
  • 21.
    Conclusion:  Conclusionly,we cansay that Unilever Company’s overall profitability performance is quite good and rapidly increasing with the passage of year as per calculated. The sales of the company are increasing and the taxation is very low, as Unilever is among the world’s leading brand. The graphical representation of the ratios has clearly shown the image of the profit returns of the company. And finally, financial ratio plays a leading role in finding the company or an industry’s yearly performance among its competitors