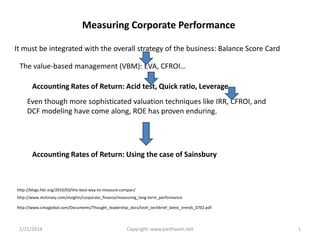
An Organization Should Approach All Tasks With The Idea That They Can Be Accomplished In A Superior Fashion
An organization capability refers to the way systems and people in the organization work together to get things done. The way leaders foster shared mindsets, orchestrate talent, encourage speed of change, collaborate across boundaries, and learn and hold each other accountable define the company's culture and leadership edge.
The firm’s ability to manage people
to gain competitive advantage.
• focuses on internal processes and systems for meeting customer needs
• creates organization-specific competencies that provide competitive advantage since they are unique
• ensures that employee skills and efforts are directed toward achieving organizational goals and strategies
A document issued by a recognized agency, and dealing with design and safety requirements relating to a specific product.
EXAMPLES
The U.S. Occupational Safety and Health Administration (051-IA) and the American National Standards Institute (ANSI).
OSHA standards are generally legally binding for an employer,
while ANSI standards are generally of an advisory nature. set industry standards with input from industry representatives and consumers.
“ Value Chain Analysis (VCA) is a process where a firm identifies its primary and support activities that add to its final product and then analysis to reduce costs or increase differentiation.”
“ Value Chain represents the internal activities a firm engages in when transforming inputs into outputs.”
Organizational Appraisal is the process of monitoring an organization’s internal environment to identify strengths and weaknesses that may influence the firms ability to achieve GOALS. It include identifying strengths and weaknesses.
A document issued by a recognized agency, and dealing with design and safety requirements relating to a specific product.
EXAMPLES
The U.S. Occupational Safety and Health Administration (051-IA) and the American National Standards Institute (ANSI).
OSHA standards are generally legally binding for an employer,
while ANSI standards are generally of an advisory nature. set industry standards with input from industry representatives and consumers.
A measurement of the quality
of an organization's policies, products, programs, strategies, etc., and their comparison with standard measurements, or similar measurements of its peers.
Management audit is a total surgery of an organisation. It diverts from the traditional financial audit and focuses on the objectives, plans, organisational structure and the right business strategy. It is of interest to the practioners and students to understanding of technical issues covering the business operation. It actually focuses on the Value for Money Audit Methodology.
With a relatively poor economy, many companies are now looking to enhance their bottom line through cost cutting. Often, the finance function is one part of G&A subject to this cost cutting exercise. This presentatio shares with you how companies are looking at finance and evaluating where and how much to cut.
The key proposition of Enterprise Risk Management is value creation and or enhancement which ultimately delivers sustainable comparative advantage exemplified by organizational excellence. This presentation highlights key components of both management concepts and points of congruence.
Ratios and Formulas in Customer Financial AnalysisFinancial stat.docxcatheryncouper
Ratios and Formulas in Customer Financial Analysis
Financial statement analysis is a judgmental process. One of the primary objectives is identification of major changes in trends, and relationships and the investigation of the reasons underlying those changes. The judgment process can be improved by experience and the use of analytical tools. Probably the most widely used financial analysis technique is ratio analysis, the analysis of relationships between two or more line items on the financial statement. Financial ratios are usually expressed in percentage or times. Generally, financial ratios are calculated for the purpose of evaluating aspects of a company's operations and fall into the following categories:
· Liquidity ratios measure a firm's ability to meet its current obligations.
· Profitability ratios measure management's ability to control expenses and to earn a return on the resources committed to the business.
· Leverage ratios measure the degree of protection of suppliers of long-term funds and can also aid in judging a firm's ability to raise additional debt and its capacity to pay its liabilities on time.
· Efficiency, activity or turnover ratios provide information about management's ability to control expenses and to earn a return on the resources committed to the business.
A ratio can be computed from any pair of numbers. Given the large quantity of variables included in financial statements, a very long list of meaningful ratios can be derived. A standard list of ratios or standard computation of them does not exist. The following ratio presentation includes ratios that are most often used when evaluating the credit worthiness of a customer. Ratio analysis becomes a very personal or company driven procedure. Analysts are drawn to and use the ones they are comfortable with and understand.
1. Liquidity Ratios
Working Capital
Working capital compares current assets to current liabilities, and serves as the liquid reserve available to satisfy contingencies and uncertainties. A high working capital balance is mandated if the entity is unable to borrow on short notice. The ratio indicates the short-term solvency of a business and in determining if a firm can pay its current liabilities when due.
Formula
Current Assets - Current Liabilities
Acid Test or Quick Ratio
A measurement of the liquidity position of the business. The quick ratio compares the cash plus cash equivalents and accounts receivable to the current liabilities. The primary difference between the current ratio and the quick ratio is the quick ratio does not include inventory and prepaid expenses in the calculation. Consequently, a business's quick ratio will be lower than its current ratio. It is a stringent test of liquidity.
Formula
Cash + Marketable Securities + Accounts Receivable
Current Liabilities
Current Ratio
provides an indication of the liquidity of the business by comparing the amount of current assets to current liabilities. A business's curren ...
This slides tackles about the Financial statement of the organisation and the needs to analysing it. It is very important especially that the company needs to make a sound judgment and decision to the operation of the company.
EBITDA and Other Scary Words (Series: MBA Boot Camp 2020) Financial Poise
This webinar explores the ins and outs of financial language and how you can navigate the seeming labyrinth of a language that can sound foreign and in some ways counterintuitive. This webinar teaches the correct use of EBIT, EBITDA and EBITDAR while also dealing with concepts like Cap Rate vs. Capital Cost. This webinar also sheds light on issues with ROI and Payback among other valuation tools and explains what a Cash Conversion Cycle looks like for your business.
To listen to this webinar on demand, go to: https://www.financialpoise.com/financial-poise-webinars/ebitda-and-other-scary-words-2020/
EBITDA and Other Scary Words (Series: MBA Boot Camp)Financial Poise
This webinar explores the ins and outs of financial language and how you can navigate the seeming labyrinth of a language that can sound foreign and in some ways counterintuitive. This webinar teaches the correct use of EBIT, EBITDA and EBITDAR while also dealing with concepts like Cap Rate vs. Capital Cost. This webinar also sheds light on issues with ROI and Payback among other valuation tools and explains what a Cash Conversion Cycle looks like for your business.
To view the accompanying webinar, go to:https://www.financialpoise.com/financial-poise-webinars/ebitda-and-other-scary-words-2021/
Product development is in low frequency protype stage.
About the product: Become strategic human trader with AI. Chatbot and dashboard based strategic trading and investment.
PREDICTION OF FUTURE RATINGS OF COMPANIES, THOSE ARE RATED BY BROKER FIRMSAlgoix Technologies LLP
None of the attributes are perfectly correlated, even it is rare in life but out of these three attributes, range of offerings is highly correlated to ratings. Where as the ease of use has weak relation of only 0.42 with star rating. Trade execution which is important quality of the broker firm has 0.746 correlations. Correlation of rating and ranges is 0.827.
Diversification in asset class can reduce the risk and also can generate defined return based on the inventor’s risk perception. Client’s objective to get post retirement cash flow, financing and refinancing of mortgage loan is successfully implemented here.
Risk and return is related get high importance in portfolio construction. From Markowitz’s concept of the mean –variance relationship and along with modern creation of synthetic fund, the risk aversion nature of investors gets importance. The return of the portfolio decreases with the diversification but portfolios from efficient frontiers satisfy the need of investors.
To what extent regulation, requiring disclosure of analyst rating distributio...Algoix Technologies LLP
To what extent regulation, requiring disclosure of analyst rating distributions to the public by brokerage firms, could lead to inefficiency in the distribution of ratings. Testable propositions are 1) that speculative, high-performing industries were massively upgraded with a higher percentage of buy ratings and 2) average or below average industries were punished with a higher percentage of hold and sell ratings.
Being on the same page and you understand how we intend to understand all the drivers of supermarket A's demand using competitors pattern of growth in demand per district and for lifestyle and special products, increase in delivery rate and pattern of supermarket A's customer growth or evolution of its turnover
Here output is attached of pairs trading strategy using R. Daily free data of NIFTY and included bank stock are used for analysis. For details on strategy building, statistical analysis and financial model visit www.financemodel.co
technical analysis of NIFTY, stock using R. Tested on daily and minutes data. Low frequency trading can also be possible through minor programming knowledge.
Embracing GenAI - A Strategic ImperativePeter Windle
Artificial Intelligence (AI) technologies such as Generative AI, Image Generators and Large Language Models have had a dramatic impact on teaching, learning and assessment over the past 18 months. The most immediate threat AI posed was to Academic Integrity with Higher Education Institutes (HEIs) focusing their efforts on combating the use of GenAI in assessment. Guidelines were developed for staff and students, policies put in place too. Innovative educators have forged paths in the use of Generative AI for teaching, learning and assessments leading to pockets of transformation springing up across HEIs, often with little or no top-down guidance, support or direction.
This Gasta posits a strategic approach to integrating AI into HEIs to prepare staff, students and the curriculum for an evolving world and workplace. We will highlight the advantages of working with these technologies beyond the realm of teaching, learning and assessment by considering prompt engineering skills, industry impact, curriculum changes, and the need for staff upskilling. In contrast, not engaging strategically with Generative AI poses risks, including falling behind peers, missed opportunities and failing to ensure our graduates remain employable. The rapid evolution of AI technologies necessitates a proactive and strategic approach if we are to remain relevant.
Palestine last event orientationfvgnh .pptxRaedMohamed3
An EFL lesson about the current events in Palestine. It is intended to be for intermediate students who wish to increase their listening skills through a short lesson in power point.
Macroeconomics- Movie Location
This will be used as part of your Personal Professional Portfolio once graded.
Objective:
Prepare a presentation or a paper using research, basic comparative analysis, data organization and application of economic information. You will make an informed assessment of an economic climate outside of the United States to accomplish an entertainment industry objective.
Honest Reviews of Tim Han LMA Course Program.pptxtimhan337
Personal development courses are widely available today, with each one promising life-changing outcomes. Tim Han’s Life Mastery Achievers (LMA) Course has drawn a lot of interest. In addition to offering my frank assessment of Success Insider’s LMA Course, this piece examines the course’s effects via a variety of Tim Han LMA course reviews and Success Insider comments.
Welcome to TechSoup New Member Orientation and Q&A (May 2024).pdfTechSoup
In this webinar you will learn how your organization can access TechSoup's wide variety of product discount and donation programs. From hardware to software, we'll give you a tour of the tools available to help your nonprofit with productivity, collaboration, financial management, donor tracking, security, and more.
Instructions for Submissions thorugh G- Classroom.pptxJheel Barad
This presentation provides a briefing on how to upload submissions and documents in Google Classroom. It was prepared as part of an orientation for new Sainik School in-service teacher trainees. As a training officer, my goal is to ensure that you are comfortable and proficient with this essential tool for managing assignments and fostering student engagement.
Instructions for Submissions thorugh G- Classroom.pptx
Measuring corporate performance
1. Measuring Corporate Performance
It must be integrated with the overall strategy of the business: Balance Score Card
The value-based management (VBM): EVA, CFROI…
Accounting Rates of Return: Acid test, Quick ratio, Leverage …
Even though more sophisticated valuation techniques like IRR, CFROI, and
DCF modeling have come along, ROE has proven enduring.
Accounting Rates of Return: Using the case of Sainsbury
http://blogs.hbr.org/2010/03/the-best-way-to-measure-compan/
http://www.mckinsey.com/insights/corporate_finance/measuring_long-term_performance
http://www.cimaglobal.com/Documents/Thought_leadership_docs/tech_techbrief_latest_trends_0702.pdf
2/21/2014
Copyright: www.parthasen.net
1
3. When accountants draw up an income statement, they start with revenues and
then deduct operating and other costs. But one important cost is not included: the
cost of the capital the firm employs. Therefore, to see whether the firm has truly
created value, we need to measure whether it has earned a profit after deducting
all costs, including the cost of its capital.
The profit after deducting all costs, including the cost of capital, is called the
company’s economic value added or EVA.
EVA, or residual income, is a better measure of a company’s performance
than is accounting income. Accounting income is calculated after deducting
all costs except the cost of capital. By contrast, EVA recognizes that companies
need to cover their opportunity costs before they add value.
EVA makes the cost of capital visible to operating managers. There is a clear target:
Earn at least the cost of capital on assets employed. A plant or divisional manager
can improve EVA by reducing assets. Evaluating performance by EVA pushes
managers to flush out and dispose of underutilized assets. Therefore, a growing
number of firms now calculate EVA and tie managers’ compensation to it.
http://highered.mcgraw-hill.com/sites/dl/free/0078034647/925726/bmm7e_sample_ch04.pdf
2/21/2014
Copyright: www.parthasen.net
3
5. Return on equity = (return on assets) *(Assets/equity)
Assets/equity is the ratio for measuring the long term solvency of any firm. This ratio is
actually useful for measuring the financial leverage. Through this ratio the use of debt
and equity in financing for a firm is measured. Debt and equity have different cost and
risk; cost of equity and cost of debt is different for any company is more specific to
illustrate here. This use of debt and equity in total asset can denote the capital
structure of the company. This ratio is useful to get the idea on above fact for any firm
and varies accordingly with different industry and company. High value of the ratio may
be the reason of the better return from borrowing than the cost of capital but this
higher value can raise the interest amount and risk excessively.
2/21/2014
Copyright: www.parthasen.net
5
6. Return on assets indicates that how much dollar of sales the firm generated
from one dollar asset. This ratio is not fixed rather changes with the pattern of
industry. Return on assets of car industry or of retail industry is different as the
requirement of assets for the operation is different and purposeful. Asset
includes fixed asset and current asset. Under current assets it is usual to
include parts working capital like cash, marketable securities, account payable,
account receivables, inventory etc. And under fixed asset, machines, land,
buildings and other capital equipment are inclusive. Return on assets can be
calculated as either through (net profit margin* asset turn over) or through
(net income % assets for the period). If any industry has lower return on assets
then that industry can be told as high asset intensive industry and same way
when return on assets has higher value then industry can be told as low asset
intensive industry. Any manufacturing industry is asset heavy industry and any
software industry is asset light industry.
Return on assets (ROA)= After-tax operating income as a percentage of total assets.
2/21/2014
Copyright: www.parthasen.net
6
7. This return of assets can decomposed further as below:
ROA=Net profit /assets= (Net profit/sales)*(Sales/Assets) = Net profit margin*
Asset turnover
Hence change in the ROA can be further explained through the profit margin and
asset turnover. Lower return on assets can explained thorough lower margin or
lower asset turnover. Lower Asset turnover can be the reason of lower sales in
comparison to other companies in the same industry or in comparison to the
previous year. May be the lower variation of change can lead to higher change in
return of assets. This situation can be explained through the cost structure of the
company. Cost of company is the sum of variable and fixed cost and those are
like cost of goods sold(COGS), administrative expenses, overhead expenses,
interest due to debt ( this is dependent to the leverage of the firm and
asset/equity part of this Du Pont analysis) and taxes. If the firm has higher cost
structure then net income can be reduced after considerable good amount of
sales. Because the net income is sales minus total cost. Cost structure of the firm
is dependent to the capital structure, economy of scale etc.
2/21/2014
Copyright: www.parthasen.net
7
8. Profitability: profitability
of Sainsbury
6.00%
5.00%
4.00%
3.00%
2.00%
1.00%
0.00%
Gross Margin
Operating margin
Net profit margin
2012
2011
2010
In order to understand revenue generation capacity of a company against utilization of
assets, sales volume, and equity of that business, profitability ratios are applied.
The volume of investment made to a business and other factors are measured against the
revenue, cash flow, and profits by these ratios. The optimization of business profitability is
also measured by profitability ratio such as, return on equity or ROE, return on sales, gross
profit margin, net profit margin and return on capital employed.
Gross profit margin represents the proportion of gross profit to sales revenue. Here, gross
profit is calculated by deducting cost of sales from gross sales. This ratio implies at what
percentage gross profit is higher than production and expressed as, Gross profit/revenue=
Gross profit Margin. Net profit margin represents the relative volume of profitability against
sales where profitability is derived by deducting tax. This ratio is represented as Net profit
margin= profit after tax/revenue volume. Gross profit margin, operating profit margin and
net profit margin have increased from 2010 but decreased from 2011.
2/21/2014
Copyright: www.parthasen.net
8
9. Return on equity
12.00
11.50
11.00
10.50
10.00
2010
2011
2012
Return on equity highlights the net income gained in relation to the
shareholders percentage of equity. The equation of this ratio is return
on equity= net income (after tax)/ equity of shareholders. In 2012 the
return on equity is also rapidly decreased in line with margin.
2/21/2014
Copyright: www.parthasen.net
9
10. Liquidity
0.70
0.60
0.50
0.40
0.30
0.20
Current ratio
Quick ratio
0.10
0.00
2010
2011
2012
Sainsbury’s current and quick ratios are far below than 1 and lesser than sector
average (appendix) but the value has increased from last year. So the liquidity has
recovered from last year but still below the par level.
The near term debt repayment capacity of a business is measured by the liquidity ratios and
the risk of default can also be inferred from such ratios by further analysis. The volume of
cash and different liquid assets are measured against the current liabilities and volume of
borrowings for short time. The liquidity ratios bring out the amount of cash and other liquid
assets present in a business to repay current liabilities and debt obligations of short period
of time if this ratio generates value above 1; it signifies that all short term liabilities are
included in the volume of liquid assets of that business. Quick ratio is used to know the
short term liquidity of a company along with the business condition. This ratio is expressed
as current assets(less inventory)/current liabilities. Another type of liquidity ratio is current
ratio which reveals a firm’s capacity to repay short run debts and is represented by the
equation: current ratio= current assets / current liabilities.
2/21/2014
Copyright: www.parthasen.net
10
11. Working Capital Efficiency
Asset Turnover
Inventory turnover
Collection period
0.56
4.40%
7.00
4.20%
0.55
6.00
4.00%
5.00
0.55
3.80%
4.00
0.54
3.60%
3.40%
3.00
2.00
0.54
1.00
3.20%
0.53
3.00%
2012
2011
2010
0.00
2012
2011
2010
2012
2011
2010
The efficient management of working capital is known from the efficiency ratios which demonstrate the
management and usage pattern of assets like, inventories of a business along with the efficiency of
business in accumulating money. The amount of time needed by a business to convert the account
receivables into cash can be derived by the term collection period which is calculated through dividing 365
by the ratio of sales/account receivables. The quantity of turns present in the inventory is measured by
the sales to inventory ratio. If the value is high, it signifies decrease in sales and low value of ratio
highlights a dormant inventory of business. This ratio is reflected by the equation annual net sales divided
by inventory. Asset turnover ratio is effective in understanding the percentage of money invested in
purchasing assets for developing the sales level for a year. An output of higher percentage signifies less
aggressive sales efforts made by the business, whereas a low percentage denotes the strain on present
assets of a firm given by the same. This ratio is represented as asset turnover ratio= total assets/ net
sales.
Copyright: www.parthasen.net
11
12. Long term financial structure
80.00
60.00
40.00
Debt to Equity
20.00
debt to capital
0.00
2012
2011
2010
Sainsbury’s leverage is above the level as 50% leverage is standard and signifies long term illiquidity also
shows the slightly higher business risk.
The economic strength of a business for long run is the great concern of the stakeholders, especially of
the creditors of long term debt as for example, financial institutions and debenture holders. To analyze
the financial position of a business capital structure or financial leverage ratios are useful.
The volume of total debt relative to the total equity is calculated by debt to equity ratio. Greater amount
of this ratio signifies a business having greater volume of expenditure for paying interest. This ratio also
analyzes the occurrence of liquidation of a business as investors and creditor will be interest to know the
negative aspects of the business in case the business starts winding up.
Debt ratio is calculated dividing total debt by total capital. In case of assured revenue generation debt is
not dysfunctional; however it may be a trouble if the business gets instable revenues. The positive aspect
of debt is it is considered as an expenditure that helps in deducting tax.
2/21/2014
Copyright: www.parthasen.net
12
13. Investor’s viewpoint
350.00
300.00
250.00
200.00
150.00
100.00
50.00
0.00
2010
2011
EPS
P/E
Price
2012
Stocks are evaluated mainly by the price to earnings or P/E ratio by the investors
measuring the stock price of a company relative to the earning per share. This ratio also
highlights the deserved value of a business in comparison to the net profit of the same. In
order to predict the business performance for forthcoming year forward P/E ratio is utilized
based on the net profit that already has developed certain expectation level. Forward P/E
would be near to the actual figure of profits, if the accuracy of prediction is high. (J
Sainsbury, 2012; FT, 2013 & FT, 2013a)
2/21/2014
Copyright: www.parthasen.net
13