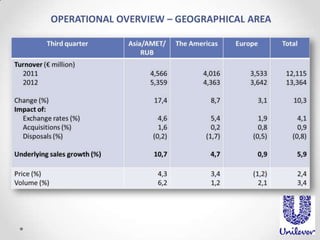
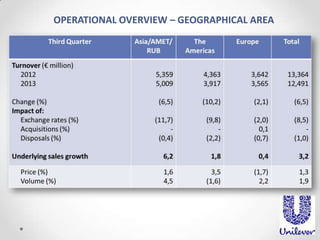
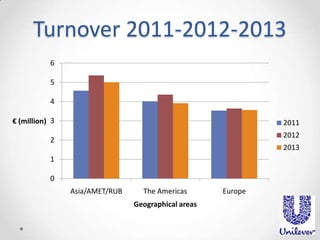
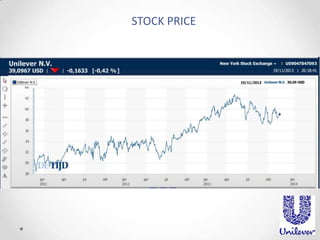
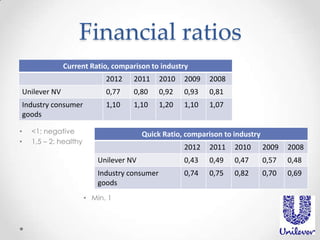
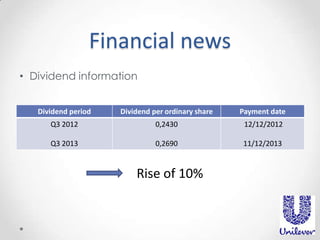
Jana Verbeke

2013-2014
• Unilever

Overview

• A financial analysis
 comparing quarters
3rd quarter 2012 vs. 3rd quarter 2013

 financial news
stock price
financial ratios
dividend information
• Conclusion
• Sources
Unilever
• Multinational

• Food/beverages/cleaning agents/personal care
products

• > 400brands
OPERATIONAL OVERVIEW – GEOGRAPHICAL AREA
Turnover 2011-2012-2013
6
5
4
€ (million) 3

2011
2012

2

2013

1
0
Asia/AMET/RUB

The Americas
Geographical areas

Europe
STOCK PRICE
Financial ratios
Current Ratio, comparison to industry

2012

2010

2009

2008

Unilever NV

0,77

0,80

0,92

0,93

0,81

Industry consumer
goods
•
•

2011

1,10

1,10

1,20

1,10

1,07

<1: negative
1,5 – 2: healthy

Quick Ratio, comparison to industry
2012

2011

2010

2009

2008

Unilever NV

0,43

0,49

0,47

0,57

0,48

Industry consumer
goods

0,74

0,75

0,82

0,70

0,69

• Min. 1
Financial news
• Dividend information
Dividend period

Dividend per ordinary share

Payment date

Q3 2012

0,2430

12/12/2012

Q3 2013

0,2690

11/12/2013

Rise of 10%
Conclusion
 Knowhow
 Continuing Growth
 Dividend
 Lots of potential
Sources
Unilever (2013). Q3 trading statement. Retrieved from:
www.unilever.com/investorrelations/
De Tijd (2013). Grafiek. Retrieved from:
http://grafieken.tijd.be/330011791
www.valuta-omrekenen.nl
https://europeanequities.nyx.com/nl/products/equitie
s/GB00B10RZP78-XHFT/quotes
Thank you for watching
my slidecast presentation

Unilever