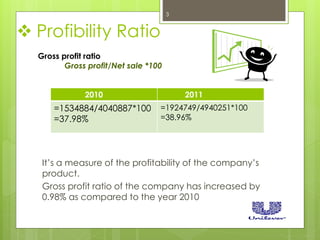
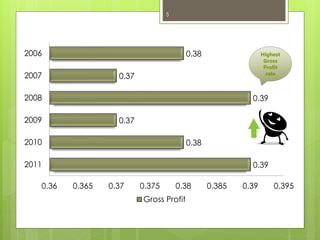
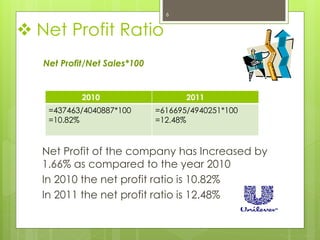
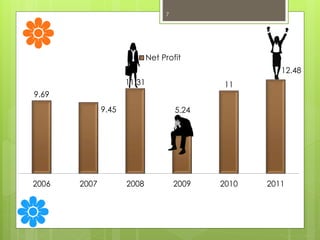
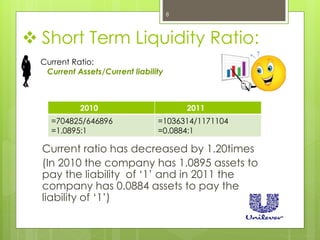
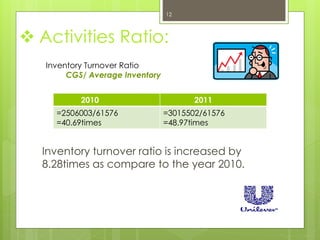
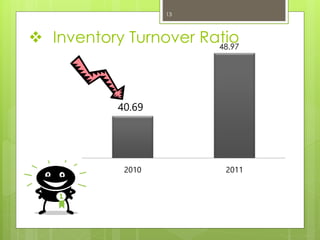
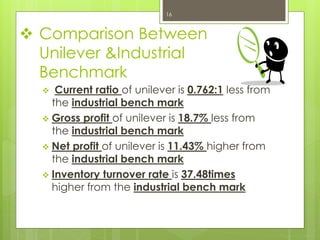
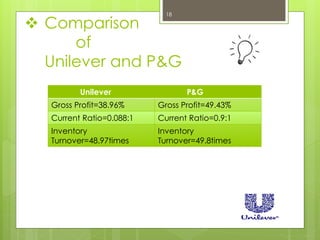
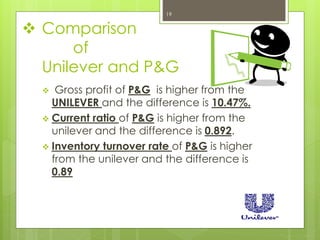
Presented To
Sir Waseem Subhani
Presented By
Muhammad Salman khan
Roll# 2011-bba-023
Financial
Analysis
of
Unilever (2011)
1
History:
 UPL was established some fifty years ago
in the newly created Pakistan. The town of
Rahim Yar Khan was the site chosen for
setting up a vegetable oil factory in 1958
and that is where the first UPL
manufacturing facility developed.
2
 Profibility Ratio
It’s a measure of the profitability of the company’s
product.
Gross profit ratio of the company has increased by
0.98% as compared to the year 2010
Gross profit ratio
Gross profit/Net sale *100
2010 2011
=1534884/4040887*100
=37.98%
=1924749/4940251*100
=38.96%
3
IN 2011 gross
profit of Our
company has
Increased
4
0.39
0.38
0.37
0.39
0.37
0.38
0.36 0.365 0.37 0.375 0.38 0.385 0.39 0.395
2011
2010
2009
2008
2007
2006
Gross Profit
Highest
Gross
Profit
rate
5
 Net Profit Ratio
Net Profit of the company has Increased by
1.66% as compared to the year 2010
In 2010 the net profit ratio is 10.82%
In 2011 the net profit ratio is 12.48%
Net Profit/Net Sales*100
2010 2011
=437463/4040887*100
=10.82%
=616695/4940251*100
=12.48%
6
9.69
9.45
11.31
5.24
11
12.48
2006 2007 2008 2009 2010 2011
Net Profit
7
 Short Term Liquidity Ratio:
Current ratio has decreased by 1.20times
(In 2010 the company has 1.0895 assets to
pay the liability of ‘1’ and in 2011 the
company has 0.0884 assets to pay the
liability of ‘1’)
Current Ratio:
Current Assets/Current liability
2010 2011
=704825/646896
=1.0895:1
=1036314/1171104
=0.0884:1
8
Debt ratio has increased by 9.38%as
compared to 2010
In 2010 the debt ratio is 62.8%
In 2011 the debt ratio is 72.8%
 Long Term Solvency Position:
Debt Ratio:
Total Liabilities/Total Assets*100
2010 2011
=685078/1089473
=62.8%
=1275633/1767168
=72.18%
9
58
60
62
64
66
68
70
72
74
2011 2010
Debt Ratio
Debt Ratio
10
Interest coverage ratio has increased by
21.91times as compared to the year 2010
 Interest Coverage Ratio:
Operating Income/Annual Interest Expense
2010 2011
=23576/9166
=2.5721times
=82582/3372
=24.49times
11
Inventory turnover ratio is increased by
8.28times as compare to the year 2010.
 Activities Ratio:
Inventory Turnover Ratio
CGS/ Average Inventory
2010 2011
=2506003/61576
=40.69times
=3015502/61576
=48.97times
12
 Inventory Turnover Ratio
2010 2011
40.69
48.97
13
Industrial Benchmark
The standards maintained by the U.S
economy for a certain company is
called “INDUSTRIAL BENCHMARK”
14
Comparison Between
Unilever &Industrial Benchmark
http://www.bizstats.com
Unilever Industrial benchmark
Current Ratio=0.088:1 Current Ratio=0.85:1
Gross Profit=38.96% Gross Profit=57.66%
Net Profit=12.48% Net Profit=1.05%
Inventory Turnover
=48.97times
Inventory Turnover
=11.49times
15
 Comparison Between
Unilever &Industrial
Benchmark
 Current ratio of unilever is 0.762:1 less from
the industrial bench mark
 Gross profit of unilever is 18.7% less from
the industrial bench mark
 Net profit of unilever is 11.43% higher from
the industrial bench mark
 Inventory turnover rate is 37.48times
higher from the industrial bench mark
16
 Comparison
of
Unilever and P&G
17
 Comparison
of
Unilever and P&G
Unilever P&G
Gross Profit=38.96% Gross Profit=49.43%
Current Ratio=0.088:1 Current Ratio=0.9:1
Inventory
Turnover=48.97times
Inventory
Turnover=49.8times
18
 Comparison
of
Unilever and P&G
 Gross profit of P&G is higher from the
UNILEVER and the difference is 10.47%.
 Current ratio of P&G is higher from the
unilever and the difference is 0.892.
 Inventory turnover rate of P&G is higher
from the unilever and the difference is
0.89
19
..??
20

Uniliver

  • 1.
    Presented To Sir WaseemSubhani Presented By Muhammad Salman khan Roll# 2011-bba-023 Financial Analysis of Unilever (2011) 1
  • 2.
    History:  UPL wasestablished some fifty years ago in the newly created Pakistan. The town of Rahim Yar Khan was the site chosen for setting up a vegetable oil factory in 1958 and that is where the first UPL manufacturing facility developed. 2
  • 3.
     Profibility Ratio It’sa measure of the profitability of the company’s product. Gross profit ratio of the company has increased by 0.98% as compared to the year 2010 Gross profit ratio Gross profit/Net sale *100 2010 2011 =1534884/4040887*100 =37.98% =1924749/4940251*100 =38.96% 3
  • 4.
    IN 2011 gross profitof Our company has Increased 4
  • 5.
    0.39 0.38 0.37 0.39 0.37 0.38 0.36 0.365 0.370.375 0.38 0.385 0.39 0.395 2011 2010 2009 2008 2007 2006 Gross Profit Highest Gross Profit rate 5
  • 6.
     Net ProfitRatio Net Profit of the company has Increased by 1.66% as compared to the year 2010 In 2010 the net profit ratio is 10.82% In 2011 the net profit ratio is 12.48% Net Profit/Net Sales*100 2010 2011 =437463/4040887*100 =10.82% =616695/4940251*100 =12.48% 6
  • 7.
  • 8.
     Short TermLiquidity Ratio: Current ratio has decreased by 1.20times (In 2010 the company has 1.0895 assets to pay the liability of ‘1’ and in 2011 the company has 0.0884 assets to pay the liability of ‘1’) Current Ratio: Current Assets/Current liability 2010 2011 =704825/646896 =1.0895:1 =1036314/1171104 =0.0884:1 8
  • 9.
    Debt ratio hasincreased by 9.38%as compared to 2010 In 2010 the debt ratio is 62.8% In 2011 the debt ratio is 72.8%  Long Term Solvency Position: Debt Ratio: Total Liabilities/Total Assets*100 2010 2011 =685078/1089473 =62.8% =1275633/1767168 =72.18% 9
  • 10.
  • 11.
    Interest coverage ratiohas increased by 21.91times as compared to the year 2010  Interest Coverage Ratio: Operating Income/Annual Interest Expense 2010 2011 =23576/9166 =2.5721times =82582/3372 =24.49times 11
  • 12.
    Inventory turnover ratiois increased by 8.28times as compare to the year 2010.  Activities Ratio: Inventory Turnover Ratio CGS/ Average Inventory 2010 2011 =2506003/61576 =40.69times =3015502/61576 =48.97times 12
  • 13.
     Inventory TurnoverRatio 2010 2011 40.69 48.97 13
  • 14.
    Industrial Benchmark The standardsmaintained by the U.S economy for a certain company is called “INDUSTRIAL BENCHMARK” 14
  • 15.
    Comparison Between Unilever &IndustrialBenchmark http://www.bizstats.com Unilever Industrial benchmark Current Ratio=0.088:1 Current Ratio=0.85:1 Gross Profit=38.96% Gross Profit=57.66% Net Profit=12.48% Net Profit=1.05% Inventory Turnover =48.97times Inventory Turnover =11.49times 15
  • 16.
     Comparison Between Unilever&Industrial Benchmark  Current ratio of unilever is 0.762:1 less from the industrial bench mark  Gross profit of unilever is 18.7% less from the industrial bench mark  Net profit of unilever is 11.43% higher from the industrial bench mark  Inventory turnover rate is 37.48times higher from the industrial bench mark 16
  • 17.
  • 18.
     Comparison of Unilever andP&G Unilever P&G Gross Profit=38.96% Gross Profit=49.43% Current Ratio=0.088:1 Current Ratio=0.9:1 Inventory Turnover=48.97times Inventory Turnover=49.8times 18
  • 19.
     Comparison of Unilever andP&G  Gross profit of P&G is higher from the UNILEVER and the difference is 10.47%.  Current ratio of P&G is higher from the unilever and the difference is 0.892.  Inventory turnover rate of P&G is higher from the unilever and the difference is 0.89 19
  • 20.