Downloaded 294 times


![Determination of organic richness
Tissot and Welte
(1984)
TOC is not
measured directly,
but can be
calculated via the
formula below:
%TOC =
[0.082(S1 + S2) +
S4]/10](https://image.slidesharecdn.com/understandingsourcerocks-151128141315-lva1-app6891/85/Understanding-source-rocks-8-320.jpg)


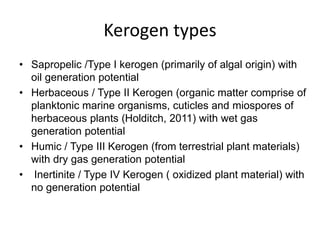


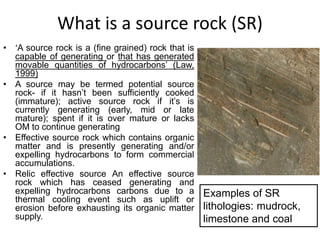
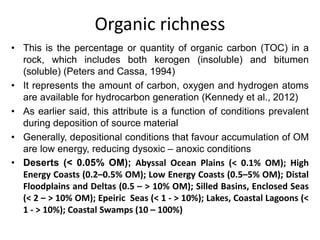
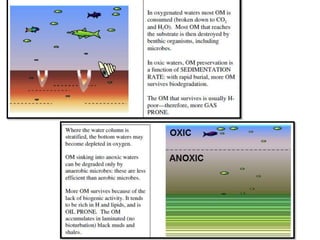
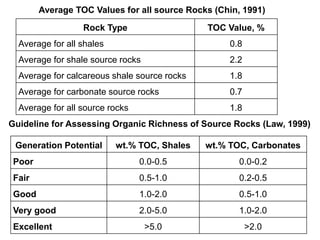
This document discusses the key attributes of source rocks: organic richness, kerogen type, and thermal maturity. Organic richness and kerogen type are determined by depositional environment, while thermal maturity depends on tectonic history. Source rocks must contain sufficient organic carbon (>0.5-1% TOC) and be thermally mature to generate hydrocarbons. Kerogen types I-III generate oil, wet gas, and dry gas respectively. Thermal maturity is assessed using indices like Tmax, S1/S2, and spore color. The samples discussed are immature based on their thermal maturity parameters.


