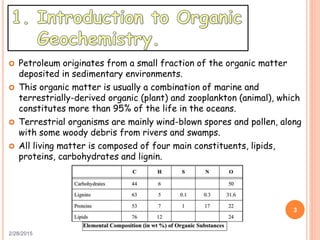
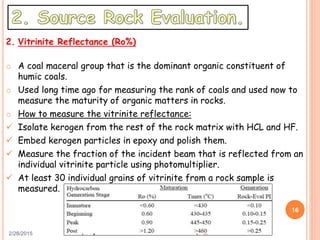
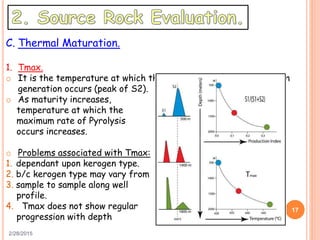
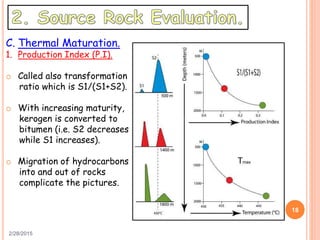
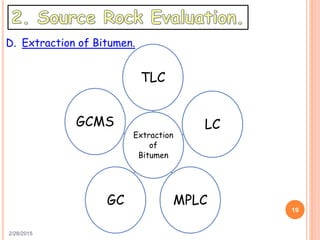
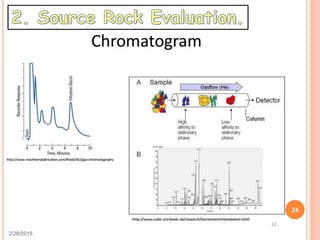
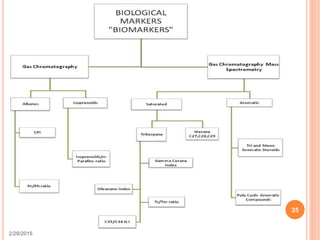
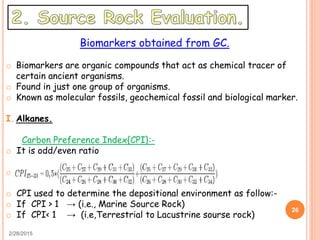
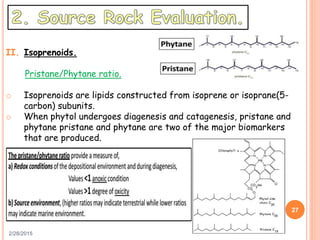
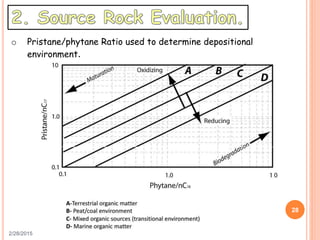
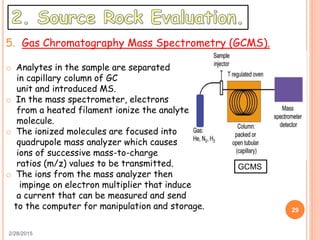
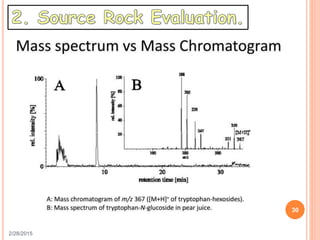
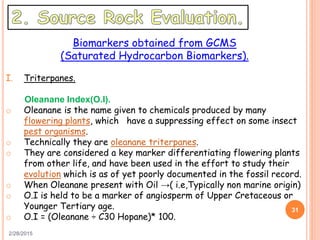
ORGANIC GEOCHEMISTRY IN OIL
EXPLORATION
Kareem Bakr, Well Site Geologist, Gupco.
1
OUTLINES:
1. Introduction to Organic Geochemistry.
2. Source Rock Evaluation:-
A. Quantity of organic matter.
B. Quality of organic matter.
C. Thermal Maturation.
D. Extraction of bitumen.
3. References.
2/28/2015
2
 Petroleum originates from a small fraction of the organic matter
deposited in sedimentary environments.
 This organic matter is usually a combination of marine and
terrestrially-derived organic (plant) and zooplankton (animal), which
constitutes more than 95% of the life in the oceans.
 Terrestrial organisms are mainly wind-blown spores and pollen, along
with some woody debris from rivers and swamps.
 All living matter is composed of four main constituents, lipids,
proteins, carbohydrates and lignin.
2/28/2015
3
 The optimum requirements for accumulation and preservation of
organic matter include:
a. A large supply of organic matter.
b. An intermediate rate of sedimentation of fine-grained material.
c. An oxygen-poor environment to reduce oxidation and aerobic
microbial degradation of dead organic matter.
 Lagoons, estuaries, deep basins within the continental margins have
both organic contributions, sedimentation and a reasonable
anaerobic environment required for organic matter accumulation.
 Kerogen is a general term describing any insoluble organic matter in
sedimentary rocks and best described as a heterogeneous, highly
polymerized organic material.
 Bitumen is the soluble fraction of the organic matter.
2/28/2015
4
2/28/2015
5
 Formation of oil and gas:-
 The process of petroleum generation is divided into three stages;
diagenesis, catagenesis and metagenesis.
A. Diagenesis (Ro 0.5% and Tmax 410⁰C to 420⁰C) .
 The first stage in the transformation of freshly deposited organic
matter into petroleum is called diagenesis.
 This process begins at the sedimentary interface and extends to
varying depths, but usually no deeper than a few hundred meters.
 During early diagenesis, one of the main agents of transformation is
microbial activity.
 During diagenesis, biological polymers (lipids-proteins,--) become
geopolymers then humin then finally kerogen with increasing T, P,
Overburden.
 Diagenesis causes a decreasing O/C, with only a slight decrease
in H/C.
2/28/2015
6
B. Catagenesis (Ro 2% and T max 480⁰C to 490⁰C).
 Catagenesis is the stage of thermal degradation of kerogen that
forms oil and gas.
 As a result of the temperature, kerogen is cracked to form liquid
petroleum and gas.
 Later stages of catagenesis results in the formation of methane
from kerogen.
 The end of catagenesis is generally accepted to be when all the
major sidechains of kerogen have been cracked.
C. Metagenesis (Ro 4% and T max > 510⁰C).
 Occur in areas of high geothermal gradients at shallower depths of
about 4000 m.
 Towards the end of metagenesis, no hydrocarbons are being
generated from the kerogen.
 The H/C ratio and hydrogen index decrease only slightly during
metagenesis.
2/28/2015
7
 Oil Window is the depth range
over which oil generation occurs.
 Source rock evaluation can done through:-
A. Quantity of organic matter (TOC%).
 TOC% is the main factor in determining the quantity of organic
matter in source rock.
 TOC indicates the richness of the organic matter in the rock which
includes both the insoluble organic matter (kerogen) and the soluble
organic matter (bitumen).
2/28/2015
8
 TOC analyses are usually run on a LECO carbon analyzer, which
simply combusts a sample of powdered, carbonate-free rock at very
high temperature in the presence of a large excess of oxygen.
 Mechanism of analysis:
1. ground the sample and remove carbonates by acid treatment.
2. combust the sample in the presence of excess oxygen in high
temperature.
3. All organic carbon will convert to CO2
4. The CO2 is trapped till full
combustion and then is released
to a detector.
 When the TOC in shale greater than 5% ,It is Excellent.
 When the TOC in Carbonate greater than 2% ,It is Excellent.
2/28/2015
9
B. Quality of organic matter.
 Quality of organic matter can obtained by:
1. Rock Eval Pyrolysis (direct method).
 Pyrolysis is the decomposition of organic matter by heating in the
absence of oxygen
 The Rock Eval instrument provides a fast determination of the type
and evolution stage of kerogen, together with a direct evaluation of
hydrocarbon source potential.
 The type and quality of kerogen are usually interpreted on a graph
derived from the traditional Van Krevelen Diagram, by replacing the
H/C and O/C ratios with the hydrogen index (HI) and the Oxygen
index (OI).
2/28/2015
10
 The maturation stage is usually obtained from T(max).
2/28/2015
11
Rock Eval Pyrolyser
Out put of Rock Eval Pyrolyser
 S1: is the amount of free hydrocarbons that can be easily flushed
out of the rock during the early part of Pyrolysis.
 S2: is thermal decomposition of kerogen.
 S3: is the quantity of O2 in kerogen.
 S2/S3: is an indicator of hydrogen richness in the kerogen.
 S2/TOC: is related directly to the potential of the rock to generate
 oil rather than gas. The higher the hydrogen richness of the
kerogen, the higher the potential to generate oil.
 T(max): This is the Pyrolysis temperature of the S2 peak which can
obtain the maturation state. It is a useful back-up to vitrinite
reflectance, particularly in the late immature to strongly mature
stage.
 Hydrogen Index: of sample used as indicator of oil vs. gas
proneness. HI = S2 (mg/g)/%TOC × 100
 Oxygen Index: Oxygen richness of sample used as indicator of the
kerogen type/degree of weathering.
OI = S3 (mg/g)/%TOC × 1002/28/2015
12
2/28/2015
13
Van Krevelen Diagram
 Type I
 This type of kerogen is characterized by having
a high initial hydrogen to carbon atomic ratio and
a low oxygen to carbon atomic ratio.
 Its primary source is from algal sediments.
 Called alginite kerogen (algal sediments, such as
 lacustrine deposits).
 Best source for oil-prone maturation.
 very rare.
 Type II
 This type of kerogen has a relatively high H/C ratio
and a low O/C ratio .
 Called exinite (marine sediments, where autochtho
-nous organic matter (bacteria, phytoplankton and
zooplankton) have been deposited.
 It is a good oil or gas prone kerogen.
 It is more common than alginite.
2/28/2015
14
Van Krevelen Diagram
 Type III
 This type of kerogen has a relatively low H/C ratio
and low O/C ratio.
 The main source of this type of kerogen are
continental plants found in thick detrital
sedimentation along continental margins.
 Called vitrinite kerogen.
 It is less favorable for oil generation, but will
provide a source rock for gas.
 Type IV
 Known as inertinite.
 This type of kerogen is usually associated with
coal or organic matter that has been greatly
oxidized.
2/28/2015
15
2/28/2015
16
2. Vitrinite Reflectance (Ro%)
o A coal maceral group that is the dominant organic constituent of
humic coals.
o Used long time ago for measuring the rank of coals and used now to
measure the maturity of organic matters in rocks.
o How to measure the vitrinite reflectance:
 Isolate kerogen from the rest of the rock matrix with HCL and HF.
 Embed kerogen particles in epoxy and polish them.
 Measure the fraction of the incident beam that is reflected from an
individual vitrinite particle using photomultiplier.
 At least 30 individual grains of vitrinite from a rock sample is
measured.
2/28/2015
17
C. Thermal Maturation.
1. Tmax.
o It is the temperature at which the maximum rate of hydrocarbon
generation occurs (peak of S2).
o As maturity increases,
temperature at which the
maximum rate of Pyrolysis
occurs increases.
o Problems associated with Tmax:
1. dependant upon kerogen type.
2. b/c kerogen type may vary from
3. sample to sample along well
profile.
4. Tmax does not show regular
progression with depth
2/28/2015
18
C. Thermal Maturation.
1. Production Index (P.I).
o Called also transformation
ratio which is S1/(S1+S2).
o With increasing maturity,
kerogen is converted to
bitumen (i.e. S2 decreases
while S1 increases).
o Migration of hydrocarbons
into and out of rocks
complicate the pictures.
2/28/2015
19
D. Extraction of Bitumen.
Extraction
of
Bitumen
TLC
LC
MPLCGC
GCMS
2/28/2015
20
D. Extraction of Bitumen.
o Soluble organic matter (Bitumen fraction) Isolated from the finely
powdered rocks by organic solvents (e.g. dichloromethane).
o The separated Bitumen fraction consists of mixtures of different
classes of organic compounds.
o We will go through many techniques for further extraction of
bitumen and biomarkers as follow:
1. Thin Layer Chromatography (TLC).
2/28/2015
21
o Thin layer of absorbent (stationary phase) on a flat solid support.
o Sample dissolved in a solvent (mobile phase), applied to the
lower edge and therefore, migrate upwards by capillary action.
o Separation theory, Solutes partitioned differentially between the
stationary and mobile phases
2. Liquid Chromatography (LC).
2/28/2015
22
3.Medium Pressure Liquid Chromatograph (MPLC).
o (MPLC) is a quantitative method of
analysis used to separate sample into
saturated hydrocarbons, aromatic
hydrocarbons and polar materials.
o It utilizes a pre-column containing
thermally-deactivated silica and
a main column of activated silica as
the stationary phase (SP) with
n-hexane serving as the mobile phase
(MP).
o Used for separation of saturates, aromatics, NSO and asphaltine.
2/28/2015
23
4. Gas Chromatography (GC).
o After obtaining the less
complex fractions, we use GC.
o Separation using GC depends
on the partitioning of analyte
between the gaseous mobile
phase and the liquid stationary
phase.
o Steps:
1. Solution of the sample introduces by syringe into injector.
2. Mobile phase (Carrier gas) sweeps the sample into capillary column
in an oven where analytes are separated.
3. On elution from the column analyte passes into a detector where
signals is generated, amplified and converted onto digital signal
stored by computer.
2/28/2015
24
2/28/2015
25
Biomarkers
2/28/2015
26
Biomarkers obtained from GC.
o Biomarkers are organic compounds that act as chemical tracer of
certain ancient organisms.
o Found in just one group of organisms.
o Known as molecular fossils, geochemical fossil and biological marker.
I. Alkanes.
Carbon Preference Index{CPI}:-
o It is odd/even ratio
o
o CPI used to determine the depositional environment as follow:-
o If CPI > 1 → (i.e., Marine Source Rock)
o If CPI< 1 → (i.e,Terrestrial to Lacustrine sourse rock)
2/28/2015
27
II. Isoprenoids.
Pristane/Phytane ratio.
o Isoprenoids are lipids constructed from isoprene or isoprane(5-
carbon) subunits.
o When phytol undergoes diagenesis and catagenesis, pristane and
phytane pristane and phytane are two of the major biomarkers
that are produced.
2/28/2015
28
o Pristane/phytane Ratio used to determine depositional
environment.
2/28/2015
29
5. Gas Chromatography Mass Spectrometry (GCMS).
o Analytes in the sample are separated
in capillary column of GC
unit and introduced MS.
o In the mass spectrometer, electrons
from a heated filament ionize the analyte
molecule.
o The ionized molecules are focused into
quadrupole mass analyzer which causes
ions of successive mass-to-charge
ratios (m/z) values to be transmitted.
o The ions from the mass analyzer then
impinge on electron multiplier that induce
a current that can be measured and send
to the computer for manipulation and storage.
GCMS
2/28/2015
30
2/28/2015
31
Biomarkers obtained from GCMS
(Saturated Hydrocarbon Biomarkers).
I. Triterpanes.
Oleanane Index(O.I).
o Oleanane is the name given to chemicals produced by many
flowering plants, which have a suppressing effect on some insect
pest organisms.
o Technically they are oleanane triterpanes.
o They are considered a key marker differentiating flowering plants
from other life, and have been used in the effort to study their
evolution which is as of yet poorly documented in the fossil record.
o When Oleanane present with Oil →( i.e,Typically non marine origin)
o O.I is held to be a marker of angiosperm of Upper Cretaceous or
Younger Tertiary age.
o O.I = (Oleanane ÷ C30 Hopane)* 100.
2/28/2015
32
Gamma Cerane Index (G.I):-
o Gamma Cerane is high relative to C31hopanes in oils derived from
sources deposited under hyper saline depositional conditions.
o High values of G.I indicates stratified water column during sourse
deposition.
o If G.I > 30% in oil or sourse rock i.e, the environment is marine of
high salinity.
o G.I = (Gamma Cerane ÷ C30 Hopane)* 100.
Ts/Tm ratio:-
o Ts → 18α-22,29-30 trisnorhopane.
o Tm→ 17α-22,29,30 trisnorhopane.
o Ts/(Ts+Tm) appears to be sensitive to clay catalyzed reactions so,
oil from carbonate sourse rocks appears to have low Ts/(Ts+Tm)
ratios compared with those from shales.
o Bitumen from many hyper saline sourse rocks show high
Ts/(Ts+Tm)ratio.
2/28/2015
33
C35/C34 Homohopane ratio (H.I).
o Increasing this ratio indicates strongly reducing environment
“Marine evaporates and carbonates”
o Abundance of C35 Homohopane in oils is correlated with source
rock hydrogen index.
II. Sterane.
2/28/2015
34
o Higher plants contain
abundant C29.
o Abundant C27
in zooplanktons.
o Abundant C28
in phytoplankton.
o Triangle plot of C27, C28
, C29 sterols can aid in
differentiating,
• marine
• estuarine
• lacustrine
• terrestrial
o based on the
characteristic associations of contributing organisms.
Sterane Ternary Diagram
2/28/2015
35
o Geochemistry in petroleum exploration, Douglas W.Waples.
o http://www.oiltracers.com/services/explorationgeochemistry/oil-
biomarker-summary.aspx.
o Petroleum geology, Baker Hughes Inteq, 1999.
o Petroleum geochemistry and geology, John M. Hunt, 1995.
2/28/2015
36

Organic geochemistry

  • 1.
    ORGANIC GEOCHEMISTRY INOIL EXPLORATION Kareem Bakr, Well Site Geologist, Gupco. 1
  • 2.
    OUTLINES: 1. Introduction toOrganic Geochemistry. 2. Source Rock Evaluation:- A. Quantity of organic matter. B. Quality of organic matter. C. Thermal Maturation. D. Extraction of bitumen. 3. References. 2/28/2015 2
  • 3.
     Petroleum originatesfrom a small fraction of the organic matter deposited in sedimentary environments.  This organic matter is usually a combination of marine and terrestrially-derived organic (plant) and zooplankton (animal), which constitutes more than 95% of the life in the oceans.  Terrestrial organisms are mainly wind-blown spores and pollen, along with some woody debris from rivers and swamps.  All living matter is composed of four main constituents, lipids, proteins, carbohydrates and lignin. 2/28/2015 3
  • 4.
     The optimumrequirements for accumulation and preservation of organic matter include: a. A large supply of organic matter. b. An intermediate rate of sedimentation of fine-grained material. c. An oxygen-poor environment to reduce oxidation and aerobic microbial degradation of dead organic matter.  Lagoons, estuaries, deep basins within the continental margins have both organic contributions, sedimentation and a reasonable anaerobic environment required for organic matter accumulation.  Kerogen is a general term describing any insoluble organic matter in sedimentary rocks and best described as a heterogeneous, highly polymerized organic material.  Bitumen is the soluble fraction of the organic matter. 2/28/2015 4
  • 5.
    2/28/2015 5  Formation ofoil and gas:-  The process of petroleum generation is divided into three stages; diagenesis, catagenesis and metagenesis. A. Diagenesis (Ro 0.5% and Tmax 410⁰C to 420⁰C) .  The first stage in the transformation of freshly deposited organic matter into petroleum is called diagenesis.  This process begins at the sedimentary interface and extends to varying depths, but usually no deeper than a few hundred meters.  During early diagenesis, one of the main agents of transformation is microbial activity.  During diagenesis, biological polymers (lipids-proteins,--) become geopolymers then humin then finally kerogen with increasing T, P, Overburden.  Diagenesis causes a decreasing O/C, with only a slight decrease in H/C.
  • 6.
    2/28/2015 6 B. Catagenesis (Ro2% and T max 480⁰C to 490⁰C).  Catagenesis is the stage of thermal degradation of kerogen that forms oil and gas.  As a result of the temperature, kerogen is cracked to form liquid petroleum and gas.  Later stages of catagenesis results in the formation of methane from kerogen.  The end of catagenesis is generally accepted to be when all the major sidechains of kerogen have been cracked. C. Metagenesis (Ro 4% and T max > 510⁰C).  Occur in areas of high geothermal gradients at shallower depths of about 4000 m.  Towards the end of metagenesis, no hydrocarbons are being generated from the kerogen.  The H/C ratio and hydrogen index decrease only slightly during metagenesis.
  • 7.
    2/28/2015 7  Oil Windowis the depth range over which oil generation occurs.
  • 8.
     Source rockevaluation can done through:- A. Quantity of organic matter (TOC%).  TOC% is the main factor in determining the quantity of organic matter in source rock.  TOC indicates the richness of the organic matter in the rock which includes both the insoluble organic matter (kerogen) and the soluble organic matter (bitumen). 2/28/2015 8
  • 9.
     TOC analysesare usually run on a LECO carbon analyzer, which simply combusts a sample of powdered, carbonate-free rock at very high temperature in the presence of a large excess of oxygen.  Mechanism of analysis: 1. ground the sample and remove carbonates by acid treatment. 2. combust the sample in the presence of excess oxygen in high temperature. 3. All organic carbon will convert to CO2 4. The CO2 is trapped till full combustion and then is released to a detector.  When the TOC in shale greater than 5% ,It is Excellent.  When the TOC in Carbonate greater than 2% ,It is Excellent. 2/28/2015 9
  • 10.
    B. Quality oforganic matter.  Quality of organic matter can obtained by: 1. Rock Eval Pyrolysis (direct method).  Pyrolysis is the decomposition of organic matter by heating in the absence of oxygen  The Rock Eval instrument provides a fast determination of the type and evolution stage of kerogen, together with a direct evaluation of hydrocarbon source potential.  The type and quality of kerogen are usually interpreted on a graph derived from the traditional Van Krevelen Diagram, by replacing the H/C and O/C ratios with the hydrogen index (HI) and the Oxygen index (OI). 2/28/2015 10
  • 11.
     The maturationstage is usually obtained from T(max). 2/28/2015 11 Rock Eval Pyrolyser Out put of Rock Eval Pyrolyser
  • 12.
     S1: isthe amount of free hydrocarbons that can be easily flushed out of the rock during the early part of Pyrolysis.  S2: is thermal decomposition of kerogen.  S3: is the quantity of O2 in kerogen.  S2/S3: is an indicator of hydrogen richness in the kerogen.  S2/TOC: is related directly to the potential of the rock to generate  oil rather than gas. The higher the hydrogen richness of the kerogen, the higher the potential to generate oil.  T(max): This is the Pyrolysis temperature of the S2 peak which can obtain the maturation state. It is a useful back-up to vitrinite reflectance, particularly in the late immature to strongly mature stage.  Hydrogen Index: of sample used as indicator of oil vs. gas proneness. HI = S2 (mg/g)/%TOC × 100  Oxygen Index: Oxygen richness of sample used as indicator of the kerogen type/degree of weathering. OI = S3 (mg/g)/%TOC × 1002/28/2015 12
  • 13.
    2/28/2015 13 Van Krevelen Diagram Type I  This type of kerogen is characterized by having a high initial hydrogen to carbon atomic ratio and a low oxygen to carbon atomic ratio.  Its primary source is from algal sediments.  Called alginite kerogen (algal sediments, such as  lacustrine deposits).  Best source for oil-prone maturation.  very rare.  Type II  This type of kerogen has a relatively high H/C ratio and a low O/C ratio .  Called exinite (marine sediments, where autochtho -nous organic matter (bacteria, phytoplankton and zooplankton) have been deposited.  It is a good oil or gas prone kerogen.  It is more common than alginite.
  • 14.
    2/28/2015 14 Van Krevelen Diagram Type III  This type of kerogen has a relatively low H/C ratio and low O/C ratio.  The main source of this type of kerogen are continental plants found in thick detrital sedimentation along continental margins.  Called vitrinite kerogen.  It is less favorable for oil generation, but will provide a source rock for gas.  Type IV  Known as inertinite.  This type of kerogen is usually associated with coal or organic matter that has been greatly oxidized.
  • 15.
  • 16.
    2/28/2015 16 2. Vitrinite Reflectance(Ro%) o A coal maceral group that is the dominant organic constituent of humic coals. o Used long time ago for measuring the rank of coals and used now to measure the maturity of organic matters in rocks. o How to measure the vitrinite reflectance:  Isolate kerogen from the rest of the rock matrix with HCL and HF.  Embed kerogen particles in epoxy and polish them.  Measure the fraction of the incident beam that is reflected from an individual vitrinite particle using photomultiplier.  At least 30 individual grains of vitrinite from a rock sample is measured.
  • 17.
    2/28/2015 17 C. Thermal Maturation. 1.Tmax. o It is the temperature at which the maximum rate of hydrocarbon generation occurs (peak of S2). o As maturity increases, temperature at which the maximum rate of Pyrolysis occurs increases. o Problems associated with Tmax: 1. dependant upon kerogen type. 2. b/c kerogen type may vary from 3. sample to sample along well profile. 4. Tmax does not show regular progression with depth
  • 18.
    2/28/2015 18 C. Thermal Maturation. 1.Production Index (P.I). o Called also transformation ratio which is S1/(S1+S2). o With increasing maturity, kerogen is converted to bitumen (i.e. S2 decreases while S1 increases). o Migration of hydrocarbons into and out of rocks complicate the pictures.
  • 19.
    2/28/2015 19 D. Extraction ofBitumen. Extraction of Bitumen TLC LC MPLCGC GCMS
  • 20.
    2/28/2015 20 D. Extraction ofBitumen. o Soluble organic matter (Bitumen fraction) Isolated from the finely powdered rocks by organic solvents (e.g. dichloromethane). o The separated Bitumen fraction consists of mixtures of different classes of organic compounds. o We will go through many techniques for further extraction of bitumen and biomarkers as follow: 1. Thin Layer Chromatography (TLC).
  • 21.
    2/28/2015 21 o Thin layerof absorbent (stationary phase) on a flat solid support. o Sample dissolved in a solvent (mobile phase), applied to the lower edge and therefore, migrate upwards by capillary action. o Separation theory, Solutes partitioned differentially between the stationary and mobile phases 2. Liquid Chromatography (LC).
  • 22.
    2/28/2015 22 3.Medium Pressure LiquidChromatograph (MPLC). o (MPLC) is a quantitative method of analysis used to separate sample into saturated hydrocarbons, aromatic hydrocarbons and polar materials. o It utilizes a pre-column containing thermally-deactivated silica and a main column of activated silica as the stationary phase (SP) with n-hexane serving as the mobile phase (MP). o Used for separation of saturates, aromatics, NSO and asphaltine.
  • 23.
    2/28/2015 23 4. Gas Chromatography(GC). o After obtaining the less complex fractions, we use GC. o Separation using GC depends on the partitioning of analyte between the gaseous mobile phase and the liquid stationary phase. o Steps: 1. Solution of the sample introduces by syringe into injector. 2. Mobile phase (Carrier gas) sweeps the sample into capillary column in an oven where analytes are separated. 3. On elution from the column analyte passes into a detector where signals is generated, amplified and converted onto digital signal stored by computer.
  • 24.
  • 25.
  • 26.
    2/28/2015 26 Biomarkers obtained fromGC. o Biomarkers are organic compounds that act as chemical tracer of certain ancient organisms. o Found in just one group of organisms. o Known as molecular fossils, geochemical fossil and biological marker. I. Alkanes. Carbon Preference Index{CPI}:- o It is odd/even ratio o o CPI used to determine the depositional environment as follow:- o If CPI > 1 → (i.e., Marine Source Rock) o If CPI< 1 → (i.e,Terrestrial to Lacustrine sourse rock)
  • 27.
    2/28/2015 27 II. Isoprenoids. Pristane/Phytane ratio. oIsoprenoids are lipids constructed from isoprene or isoprane(5- carbon) subunits. o When phytol undergoes diagenesis and catagenesis, pristane and phytane pristane and phytane are two of the major biomarkers that are produced.
  • 28.
    2/28/2015 28 o Pristane/phytane Ratioused to determine depositional environment.
  • 29.
    2/28/2015 29 5. Gas ChromatographyMass Spectrometry (GCMS). o Analytes in the sample are separated in capillary column of GC unit and introduced MS. o In the mass spectrometer, electrons from a heated filament ionize the analyte molecule. o The ionized molecules are focused into quadrupole mass analyzer which causes ions of successive mass-to-charge ratios (m/z) values to be transmitted. o The ions from the mass analyzer then impinge on electron multiplier that induce a current that can be measured and send to the computer for manipulation and storage. GCMS
  • 30.
  • 31.
    2/28/2015 31 Biomarkers obtained fromGCMS (Saturated Hydrocarbon Biomarkers). I. Triterpanes. Oleanane Index(O.I). o Oleanane is the name given to chemicals produced by many flowering plants, which have a suppressing effect on some insect pest organisms. o Technically they are oleanane triterpanes. o They are considered a key marker differentiating flowering plants from other life, and have been used in the effort to study their evolution which is as of yet poorly documented in the fossil record. o When Oleanane present with Oil →( i.e,Typically non marine origin) o O.I is held to be a marker of angiosperm of Upper Cretaceous or Younger Tertiary age. o O.I = (Oleanane ÷ C30 Hopane)* 100.
  • 32.
    2/28/2015 32 Gamma Cerane Index(G.I):- o Gamma Cerane is high relative to C31hopanes in oils derived from sources deposited under hyper saline depositional conditions. o High values of G.I indicates stratified water column during sourse deposition. o If G.I > 30% in oil or sourse rock i.e, the environment is marine of high salinity. o G.I = (Gamma Cerane ÷ C30 Hopane)* 100. Ts/Tm ratio:- o Ts → 18α-22,29-30 trisnorhopane. o Tm→ 17α-22,29,30 trisnorhopane. o Ts/(Ts+Tm) appears to be sensitive to clay catalyzed reactions so, oil from carbonate sourse rocks appears to have low Ts/(Ts+Tm) ratios compared with those from shales. o Bitumen from many hyper saline sourse rocks show high Ts/(Ts+Tm)ratio.
  • 33.
    2/28/2015 33 C35/C34 Homohopane ratio(H.I). o Increasing this ratio indicates strongly reducing environment “Marine evaporates and carbonates” o Abundance of C35 Homohopane in oils is correlated with source rock hydrogen index. II. Sterane.
  • 34.
    2/28/2015 34 o Higher plantscontain abundant C29. o Abundant C27 in zooplanktons. o Abundant C28 in phytoplankton. o Triangle plot of C27, C28 , C29 sterols can aid in differentiating, • marine • estuarine • lacustrine • terrestrial o based on the characteristic associations of contributing organisms. Sterane Ternary Diagram
  • 35.
    2/28/2015 35 o Geochemistry inpetroleum exploration, Douglas W.Waples. o http://www.oiltracers.com/services/explorationgeochemistry/oil- biomarker-summary.aspx. o Petroleum geology, Baker Hughes Inteq, 1999. o Petroleum geochemistry and geology, John M. Hunt, 1995.
  • 36.