Download as PDF, PPTX

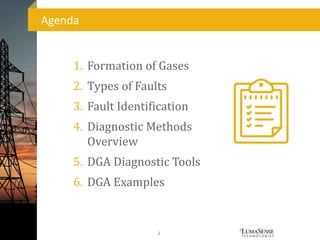
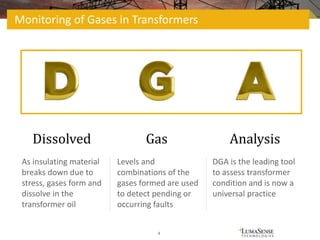
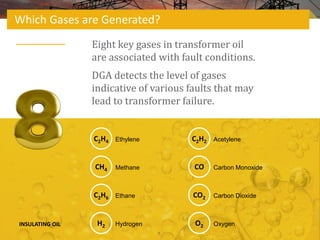
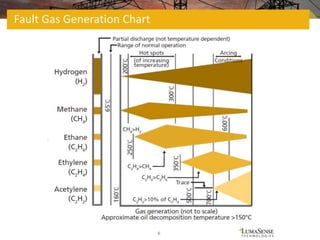
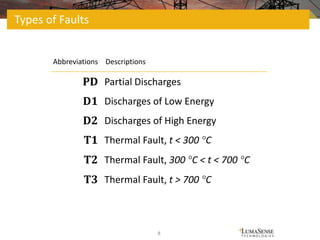
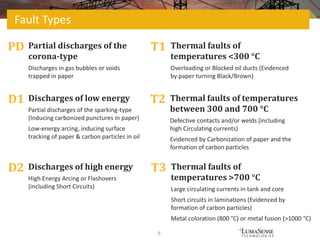
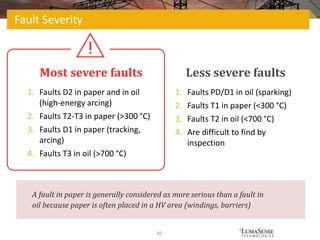
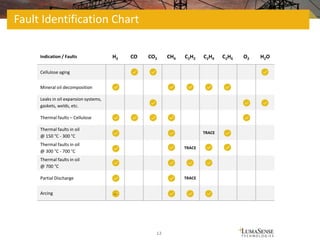
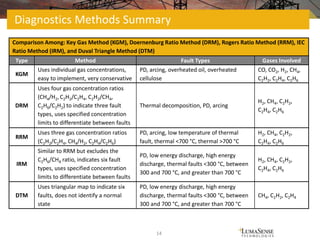
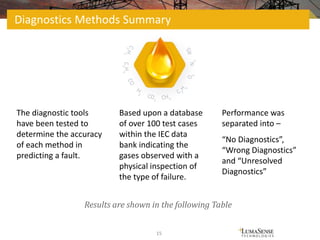
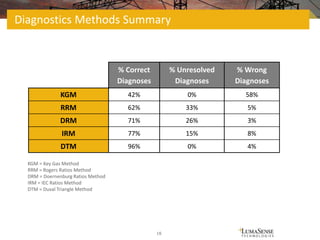

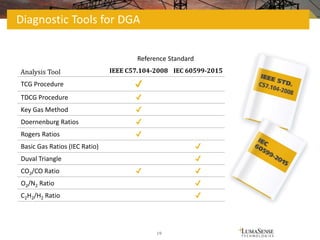
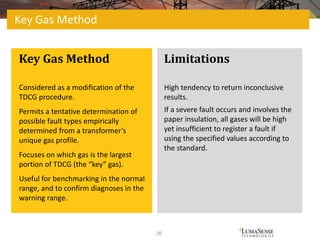
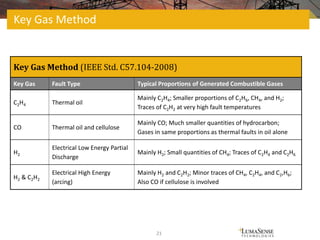
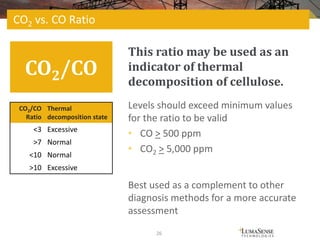
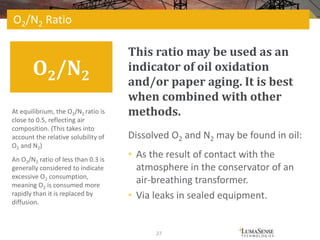
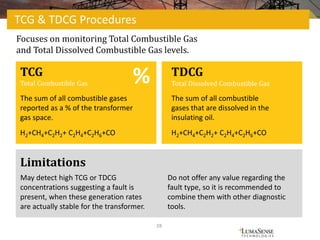
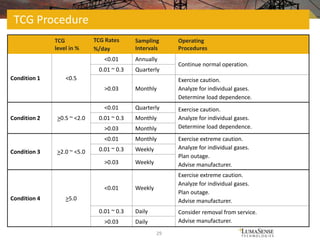


The document covers the formation of gases in transformers and the techniques used for dissolved gas analysis (DGA) to identify potential faults. It details various faults associated with differing gas types, diagnostic methods, and tools, including the Key Gas Method and Duval Triangle. Additionally, it evaluates the accuracy of different diagnostic methods and provides guidelines for interpreting gas levels in transformer oil to assess equipment condition.


