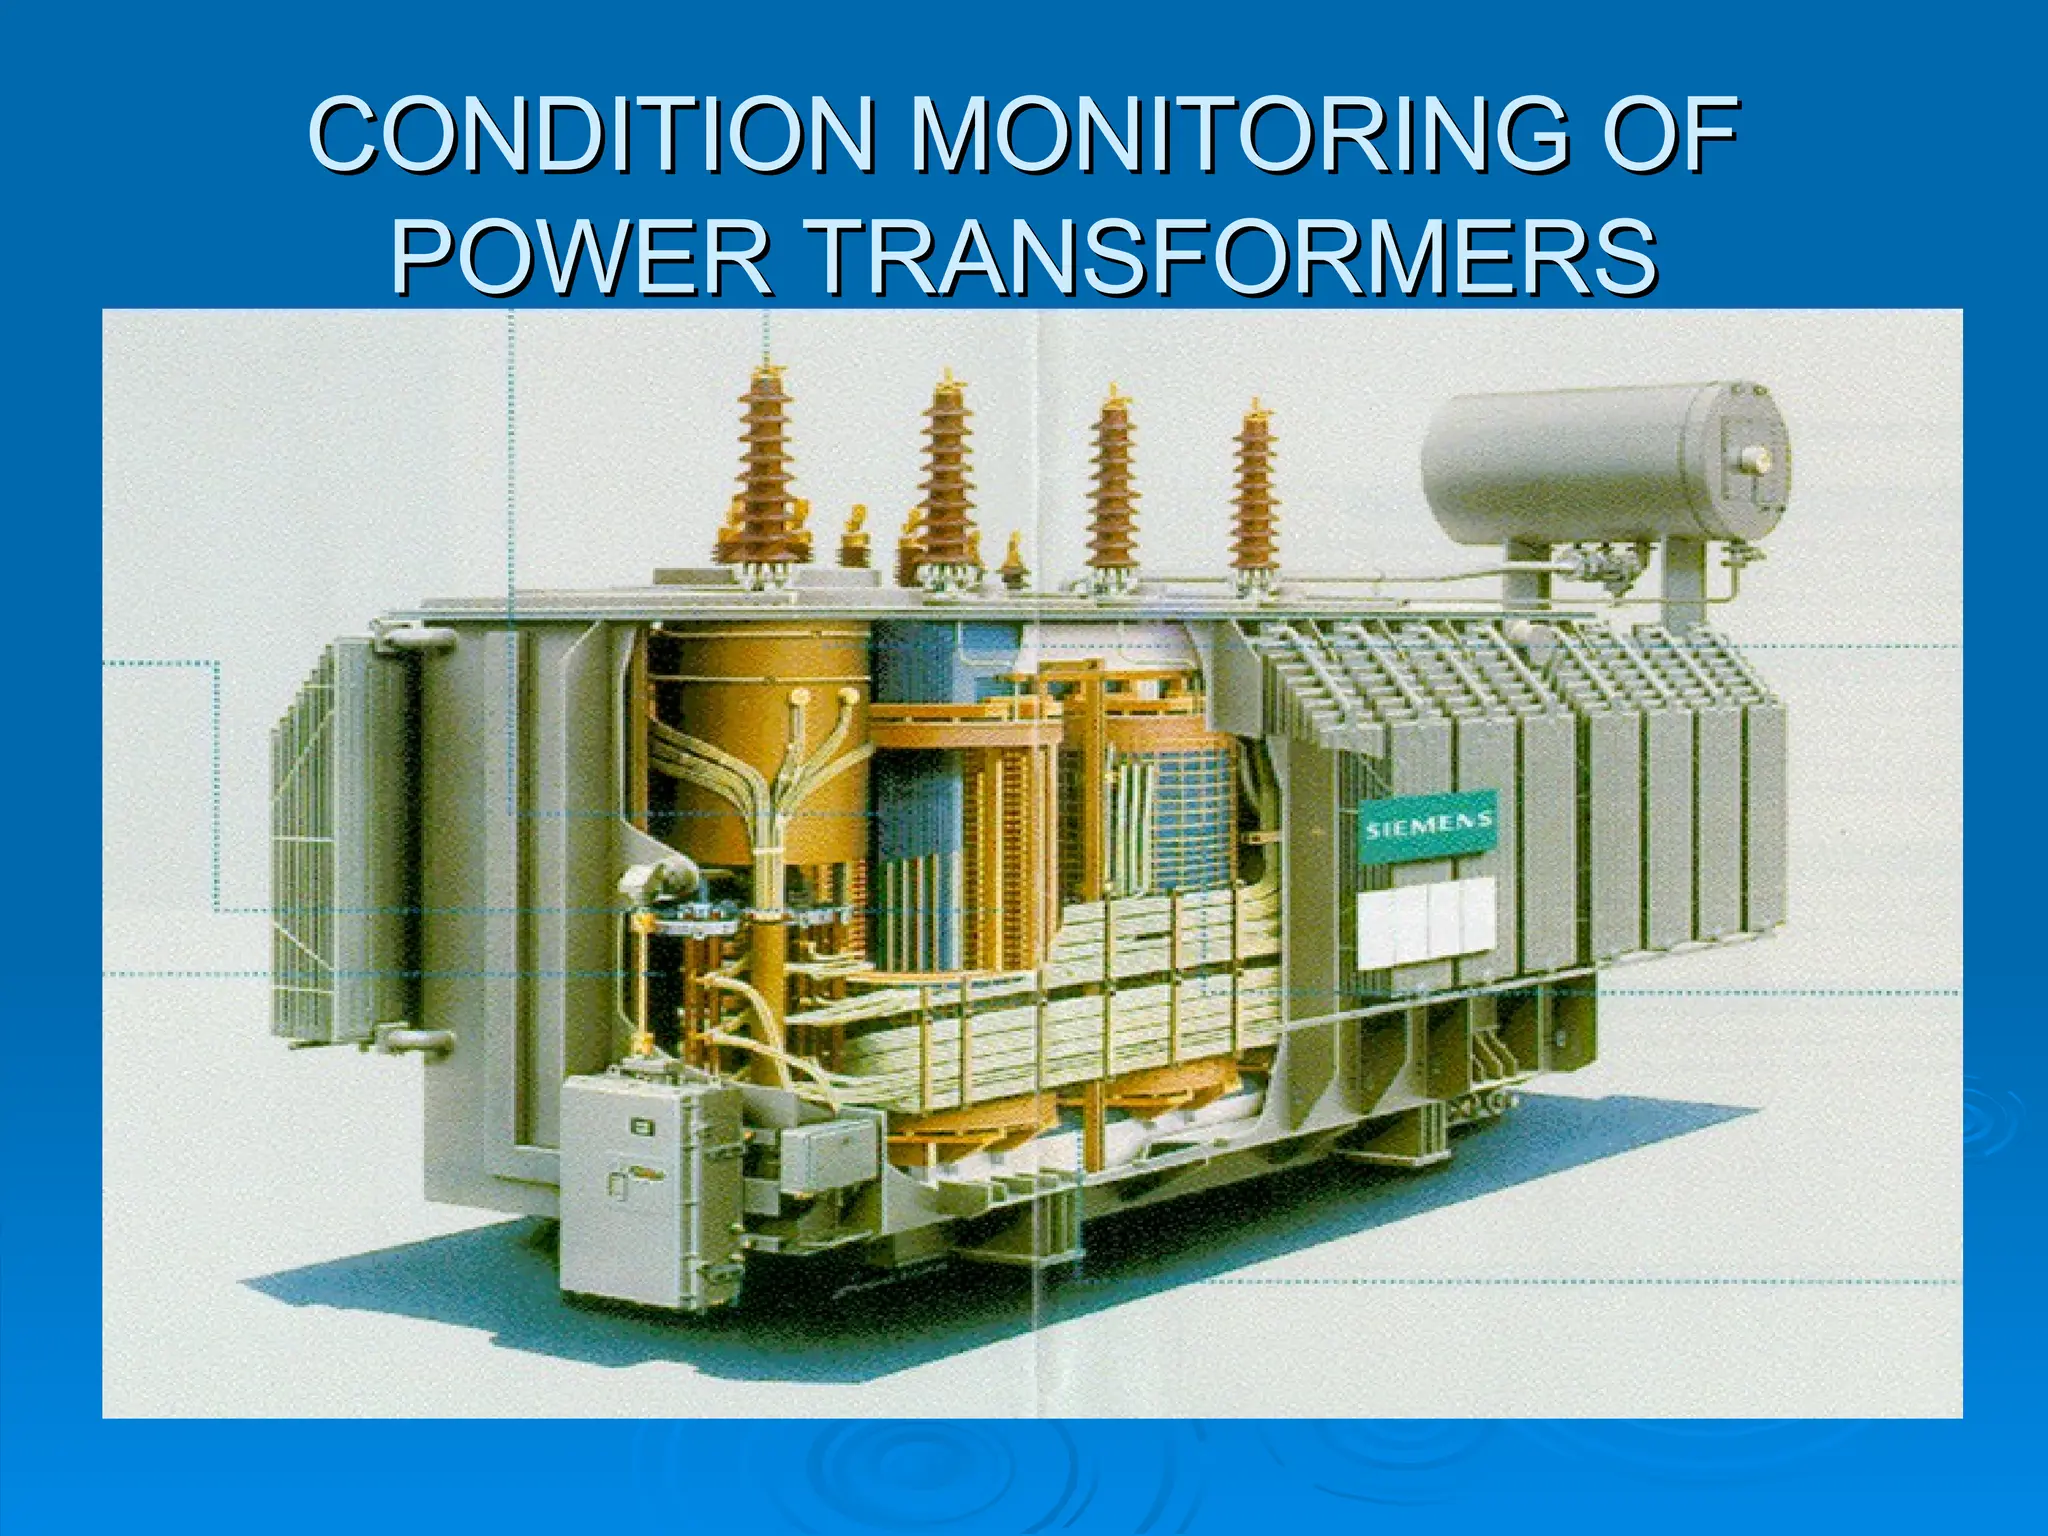
CONDITION MONITORING OF
CONDITIONMONITORING OF
POWER TRANSFORMERS
POWER TRANSFORMERS
Power Transformer is a complex and critical
Power Transformer is a complex and critical
component of Power Transmission and
component of Power Transmission and
Distribution System.
Distribution System.
System abnormalities, loading, switching and
System abnormalities, loading, switching and
ambient condition normally contribute towards
ambient condition normally contribute towards
accelerated aging and sudden failure.
accelerated aging and sudden failure.
Early fault detection by real time condition
Early fault detection by real time condition
assessment would be an important tool to
assessment would be an important tool to
minimize the sudden failures.
minimize the sudden failures.
4.
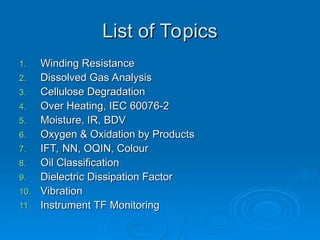
List of Topics
Listof Topics
1.
1. Winding Resistance
Winding Resistance
2.
2. Dissolved Gas Analysis
Dissolved Gas Analysis
3.
3. Cellulose Degradation
Cellulose Degradation
4.
4. Over Heating, IEC 60076-2
Over Heating, IEC 60076-2
5.
5. Moisture, IR, BDV
Moisture, IR, BDV
6.
6. Oxygen & Oxidation by Products
Oxygen & Oxidation by Products
7.
7. IFT, NN, OQIN, Colour
IFT, NN, OQIN, Colour
8.
8. Oil Classification
Oil Classification
9.
9. Dielectric Dissipation Factor
Dielectric Dissipation Factor
10.
10. Vibration
Vibration
11.
11. Instrument TF Monitoring
Instrument TF Monitoring
5.
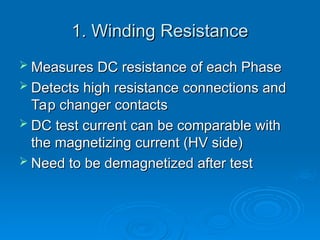
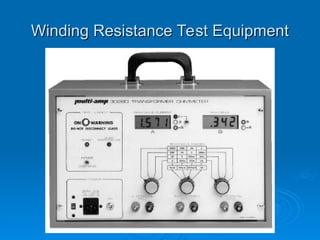
1. Winding Resistance
1.Winding Resistance
Measures DC resistance of each Phase
Measures DC resistance of each Phase
Detects high resistance connections and
Detects high resistance connections and
Tap changer contacts
Tap changer contacts
DC test current can be comparable with
DC test current can be comparable with
the magnetizing current (HV side)
the magnetizing current (HV side)
Need to be demagnetized after test
Need to be demagnetized after test
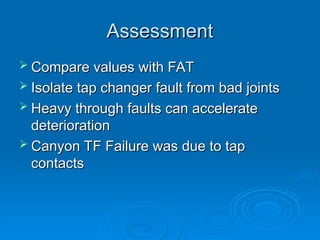
Assessment
Assessment
Compare valueswith FAT
Compare values with FAT
Isolate tap changer fault from bad joints
Isolate tap changer fault from bad joints
Heavy through faults can accelerate
Heavy through faults can accelerate
deterioration
deterioration
Canyon TF Failure was due to tap
Canyon TF Failure was due to tap
contacts
contacts
10.
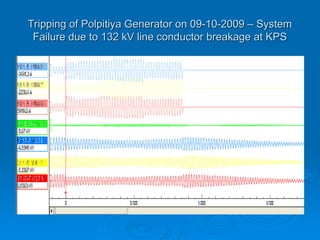
Tripping of PolpitiyaGenerator on 09-10-2009 – System
Tripping of Polpitiya Generator on 09-10-2009 – System
Failure due to 132 kV line conductor breakage at KPS
Failure due to 132 kV line conductor breakage at KPS
11.
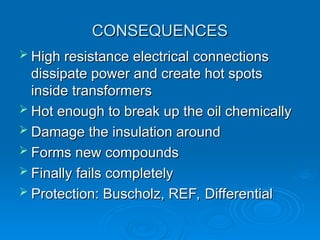
CONSEQUENCES
CONSEQUENCES
High resistanceelectrical connections
High resistance electrical connections
dissipate power and create hot spots
dissipate power and create hot spots
inside transformers
inside transformers
Hot enough to break up the oil chemically
Hot enough to break up the oil chemically
Damage the insulation around
Damage the insulation around
Forms new compounds
Forms new compounds
Finally fails completely
Finally fails completely
Protection: Buscholz, REF, Differential
Protection: Buscholz, REF, Differential
12.
2. DISSOLVED GASANALYSIS (DGA)
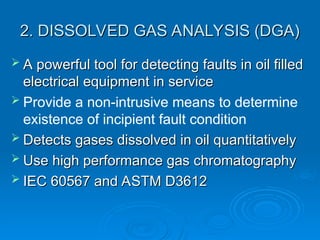
2. DISSOLVED GAS ANALYSIS (DGA)
A powerful tool for detecting faults in oil filled
A powerful tool for detecting faults in oil filled
electrical equipment in service
electrical equipment in service
Provide a non-intrusive means to determine
existence of incipient fault condition
Detects gases dissolved in oil quantitatively
Detects gases dissolved in oil quantitatively
Use high performance gas chromatography
Use high performance gas chromatography
IEC 60567 and ASTM D3612
IEC 60567 and ASTM D3612
13.
GAS FORMATION
GAS FORMATION
Due to de-composition of insulating
Due to de-composition of insulating
organic materials (oil & paper) as a result
organic materials (oil & paper) as a result
of internal faults
of internal faults
Chemical reactions in the equipment
Chemical reactions in the equipment
14.
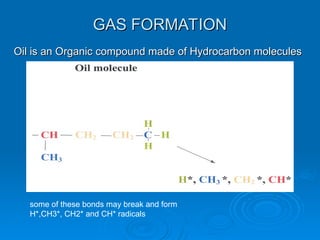
GAS FORMATION
GAS FORMATION
someof these bonds may break and form
H*,CH3*, CH2* and CH* radicals
Oil is an Organic compound made of Hydrocarbon molecules
Oil is an Organic compound made of Hydrocarbon molecules
15.
GAS
GAS FORMATION
FORMATION
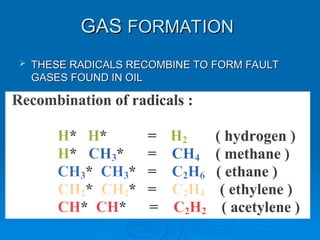
THESERADICALS RECOMBINE TO FORM FAULT
THESE RADICALS RECOMBINE TO FORM FAULT
GASES FOUND IN OIL
GASES FOUND IN OIL
16.
GAS FORMATION
GAS FORMATION
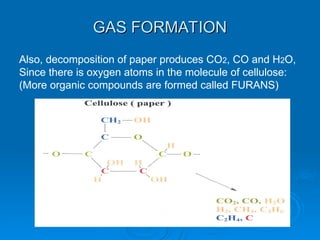
Also,decomposition of paper produces CO2, CO and H2O,
Since there is oxygen atoms in the molecule of cellulose:
(More organic compounds are formed called FURANS)
17.
GAS ANALYSIS
GAS ANALYSIS
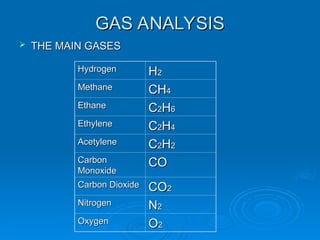
THE MAIN GASES
THE MAIN GASES
Hydrogen
Hydrogen H
H2
2
Methane
Methane CH
CH4
4
Ethane
Ethane C
C2
2H
H6
6
Ethylene
Ethylene C
C2
2H
H4
4
Acetylene
Acetylene C
C2
2H
H2
2
Carbon
Carbon
Monoxide
Monoxide
CO
CO
Carbon Dioxide
Carbon Dioxide CO
CO2
2
Nitrogen
Nitrogen N
N2
2
Oxygen
Oxygen O
O2
2
Gas Types
Gas Types
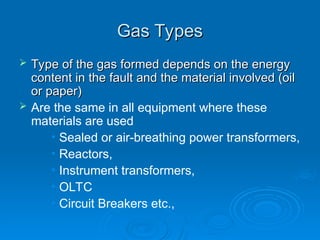
Type of the gas formed depends on the energy
Type of the gas formed depends on the energy
content in the fault and the material involved (oil
content in the fault and the material involved (oil
or paper)
or paper)
Are the same in all equipment where these
materials are used
• Sealed or air-breathing power transformers,
• Reactors,
• Instrument transformers,
• OLTC
• Circuit Breakers etc.,
20.
Characteristic Gas
Characteristic Gas
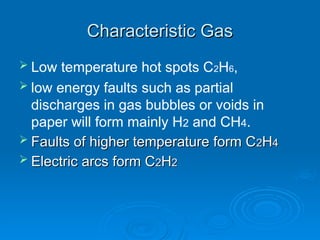
Low temperature hot spots C2H6,
low energy faults such as partial
discharges in gas bubbles or voids in
paper will form mainly H2 and CH4.
Faults of higher temperature form C
Faults of higher temperature form C2
2H
H4
4
Electric arcs form C
Electric arcs form C2
2H
H2
2
21.
INFORMATION
INFORMATION
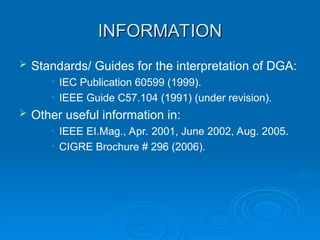
Standards/ Guidesfor the interpretation of DGA:
• IEC Publication 60599 (1999).
• IEEE Guide C57.104 (1991) (under revision).
Other useful information in:
• IEEE EI.Mag., Apr. 2001, June 2002, Aug. 2005.
• CIGRE Brochure # 296 (2006).
22.
FAULT TYPES
FAULT TYPES
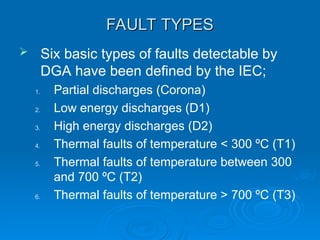
Six basic types of faults detectable by
DGA have been defined by the IEC;
1. Partial discharges (Corona)
2. Low energy discharges (D1)
3. High energy discharges (D2)
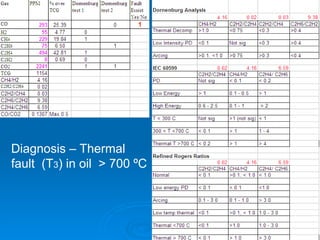
4. Thermal faults of temperature < 300 ºC (T1)
5. Thermal faults of temperature between 300
and 700 ºC (T2)
6. Thermal faults of temperature > 700 ºC (T3)
23.
FAULT TYPES
FAULT TYPES
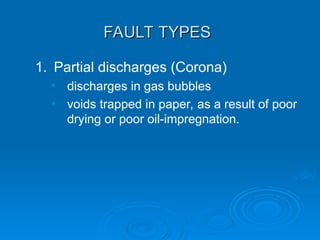
1.Partial discharges (Corona)
• discharges in gas bubbles
• voids trapped in paper, as a result of poor
drying or poor oil-impregnation.
24.
FAULT TYPES
FAULT TYPES
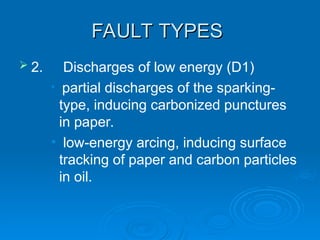
2. Discharges of low energy (D1)
• partial discharges of the sparking-
type, inducing carbonized punctures
in paper.
• low-energy arcing, inducing surface
tracking of paper and carbon particles
in oil.
25.
FAULT TYPES
FAULT TYPES
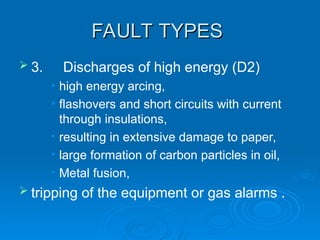
3. Discharges of high energy (D2)
• high energy arcing,
• flashovers and short circuits with current
through insulations,
• resulting in extensive damage to paper,
• large formation of carbon particles in oil,
• Metal fusion,
tripping of the equipment or gas alarms .
26.
FAULT TYPES
FAULT TYPES
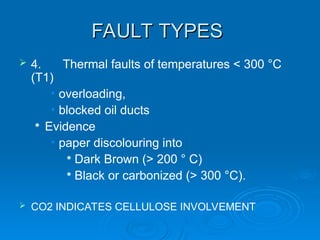
4. Thermal faults of temperatures < 300 °C
(T1)
• overloading,
• blocked oil ducts
Evidence
• paper discolouring into
Dark Brown (> 200 ° C)
Black or carbonized (> 300 °C).
CO2 INDICATES CELLULOSE INVOLVEMENT
27.
FAULT TYPES
FAULT TYPES
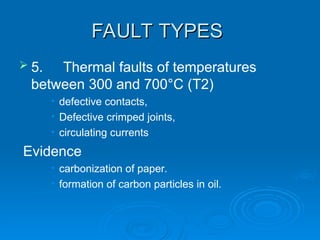
5. Thermal faults of temperatures
between 300 and 700°C (T2)
• defective contacts,
• Defective crimped joints,
• circulating currents
Evidence
• carbonization of paper.
• formation of carbon particles in oil.
28.
FAULT TYPES
FAULT TYPES
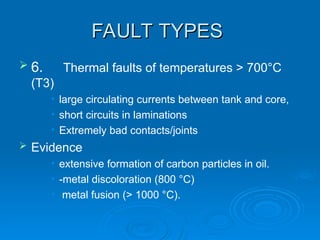
6. Thermal faults of temperatures > 700°C
(T3)
• large circulating currents between tank and core,
• short circuits in laminations
• Extremely bad contacts/joints
Evidence
• extensive formation of carbon particles in oil.
• -metal discoloration (800 °C)
• metal fusion (> 1000 °C).
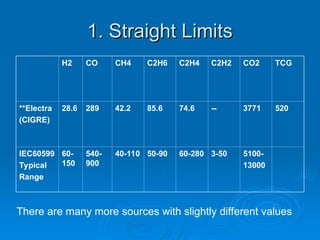
1. Straight Limits
1.Straight Limits
H2 CO CH4 C2H6 C2H4 C2H2 CO2 TCG
**Electra
(CIGRE)
28.6 289 42.2 85.6 74.6 -- 3771 520
IEC60599
Typical
Range
60-
150
540-
900
40-110 50-90 60-280 3-50 5100-
13000
There are many more sources with slightly different values
31.
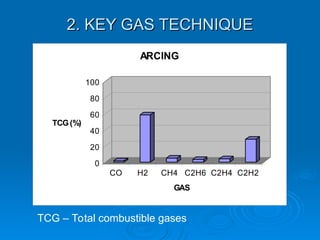
2. KEY GASTECHNIQUE
2. KEY GAS TECHNIQUE
0
20
40
60
80
100
TCG(%)
CO H2 CH4 C2H6 C2H4 C2H2
GAS
ARCING
TCG – Total combustible gases
32.
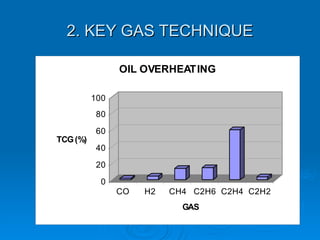
2. KEY GASTECHNIQUE
2. KEY GAS TECHNIQUE
0
20
40
60
80
100
TCG(%)
CO H2 CH4 C2H6 C2H4 C2H2
GAS
OIL OVERHEATING
33.
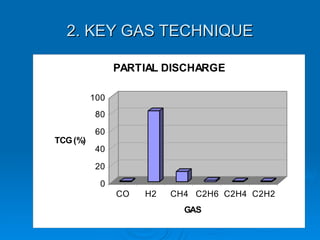
2. KEY GASTECHNIQUE
2. KEY GAS TECHNIQUE
0
20
40
60
80
100
TCG(%)
CO H2 CH4 C2H6 C2H4 C2H2
GAS
PARTIAL DISCHARGE
34.
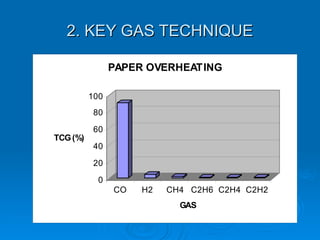
2. KEY GASTECHNIQUE
2. KEY GAS TECHNIQUE
0
20
40
60
80
100
TCG(%)
CO H2 CH4 C2H6 C2H4 C2H2
GAS
PAPER OVERHEATING
35.
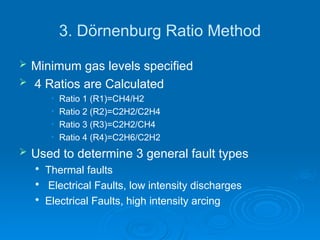
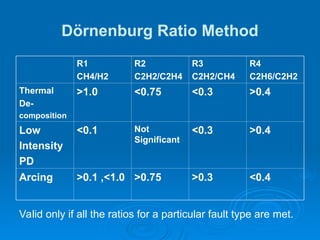
3. Dörnenburg RatioMethod
Minimum gas levels specified
4 Ratios are Calculated
• Ratio 1 (R1)=CH4/H2
• Ratio 2 (R2)=C2H2/C2H4
• Ratio 3 (R3)=C2H2/CH4
• Ratio 4 (R4)=C2H6/C2H2
Used to determine 3 general fault types
Thermal faults
Electrical Faults, low intensity discharges
Electrical Faults, high intensity arcing
36.
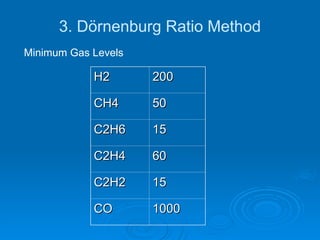
3. Dörnenburg RatioMethod
H2
H2 200
200
CH4
CH4 50
50
C2H6
C2H6 15
15
C2H4
C2H4 60
60
C2H2
C2H2 15
15
CO
CO 1000
1000
Minimum Gas Levels
37.
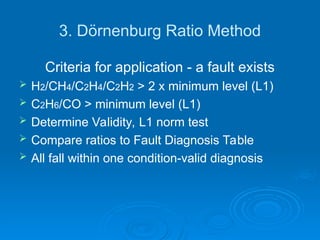
3. Dörnenburg RatioMethod
Criteria for application - a fault exists
H2/CH4/C2H4/C2H2 > 2 x minimum level (L1)
C2H6/CO > minimum level (L1)
Determine Validity, L1 norm test
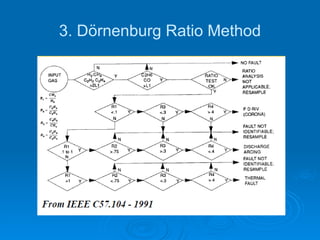
Compare ratios to Fault Diagnosis Table
All fall within one condition-valid diagnosis
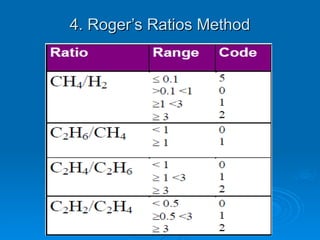
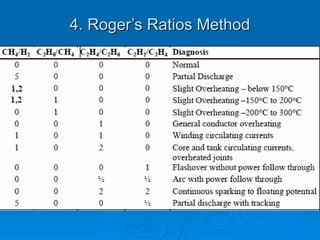
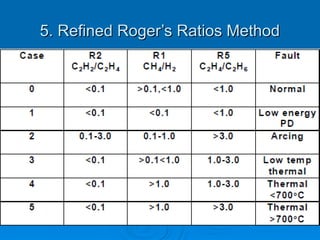
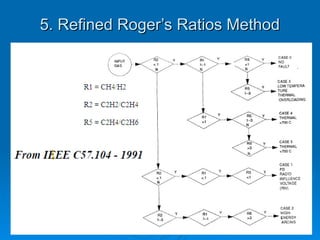
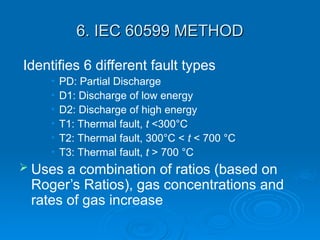
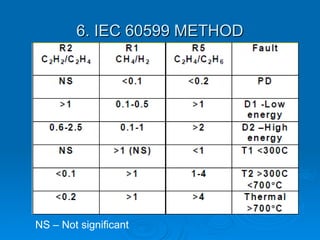
6. IEC 60599METHOD
6. IEC 60599 METHOD
Identifies 6 different fault types
• PD: Partial Discharge
• D1: Discharge of low energy
• D2: Discharge of high energy
• T1: Thermal fault, t <300°C
• T2: Thermal fault, 300°C < t < 700 °C
• T3: Thermal fault, t > 700 °C
Uses a combination of ratios (based on
Roger’s Ratios), gas concentrations and
rates of gas increase
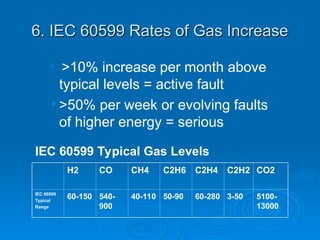
6. IEC 60599Rates of Gas Increase
6. IEC 60599 Rates of Gas Increase
• >10% increase per month above
typical levels = active fault
• >50% per week or evolving faults
of higher energy = serious
H2 CO CH4 C2H6 C2H4 C2H2 CO2
IEC 60599
Typical
Range
60-150 540-
900
40-110 50-90 60-280 3-50 5100-
13000
IEC 60599 Typical Gas Levels
48.
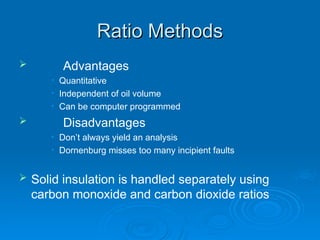
Ratio Methods
Ratio Methods
Advantages
• Quantitative
• Independent of oil volume
• Can be computer programmed
Disadvantages
• Don’t always yield an analysis
• Dornenburg misses too many incipient faults
Solid insulation is handled separately using
carbon monoxide and carbon dioxide ratios
49.
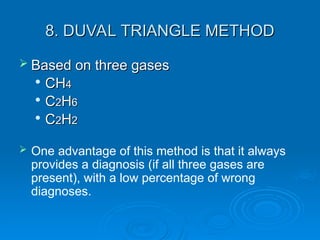
8. DUVAL TRIANGLEMETHOD
8. DUVAL TRIANGLE METHOD
Based on three gases
Based on three gases
CH
CH4
4
C
C2
2H
H6
6
C
C2
2H
H2
2
One advantage of this method is that it always
provides a diagnosis (if all three gases are
present), with a low percentage of wrong
diagnoses.
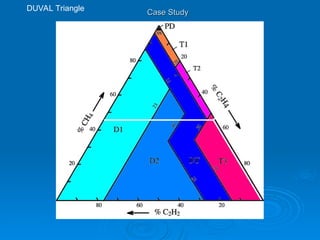
50.
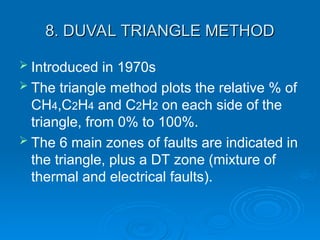
8. DUVAL TRIANGLEMETHOD
8. DUVAL TRIANGLE METHOD
Introduced in 1970s
The triangle method plots the relative % of
CH4,C2H4 and C2H2 on each side of the
triangle, from 0% to 100%.
The 6 main zones of faults are indicated in
the triangle, plus a DT zone (mixture of
thermal and electrical faults).
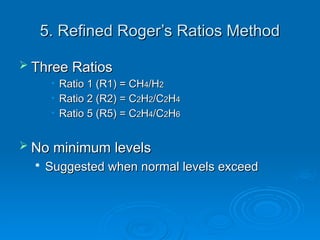
51.
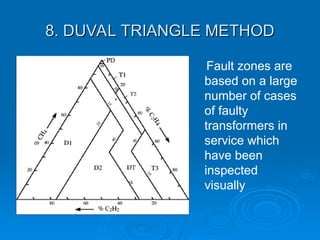
8. DUVAL TRIANGLEMETHOD
8. DUVAL TRIANGLE METHOD
Fault zones are
based on a large
number of cases
of faulty
transformers in
service which
have been
inspected
visually
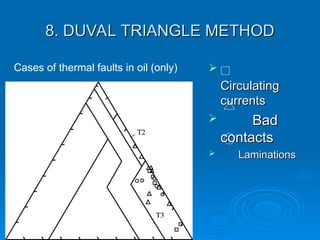
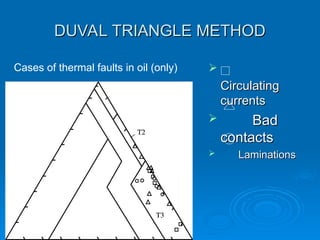
8. DUVAL TRIANGLEMETHOD
8. DUVAL TRIANGLE METHOD
Cases of thermal faults in oil (only)
Circulating
Circulating
currents
currents
Bad
Bad
contacts
contacts
Laminations
Laminations
55.
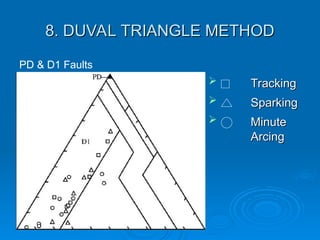
8. DUVAL TRIANGLEMETHOD
8. DUVAL TRIANGLE METHOD
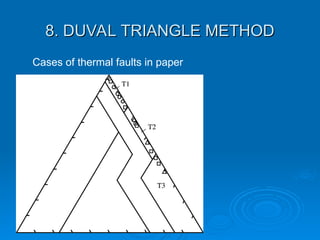
Cases of thermal faults in paper
56.
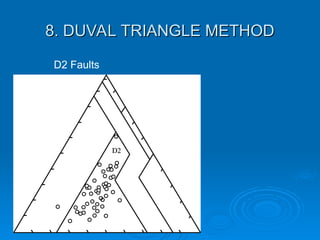
8. DUVAL TRIANGLEMETHOD
8. DUVAL TRIANGLE METHOD
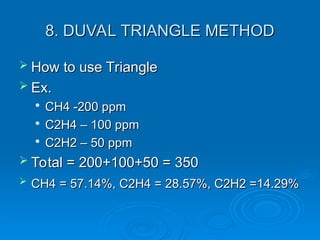
How to use Triangle
How to use Triangle
Ex.
Ex.
CH4 -200 ppm
CH4 -200 ppm
C2H4 – 100 ppm
C2H4 – 100 ppm
C2H2 – 50 ppm
C2H2 – 50 ppm
Total = 200+100+50 = 350
Total = 200+100+50 = 350
CH4 = 57.14%, C2H4 = 28.57%, C2H2 =14.29%
CH4 = 57.14%, C2H4 = 28.57%, C2H2 =14.29%
57.
8. DUVAL TRIANGLEMETHOD
8. DUVAL TRIANGLE METHOD
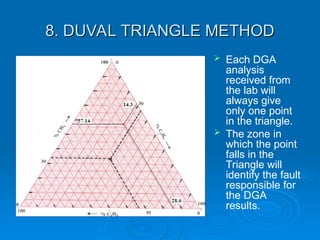
Each DGA
analysis
received from
the lab will
always give
only one point
in the triangle.
The zone in
which the point
falls in the
Triangle will
identify the fault
responsible for
the DGA
results.
59.
FAULT TYPES
FAULT TYPES
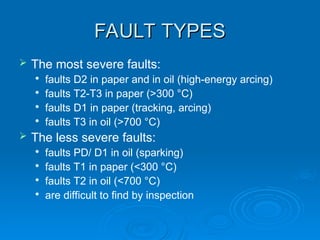
The most severe faults:
faults D2 in paper and in oil (high-energy arcing)
faults T2-T3 in paper (>300 °C)
faults D1 in paper (tracking, arcing)
faults T3 in oil (>700 °C)
The less severe faults:
faults PD/ D1 in oil (sparking)
faults T1 in paper (<300 °C)
faults T2 in oil (<700 °C)
are difficult to find by inspection
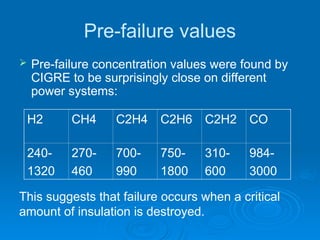
Pre-failure values
Pre-failureconcentration values were found by
CIGRE to be surprisingly close on different
power systems:
H2 CH4 C2H4 C2H6 C2H2 CO
240-
1320
270-
460
700-
990
750-
1800
310-
600
984-
3000
This suggests that failure occurs when a critical
amount of insulation is destroyed.
62.
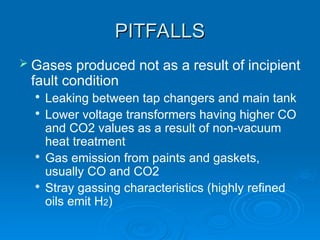
PITFALLS
PITFALLS
Gases producednot as a result of incipient
fault condition
Leaking between tap changers and main tank
Lower voltage transformers having higher CO
and CO2 values as a result of non-vacuum
heat treatment
Gas emission from paints and gaskets,
usually CO and CO2
Stray gassing characteristics (highly refined
oils emit H2)
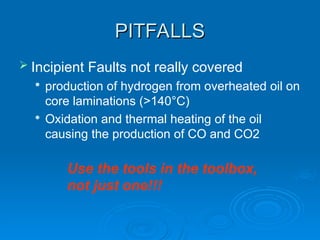
63.
PITFALLS
PITFALLS
Incipient Faultsnot really covered
production of hydrogen from overheated oil on
core laminations (>140°C)
Oxidation and thermal heating of the oil
causing the production of CO and CO2
Use the tools in the toolbox,
not just one!!!
64.
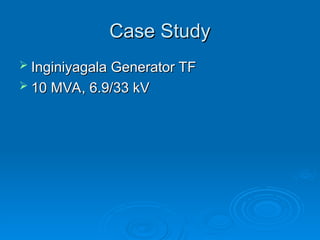
Case Study
Case Study
Inginiyagala Generator TF
Inginiyagala Generator TF
10 MVA, 6.9/33 kV
10 MVA, 6.9/33 kV
65.
Date of
Sampling H2CH4 C2H6 C2H4 C2H2 CO CO2 CO2/CO
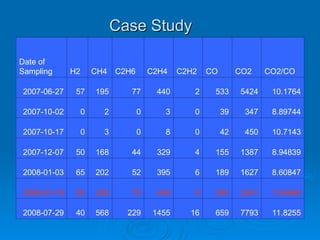
2007-06-27 57 195 77 440 2 533 5424 10.1764
2007-10-02 0 2 0 3 0 39 347 8.89744
2007-10-17 0 3 0 8 0 42 450 10.7143
2007-12-07 50 168 44 329 4 155 1387 8.94839
2008-01-03 65 202 52 395 6 189 1627 8.60847
2008-01-19 55 229 75 494 8 293 2241 7.64846
2008-07-29 40 568 229 1455 16 659 7793 11.8255
Case Study
Case Study
66.
Case Study -Straight Limits
Case Study - Straight Limits
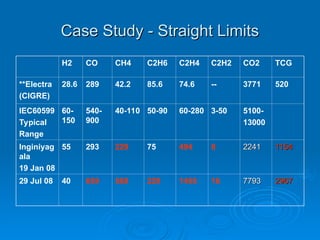
H2 CO CH4 C2H6 C2H4 C2H2 CO2 TCG
**Electra
(CIGRE)
28.6 289 42.2 85.6 74.6 -- 3771 520
IEC60599
Typical
Range
60-
150
540-
900
40-110 50-90 60-280 3-50 5100-
13000
Inginiyag
ala
19 Jan 08
55 293 229 75 494 8 2241
2241 1154
1154
29 Jul 08 40 659 568 229 1455 16 7793
7793 2967
2967
67.
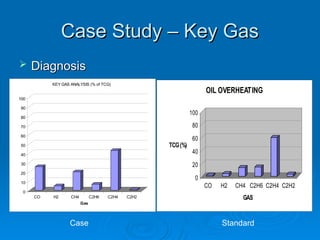
Case Study –Key Gas
Case Study – Key Gas
Diagnosis
Diagnosis
0
20
40
60
80
100
TCG(%)
CO H2 CH4 C2H6 C2H4 C2H2
GAS
OIL OVERHEATING
Case Standard
0
10
20
30
40
50
60
70
80
90
100
CO H2 CH4 C2H6 C2H4 C2H2
Gas
KEY GAS ANALYSIS (% of TCG)
DUVAL TRIANGLE METHOD
DUVALTRIANGLE METHOD
Cases of thermal faults in oil (only)
Circulating
Circulating
currents
currents
Bad
Bad
contacts
contacts
Laminations
Laminations
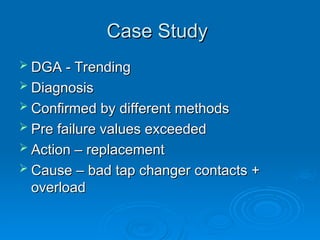
71.
Case Study
Case Study
DGA - Trending
DGA - Trending
Diagnosis
Diagnosis
Confirmed by different methods
Confirmed by different methods
Pre failure values exceeded
Pre failure values exceeded
Action – replacement
Action – replacement
Cause – bad tap changer contacts +
Cause – bad tap changer contacts +
overload
overload
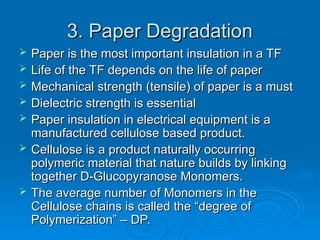
3. Paper Degradation
3.Paper Degradation
Paper is the most important insulation in a TF
Paper is the most important insulation in a TF
Life of the TF depends on the life of paper
Life of the TF depends on the life of paper
Mechanical strength (tensile) of paper is a must
Mechanical strength (tensile) of paper is a must
Dielectric strength is essential
Dielectric strength is essential
Paper insulation in electrical equipment is a
Paper insulation in electrical equipment is a
manufactured cellulose based product.
manufactured cellulose based product.
Cellulose is a product naturally occurring
Cellulose is a product naturally occurring
polymeric material that nature builds by linking
polymeric material that nature builds by linking
together D-Glucopyranose Monomers.
together D-Glucopyranose Monomers.
The average number of Monomers in the
The average number of Monomers in the
Cellulose chains is called the “degree of
Cellulose chains is called the “degree of
Polymerization” – DP.
Polymerization” – DP.
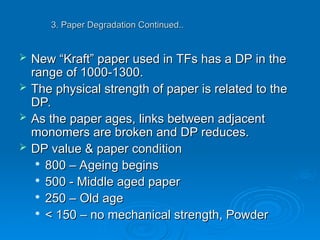
75.
New “Kraft”paper used in TFs has a DP in the
New “Kraft” paper used in TFs has a DP in the
range of 1000-1300.
range of 1000-1300.
The physical strength of paper is related to the
The physical strength of paper is related to the
DP.
DP.
As the paper ages, links between adjacent
As the paper ages, links between adjacent
monomers are broken and DP reduces.
monomers are broken and DP reduces.
DP value & paper condition
DP value & paper condition
800 – Ageing begins
800 – Ageing begins
500 - Middle aged paper
500 - Middle aged paper
250 – Old age
250 – Old age
< 150 – no mechanical strength, Powder
< 150 – no mechanical strength, Powder
3. Paper Degradation Continued..
3. Paper Degradation Continued..
76.
3. Paper DegradationContinued..
3. Paper Degradation Continued..
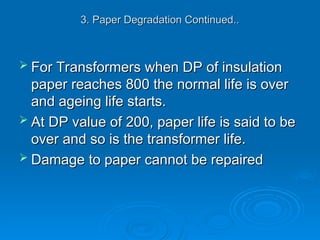
For Transformers when DP of insulation
For Transformers when DP of insulation
paper reaches 800 the normal life is over
paper reaches 800 the normal life is over
and ageing life starts.
and ageing life starts.
At DP value of 200, paper life is said to be
At DP value of 200, paper life is said to be
over and so is the transformer life.
over and so is the transformer life.
Damage to paper cannot be repaired
Damage to paper cannot be repaired
77.
3. Paper DegradationContinued..
3. Paper Degradation Continued..
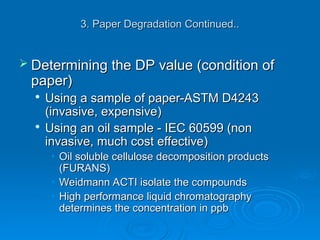
Determining the DP value (condition of
Determining the DP value (condition of
paper)
paper)
Using a sample of paper-ASTM D4243
Using a sample of paper-ASTM D4243
(invasive, expensive)
(invasive, expensive)
Using an oil sample - IEC 60599 (non
Using an oil sample - IEC 60599 (non
invasive, much cost effective)
invasive, much cost effective)
• Oil soluble cellulose decomposition products
Oil soluble cellulose decomposition products
(FURANS)
(FURANS)
• Weidmann ACTI isolate the compounds
Weidmann ACTI isolate the compounds
• High performance liquid chromatography
High performance liquid chromatography
determines the concentration in ppb
determines the concentration in ppb
3. Paper DegradationContinued..
3. Paper Degradation Continued..
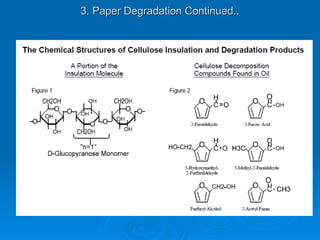
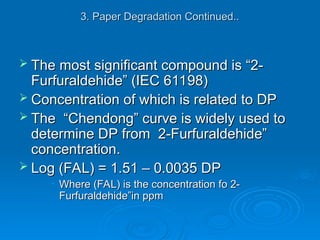
The most significant compound is “2-
The most significant compound is “2-
Furfuraldehide” (IEC 61198)
Furfuraldehide” (IEC 61198)
Concentration of which is related to DP
Concentration of which is related to DP
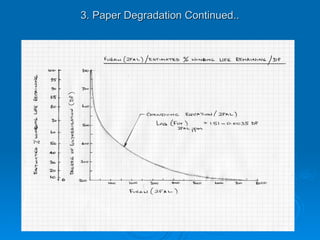
The “Chendong” curve is widely used to
The “Chendong” curve is widely used to
determine DP from 2-Furfuraldehide”
determine DP from 2-Furfuraldehide”
concentration.
concentration.
Log (FAL) = 1.51 – 0.0035 DP
Log (FAL) = 1.51 – 0.0035 DP
• Where (FAL) is the concentration fo 2-
Where (FAL) is the concentration fo 2-
Furfuraldehide”in ppm
Furfuraldehide”in ppm
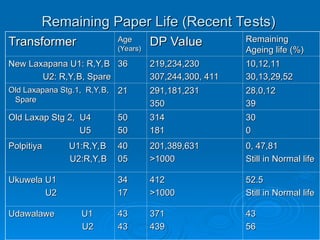
Remaining Paper Life(Recent Tests)
Remaining Paper Life (Recent Tests)
Transformer
Transformer Age
Age
(Years)
(Years)
DP Value
DP Value Remaining
Remaining
Ageing life (%)
Ageing life (%)
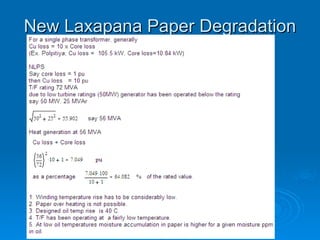
New Laxapana U1: R,Y,B
New Laxapana U1: R,Y,B
U2: R,Y,B, Spare
U2: R,Y,B, Spare
36
36 219,234,230
219,234,230
307,244,300, 411
307,244,300, 411
10,12,11
10,12,11
30,13,29,52
30,13,29,52
Old Laxapana Stg.1, R,Y,B,
Old Laxapana Stg.1, R,Y,B,
Spare
Spare
21
21 291,181,231
291,181,231
350
350
28,0,12
28,0,12
39
39
Old Laxap Stg 2, U4
Old Laxap Stg 2, U4
U5
U5
50
50
50
50
314
314
181
181
30
30
0
0
Polpitiya U1:R,Y,B
Polpitiya U1:R,Y,B
U2:R,Y,B
U2:R,Y,B
40
40
05
05
201,389,631
201,389,631
>1000
>1000
0, 47,81
0, 47,81
Still in Normal life
Still in Normal life
Ukuwela U1
Ukuwela U1
U2
U2
34
34
17
17
412
412
>1000
>1000
52.5
52.5
Still in Normal life
Still in Normal life
Udawalawe U1
Udawalawe U1
U2
U2
43
43
43
43
371
371
439
439
43
43
56
56
82.
Causes of PaperDegradation
Causes of Paper Degradation
Temperature (Pyrolysis)
Temperature (Pyrolysis)
Water
Water
Oxygen & Oxidation by products (Acidic
Oxygen & Oxidation by products (Acidic
compounds)
compounds)
83.
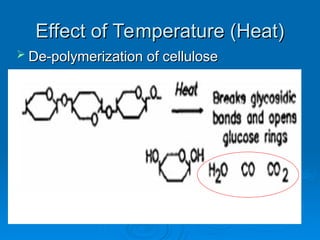
Effect of Temperature(Heat)
Effect of Temperature (Heat)
De-polymerization of cellulose
De-polymerization of cellulose
84.
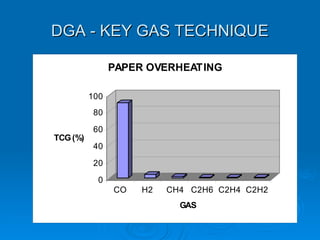
DGA - KEYGAS TECHNIQUE
DGA - KEY GAS TECHNIQUE
0
20
40
60
80
100
TCG(%)
CO H2 CH4 C2H6 C2H4 C2H2
GAS
PAPER OVERHEATING
85.
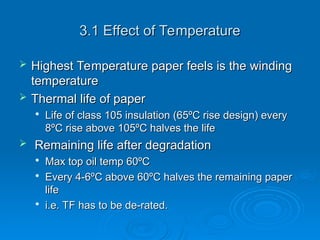
3.1 Effect ofTemperature
3.1 Effect of Temperature
Highest Temperature paper feels is the winding
Highest Temperature paper feels is the winding
temperature
temperature
Thermal life of paper
Thermal life of paper
Life of class 105 insulation (65ºC rise design) every
Life of class 105 insulation (65ºC rise design) every
8ºC rise above 105ºC halves the life
8ºC rise above 105ºC halves the life
Remaining life after degradation
Remaining life after degradation
Max top oil temp 60ºC
Max top oil temp 60ºC
Every 4-6ºC above 60ºC halves the remaining paper
Every 4-6ºC above 60ºC halves the remaining paper
life
life
i.e. TF has to be de-rated.
i.e. TF has to be de-rated.
86.
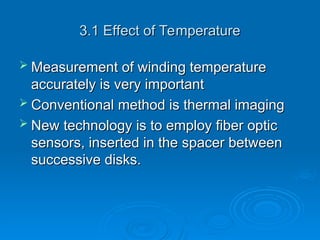
3.1 Effect ofTemperature
3.1 Effect of Temperature
Measurement of winding temperature
Measurement of winding temperature
accurately is very important
accurately is very important
Conventional method is thermal imaging
Conventional method is thermal imaging
New technology is to employ fiber optic
New technology is to employ fiber optic
sensors, inserted in the spacer between
sensors, inserted in the spacer between
successive disks.
successive disks.
87.
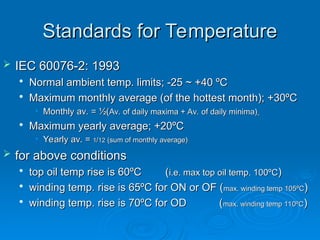
Standards for Temperature
Standardsfor Temperature
IEC 60076-2: 1993
IEC 60076-2: 1993
Normal ambient temp. limits; -25 ~ +40 ºC
Normal ambient temp. limits; -25 ~ +40 ºC
Maximum monthly average (of the hottest month); +30ºC
Maximum monthly average (of the hottest month); +30ºC
• Monthly av. = ½(
Monthly av. = ½(Av. of daily maxima + Av. of daily minima)
Av. of daily maxima + Av. of daily minima)
Maximum yearly average; +20ºC
Maximum yearly average; +20ºC
• Yearly av. =
Yearly av. = 1
1/
/12
12 (sum of monthly average)
(sum of monthly average)
for above conditions
for above conditions
top oil temp rise is 60ºC (
top oil temp rise is 60ºC (i.e. max top oil temp. 100ºC
i.e. max top oil temp. 100ºC)
)
winding temp. rise is 65ºC for ON or OF (
winding temp. rise is 65ºC for ON or OF (max. winding temp 105ºC
max. winding temp 105ºC)
)
winding temp. rise is 70ºC for OD (
winding temp. rise is 70ºC for OD (max. winding temp 110ºC
max. winding temp 110ºC)
)
88.
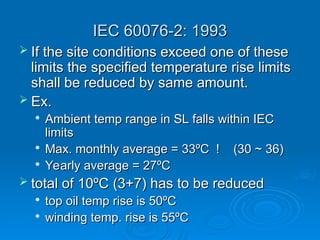
IEC 60076-2: 1993
IEC60076-2: 1993
If the site conditions exceed one of these
If the site conditions exceed one of these
limits the specified temperature rise limits
limits the specified temperature rise limits
shall be reduced by same amount.
shall be reduced by same amount.
Ex.
Ex.
Ambient temp range in SL falls within IEC
Ambient temp range in SL falls within IEC
limits
limits
Max. monthly average = 33ºC ! (30 ~ 36)
Max. monthly average = 33ºC ! (30 ~ 36)
Yearly average = 27ºC
Yearly average = 27ºC
total of 10ºC (3+7) has to be reduced
total of 10ºC (3+7) has to be reduced
top oil temp rise is 50ºC
top oil temp rise is 50ºC
winding temp. rise is 55ºC
winding temp. rise is 55ºC
89.
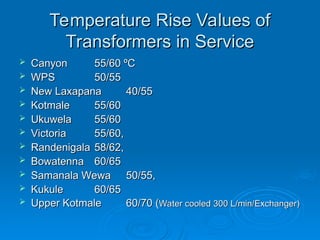
Temperature Rise Valuesof
Temperature Rise Values of
Transformers in Service
Transformers in Service
Canyon
Canyon 55/60 ºC
55/60 ºC
WPS
WPS 50/55
50/55
New Laxapana
New Laxapana 40/55
40/55
Kotmale
Kotmale 55/60
55/60
Ukuwela
Ukuwela 55/60
55/60
Victoria
Victoria 55/60,
55/60,
Randenigala
Randenigala 58/62,
58/62,
Bowatenna
Bowatenna 60/65
60/65
Samanala Wewa
Samanala Wewa 50/55,
50/55,
Kukule
Kukule 60/65
60/65
Upper Kotmale
Upper Kotmale 60/70 (
60/70 (Water cooled 300 L/min/Exchanger)
Water cooled 300 L/min/Exchanger)
90.
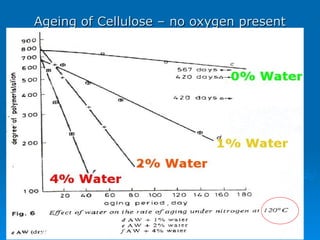
Ageing of Cellulose– no oxygen present
Ageing of Cellulose – no oxygen present
91.
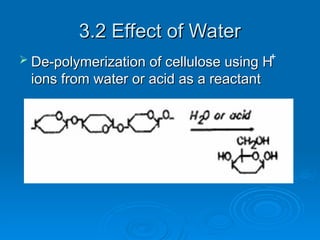
3.2 Effect ofWater
3.2 Effect of Water
De-polymerization of cellulose using H
De-polymerization of cellulose using H
ions from water or acid as a reactant
ions from water or acid as a reactant
+
92.
Water in Transformer
Waterin Transformer
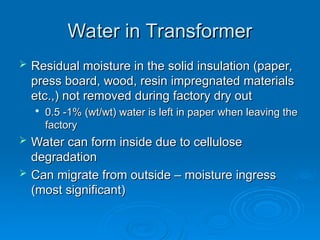
Residual moisture in the solid insulation (paper,
Residual moisture in the solid insulation (paper,
press board, wood, resin impregnated materials
press board, wood, resin impregnated materials
etc.,) not removed during factory dry out
etc.,) not removed during factory dry out
0.5 -1% (wt/wt) water is left in paper when leaving the
0.5 -1% (wt/wt) water is left in paper when leaving the
factory
factory
Water can form inside due to cellulose
Water can form inside due to cellulose
degradation
degradation
Can migrate from outside – moisture ingress
Can migrate from outside – moisture ingress
(most significant)
(most significant)
93.
Water in Transformer
Waterin Transformer
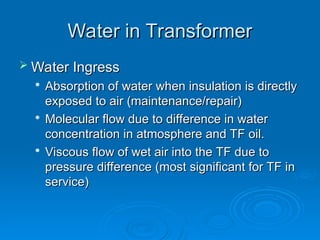
Water Ingress
Water Ingress
Absorption of water when insulation is directly
Absorption of water when insulation is directly
exposed to air (maintenance/repair)
exposed to air (maintenance/repair)
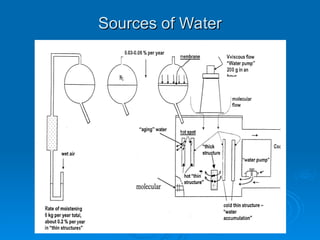
Molecular flow due to difference in water
Molecular flow due to difference in water
concentration in atmosphere and TF oil.
concentration in atmosphere and TF oil.
Viscous flow of wet air into the TF due to
Viscous flow of wet air into the TF due to
pressure difference (most significant for TF in
pressure difference (most significant for TF in
service)
service)
94.
Water in Transformer
Waterin Transformer
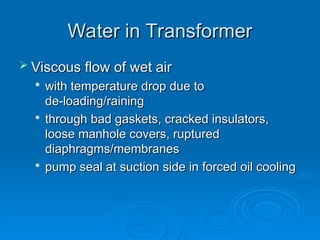
Viscous flow of wet air
Viscous flow of wet air
with temperature drop due to
with temperature drop due to
de-loading/raining
de-loading/raining
through bad gaskets, cracked insulators,
through bad gaskets, cracked insulators,
loose manhole covers, ruptured
loose manhole covers, ruptured
diaphragms/membranes
diaphragms/membranes
pump seal at suction side in forced oil cooling
pump seal at suction side in forced oil cooling
95.
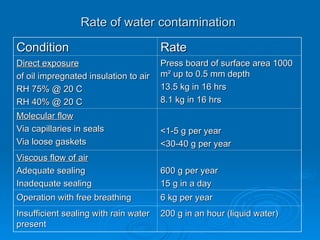
Rate of watercontamination
Rate of water contamination
Condition
Condition Rate
Rate
Direct exposure
Direct exposure
of oil impregnated insulation to air
of oil impregnated insulation to air
RH 75% @ 20 C
RH 75% @ 20 C
RH 40% @ 20 C
RH 40% @ 20 C
Press board of surface area 1000
Press board of surface area 1000
m² up to 0.5 mm depth
m² up to 0.5 mm depth
13.5 kg in 16 hrs
13.5 kg in 16 hrs
8.1 kg in 16 hrs
8.1 kg in 16 hrs
Molecular flow
Molecular flow
Via capillaries in seals
Via capillaries in seals
Via loose gaskets
Via loose gaskets
<1-5 g per year
<1-5 g per year
<30-40 g per year
<30-40 g per year
Viscous flow of air
Viscous flow of air
Adequate sealing
Adequate sealing
Inadequate sealing
Inadequate sealing
600 g per year
600 g per year
15 g in a day
15 g in a day
Operation with free breathing
Operation with free breathing 6 kg per year
6 kg per year
Insufficient sealing with rain water
Insufficient sealing with rain water
present
present
200 g in an hour (liquid water)
200 g in an hour (liquid water)
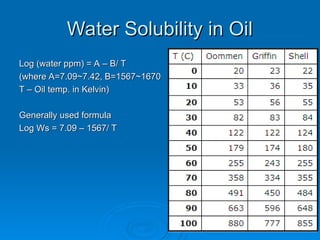
Water Solubility inOil
Water Solubility in Oil
Log (water ppm) = A – B/ T
Log (water ppm) = A – B/ T
(where A=7.09~7.42, B=1567~1670
(where A=7.09~7.42, B=1567~1670
T – Oil temp. in Kelvin)
T – Oil temp. in Kelvin)
Generally used formula
Generally used formula
Log Ws = 7.09 – 1567/ T
Log Ws = 7.09 – 1567/ T
98.
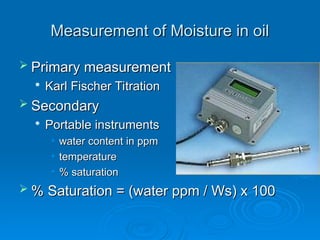
Measurement of Moisturein oil
Measurement of Moisture in oil
Primary measurement
Primary measurement
Karl Fischer Titration
Karl Fischer Titration
Secondary
Secondary
Portable instruments
Portable instruments
• water content in ppm
water content in ppm
• temperature
temperature
• % saturation
% saturation
% Saturation = (water ppm / Ws) x 100
% Saturation = (water ppm / Ws) x 100
99.
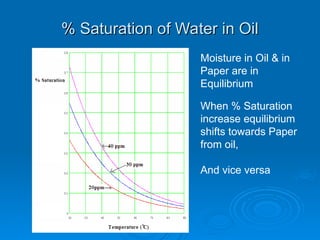
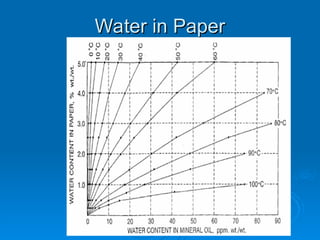
% Saturation ofWater in Oil
% Saturation of Water in Oil
Moisture in Oil & in
Paper are in
Equilibrium
When % Saturation
increase equilibrium
shifts towards Paper
from oil,
And vice versa
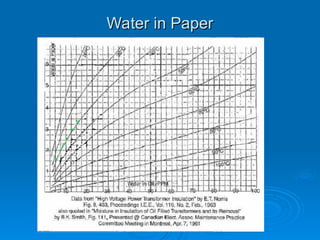
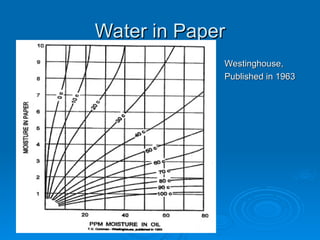
Water in Paper
Waterin Paper
Westinghouse,
Westinghouse,
Published in 1963
Published in 1963
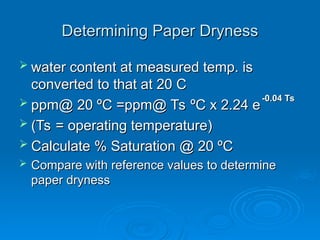
104.
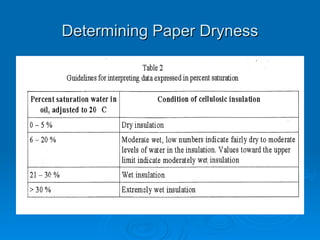
Determining Paper Dryness
DeterminingPaper Dryness
water content at measured temp. is
water content at measured temp. is
converted to that at 20 C
converted to that at 20 C
ppm@ 20 ºC =ppm@ Ts ºC x 2.24 e
ppm@ 20 ºC =ppm@ Ts ºC x 2.24 e
(Ts = operating temperature)
(Ts = operating temperature)
Calculate % Saturation @ 20 ºC
Calculate % Saturation @ 20 ºC
Compare with reference values to determine
Compare with reference values to determine
paper dryness
paper dryness
-0.04 Ts
-0.04 Ts
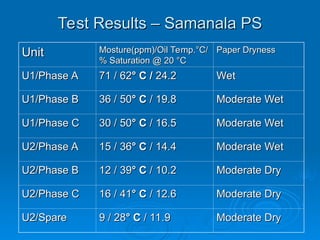
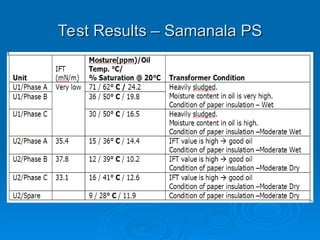
Test Results –Samanala PS
Test Results – Samanala PS
Unit
Unit Mosture(ppm)/Oil Temp.°C/
Mosture(ppm)/Oil Temp.°C/
% Saturation @ 20 °C
% Saturation @ 20 °C
Paper Dryness
Paper Dryness
U1/Phase A
U1/Phase A 71 / 62
71 / 62° C /
° C / 24.2
24.2 Wet
Wet
U1/Phase B
U1/Phase B 36 / 50
36 / 50° C
° C / 19.8
/ 19.8 Moderate Wet
Moderate Wet
U1/Phase C
U1/Phase C 30 / 50
30 / 50° C
° C / 16.5
/ 16.5 Moderate Wet
Moderate Wet
U2/Phase A
U2/Phase A 15 / 36
15 / 36° C
° C / 14.4
/ 14.4 Moderate Wet
Moderate Wet
U2/Phase B
U2/Phase B 12 / 39
12 / 39° C
° C / 10.2
/ 10.2 Moderate Dry
Moderate Dry
U2/Phase C
U2/Phase C 16 / 41
16 / 41° C
° C / 12.6
/ 12.6 Moderate Dry
Moderate Dry
U2/Spare
U2/Spare 9 / 28
9 / 28° C
° C / 11.9
/ 11.9 Moderate Dry
Moderate Dry
107.
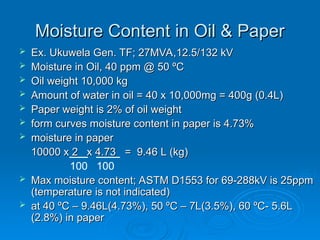
Moisture Content inOil & Paper
Moisture Content in Oil & Paper
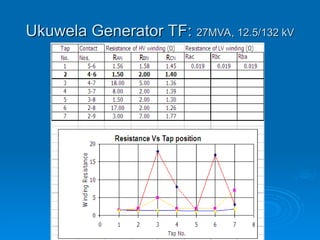
Ex. Ukuwela Gen. TF; 27MVA,12.5/132 kV
Ex. Ukuwela Gen. TF; 27MVA,12.5/132 kV
Moisture in Oil, 40 ppm @ 50 ºC
Moisture in Oil, 40 ppm @ 50 ºC
Oil weight 10,000 kg
Oil weight 10,000 kg
Amount of water in oil = 40 x 10,000mg = 400g (0.4L)
Amount of water in oil = 40 x 10,000mg = 400g (0.4L)
Paper weight is 2% of oil weight
Paper weight is 2% of oil weight
form curves moisture content in paper is 4.73%
form curves moisture content in paper is 4.73%
moisture in paper
moisture in paper
10000 x 2 x 4.73 = 9.46 L (kg)
10000 x 2 x 4.73 = 9.46 L (kg)
Max moisture content; ASTM D1553 for 69-288kV is 25ppm
Max moisture content; ASTM D1553 for 69-288kV is 25ppm
(temperature is not indicated)
(temperature is not indicated)
at 40 ºC – 9.46L(4.73%), 50 ºC – 7L(3.5%), 60 ºC- 5.6L
at 40 ºC – 9.46L(4.73%), 50 ºC – 7L(3.5%), 60 ºC- 5.6L
(2.8%) in paper
(2.8%) in paper
100 100
109.
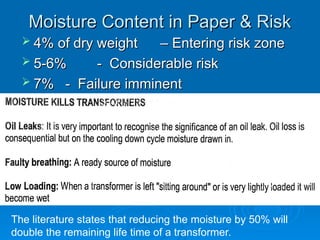
Moisture Content inPaper & Risk
Moisture Content in Paper & Risk
4% of dry weight
4% of dry weight – Entering risk zone
– Entering risk zone
5-6%
5-6% - Considerable risk
- Considerable risk
7%
7% - Failure imminent
- Failure imminent
The literature states that reducing the moisture by 50% will
double the remaining life time of a transformer.
110.
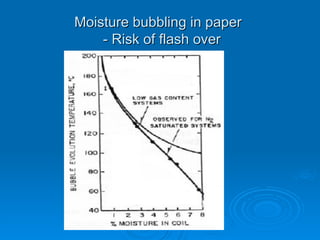
Moisture bubbling inpaper
Moisture bubbling in paper
- Risk of flash over
- Risk of flash over
112.
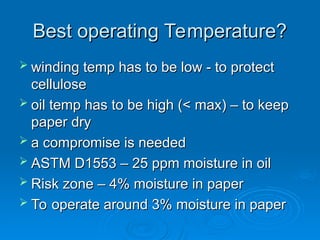
Best operating Temperature?
Bestoperating Temperature?
winding temp has to be low - to protect
winding temp has to be low - to protect
cellulose
cellulose
oil temp has to be high (< max) – to keep
oil temp has to be high (< max) – to keep
paper dry
paper dry
a compromise is needed
a compromise is needed
ASTM D1553 – 25 ppm moisture in oil
ASTM D1553 – 25 ppm moisture in oil
Risk zone – 4% moisture in paper
Risk zone – 4% moisture in paper
To operate around 3% moisture in paper
To operate around 3% moisture in paper
113.
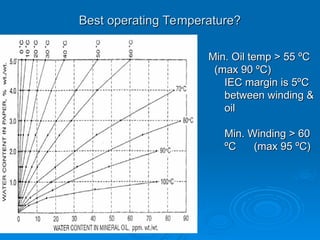
Best operating Temperature?
Bestoperating Temperature?
Min. Oil temp > 55 ºC
Min. Oil temp > 55 ºC
(max 90 ºC)
(max 90 ºC)
IEC margin is 5ºC
IEC margin is 5ºC
between winding &
between winding &
oil
oil
Min. Winding > 60
Min. Winding > 60
ºC (max 95 ºC)
ºC (max 95 ºC)
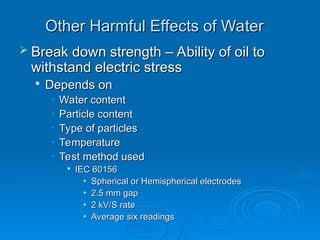
Other Harmful Effectsof Water
Other Harmful Effects of Water
Break down strength – Ability of oil to
Break down strength – Ability of oil to
withstand electric stress
withstand electric stress
Depends on
Depends on
• Water content
Water content
• Particle content
Particle content
• Type of particles
Type of particles
• Temperature
Temperature
• Test method used
Test method used
IEC 60156
IEC 60156
• Spherical or Hemispherical electrodes
Spherical or Hemispherical electrodes
• 2.5 mm gap
2.5 mm gap
• 2 kV/S rate
2 kV/S rate
• Average six readings
Average six readings
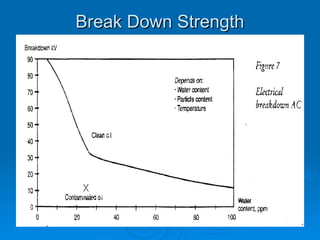
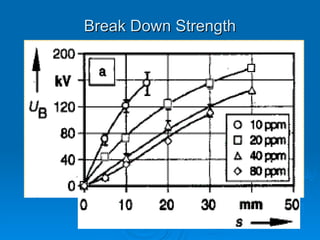
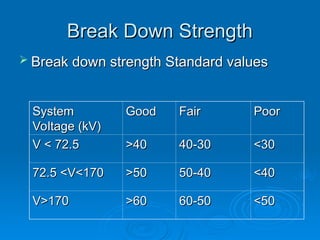
Break Down Strength
BreakDown Strength
Break down strength Standard values
Break down strength Standard values
System
System
Voltage (kV)
Voltage (kV)
Good
Good Fair
Fair Poor
Poor
V < 72.5
V < 72.5 >40
>40 40-30
40-30 <30
<30
72.5 <V<170
72.5 <V<170 >50
>50 50-40
50-40 <40
<40
V>170
V>170 >60
>60 60-50
60-50 <50
<50
119.
Oil temperature VsIR
Oil temperature Vs IR
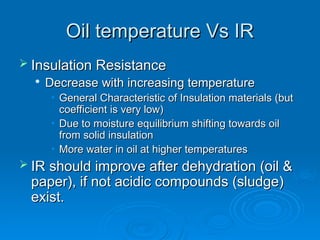
Insulation Resistance
Insulation Resistance
Decrease with increasing temperature
Decrease with increasing temperature
• General Characteristic of Insulation materials (but
General Characteristic of Insulation materials (but
coefficient is very low)
coefficient is very low)
• Due to moisture equilibrium shifting towards oil
Due to moisture equilibrium shifting towards oil
from solid insulation
from solid insulation
• More water in oil at higher temperatures
More water in oil at higher temperatures
IR should improve after dehydration (oil &
IR should improve after dehydration (oil &
paper), if not acidic compounds (sludge)
paper), if not acidic compounds (sludge)
exist.
exist.
120.
3.3 Oxygen &Oxidation By Products
3.3 Oxygen & Oxidation By Products
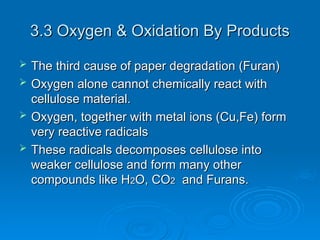
The third cause of paper degradation (Furan)
The third cause of paper degradation (Furan)
Oxygen alone cannot chemically react with
Oxygen alone cannot chemically react with
cellulose material.
cellulose material.
Oxygen, together with metal ions (Cu,Fe) form
Oxygen, together with metal ions (Cu,Fe) form
very reactive radicals
very reactive radicals
These radicals decomposes cellulose into
These radicals decomposes cellulose into
weaker cellulose and form many other
weaker cellulose and form many other
compounds like H
compounds like H2
2O, CO
O, CO2
2 and Furans.
and Furans.
121.
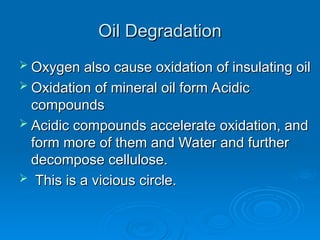
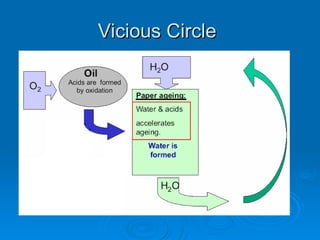
Oil Degradation
Oil Degradation
Oxygen also cause oxidation of insulating oil
Oxygen also cause oxidation of insulating oil
Oxidation of mineral oil form Acidic
Oxidation of mineral oil form Acidic
compounds
compounds
Acidic compounds accelerate oxidation, and
Acidic compounds accelerate oxidation, and
form more of them and Water and further
form more of them and Water and further
decompose cellulose.
decompose cellulose.
This is a vicious circle.
This is a vicious circle.
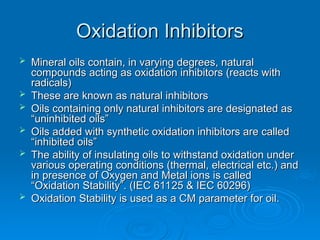
Oxidation Inhibitors
Oxidation Inhibitors
Mineral oils contain, in varying degrees, natural
Mineral oils contain, in varying degrees, natural
compounds acting as oxidation inhibitors (reacts with
compounds acting as oxidation inhibitors (reacts with
radicals)
radicals)
These are known as natural inhibitors
These are known as natural inhibitors
Oils containing only natural inhibitors are designated as
Oils containing only natural inhibitors are designated as
“uninhibited oils”
“uninhibited oils”
Oils added with synthetic oxidation inhibitors are called
Oils added with synthetic oxidation inhibitors are called
“inhibited oils”
“inhibited oils”
The ability of insulating oils to withstand oxidation under
The ability of insulating oils to withstand oxidation under
various operating conditions (thermal, electrical etc.) and
various operating conditions (thermal, electrical etc.) and
in presence of Oxygen and Metal ions is called
in presence of Oxygen and Metal ions is called
“Oxidation Stability”. (IEC 61125 & IEC 60296)
“Oxidation Stability”. (IEC 61125 & IEC 60296)
Oxidation Stability is used as a CM parameter for oil.
Oxidation Stability is used as a CM parameter for oil.
124.
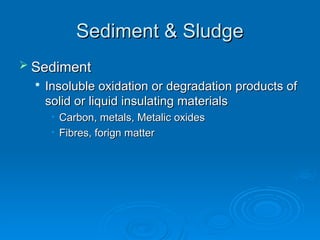
Sediment & Sludge
Sediment& Sludge
Sediment
Sediment
Insoluble oxidation or degradation products of
Insoluble oxidation or degradation products of
solid or liquid insulating materials
solid or liquid insulating materials
• Carbon, metals, Metalic oxides
Carbon, metals, Metalic oxides
• Fibres, forign matter
Fibres, forign matter
125.
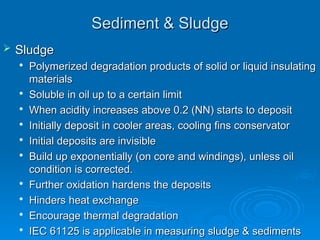
Sediment & Sludge
Sediment& Sludge
Sludge
Sludge
Polymerized degradation products of solid or liquid insulating
Polymerized degradation products of solid or liquid insulating
materials
materials
Soluble in oil up to a certain limit
Soluble in oil up to a certain limit
When acidity increases above 0.2 (NN) starts to deposit
When acidity increases above 0.2 (NN) starts to deposit
Initially deposit in cooler areas, cooling fins conservator
Initially deposit in cooler areas, cooling fins conservator
Initial deposits are invisible
Initial deposits are invisible
Build up exponentially (on core and windings), unless oil
Build up exponentially (on core and windings), unless oil
condition is corrected.
condition is corrected.
Further oxidation hardens the deposits
Further oxidation hardens the deposits
Hinders heat exchange
Hinders heat exchange
Encourage thermal degradation
Encourage thermal degradation
IEC 61125 is applicable in measuring sludge & sediments
IEC 61125 is applicable in measuring sludge & sediments
126.
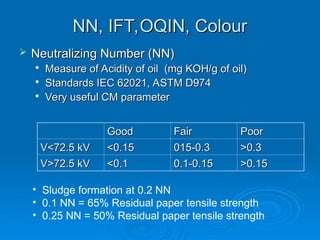
NN, IFT,OQIN, Colour
NN,IFT,OQIN, Colour
Neutralizing Number (NN)
Neutralizing Number (NN)
Measure of Acidity of oil (mg KOH/g of oil)
Measure of Acidity of oil (mg KOH/g of oil)
Standards IEC 62021, ASTM D974
Standards IEC 62021, ASTM D974
Very useful CM parameter
Very useful CM parameter
Good
Good Fair
Fair Poor
Poor
V<72.5 kV
V<72.5 kV <0.15
<0.15 015-0.3
015-0.3 >0.3
>0.3
V>72.5 kV
V>72.5 kV <0.1
<0.1 0.1-0.15
0.1-0.15 >0.15
>0.15
• Sludge formation at 0.2 NN
• 0.1 NN = 65% Residual paper tensile strength
• 0.25 NN = 50% Residual paper tensile strength
127.
NN, IFT,OQIN, Colour
NN,IFT,OQIN, Colour
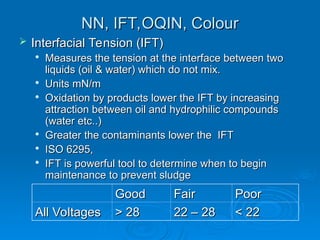
Interfacial Tension (IFT)
Interfacial Tension (IFT)
Measures the tension at the interface between two
Measures the tension at the interface between two
liquids (oil & water) which do not mix.
liquids (oil & water) which do not mix.
Units mN/m
Units mN/m
Oxidation by products lower the IFT by increasing
Oxidation by products lower the IFT by increasing
attraction between oil and hydrophilic compounds
attraction between oil and hydrophilic compounds
(water etc..)
(water etc..)
Greater the contaminants lower the IFT
Greater the contaminants lower the IFT
ISO 6295,
ISO 6295,
IFT is powerful tool to determine when to begin
IFT is powerful tool to determine when to begin
maintenance to prevent sludge
maintenance to prevent sludge
Good
Good Fair
Fair Poor
Poor
All Voltages
All Voltages > 28
> 28 22 – 28
22 – 28 < 22
< 22
128.
NN, IFT,OQIN, Colour
NN,IFT,OQIN, Colour
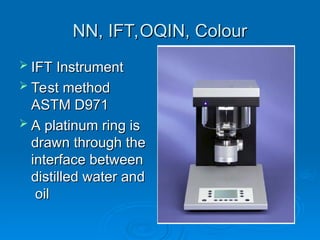
IFT Instrument
IFT Instrument
Test method
Test method
ASTM D971
ASTM D971
A platinum ring is
A platinum ring is
drawn through the
drawn through the
interface between
interface between
distilled water and
distilled water and
oil
oil
129.
NN & IFT
NN& IFT
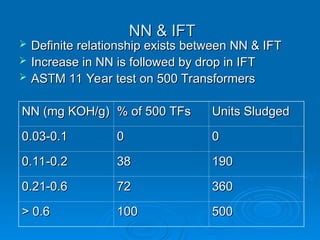
Definite relationship exists between NN & IFT
Definite relationship exists between NN & IFT
Increase in NN is followed by drop in IFT
Increase in NN is followed by drop in IFT
ASTM 11 Year test on 500 Transformers
ASTM 11 Year test on 500 Transformers
NN (mg KOH/g)
NN (mg KOH/g) % of 500 TFs
% of 500 TFs Units Sludged
Units Sludged
0.03-0.1
0.03-0.1 0
0 0
0
0.11-0.2
0.11-0.2 38
38 190
190
0.21-0.6
0.21-0.6 72
72 360
360
> 0.6
> 0.6 100
100 500
500
130.
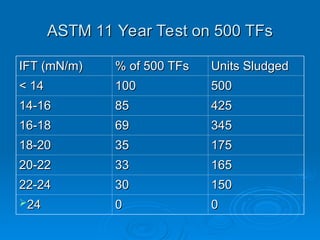
ASTM 11 YearTest on 500 TFs
ASTM 11 Year Test on 500 TFs
IFT (mN/m)
IFT (mN/m) % of 500 TFs
% of 500 TFs Units Sludged
Units Sludged
< 14
< 14 100
100 500
500
14-16
14-16 85
85 425
425
16-18
16-18 69
69 345
345
18-20
18-20 35
35 175
175
20-22
20-22 33
33 165
165
22-24
22-24 30
30 150
150
24
24 0
0 0
0
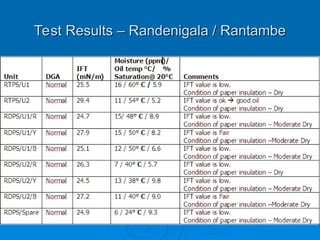
Test Results –Randenigala / Rantambe
Test Results – Randenigala / Rantambe
133.
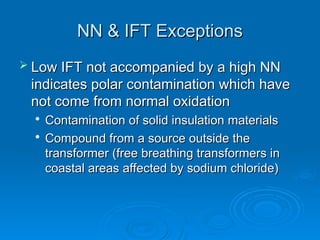
NN & IFTExceptions
NN & IFT Exceptions
Low IFT not accompanied by a high NN
Low IFT not accompanied by a high NN
indicates polar contamination which have
indicates polar contamination which have
not come from normal oxidation
not come from normal oxidation
Contamination of solid insulation materials
Contamination of solid insulation materials
Compound from a source outside the
Compound from a source outside the
transformer (free breathing transformers in
transformer (free breathing transformers in
coastal areas affected by sodium chloride)
coastal areas affected by sodium chloride)
134.
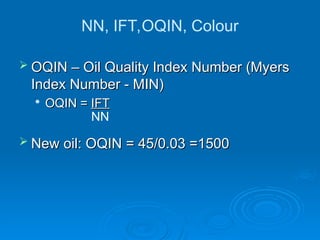
NN, IFT,OQIN, Colour
OQIN – Oil Quality Index Number (Myers
OQIN – Oil Quality Index Number (Myers
Index Number - MIN)
Index Number - MIN)
OQIN =
OQIN = IFT
IFT
New oil: OQIN = 45/0.03 =1500
New oil: OQIN = 45/0.03 =1500
NN
135.
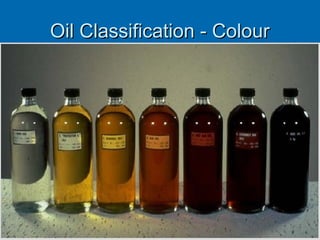
Oil Classification
Oil Classification
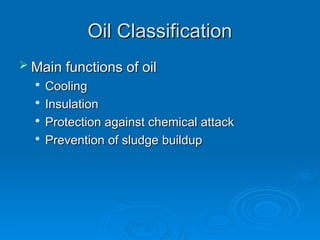
Main functions of oil
Main functions of oil
Cooling
Cooling
Insulation
Insulation
Protection against chemical attack
Protection against chemical attack
Prevention of sludge buildup
Prevention of sludge buildup
136.
Oil Classification
Oil Classification
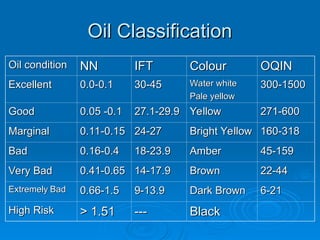
Oilcondition
Oil condition NN
NN IFT
IFT Colour
Colour OQIN
OQIN
Excellent
Excellent 0.0-0.1
0.0-0.1 30-45
30-45 Water white
Water white
Pale yellow
Pale yellow
300-1500
300-1500
Good
Good 0.05 -0.1
0.05 -0.1 27.1-29.9
27.1-29.9 Yellow
Yellow 271-600
271-600
Marginal
Marginal 0.11-0.15
0.11-0.15 24-27
24-27 Bright Yellow
Bright Yellow 160-318
160-318
Bad
Bad 0.16-0.4
0.16-0.4 18-23.9
18-23.9 Amber
Amber 45-159
45-159
Very Bad
Very Bad 0.41-0.65
0.41-0.65 14-17.9
14-17.9 Brown
Brown 22-44
22-44
Extremely
Extremely Bad
Bad 0.66-1.5
0.66-1.5 9-13.9
9-13.9 Dark Brown
Dark Brown 6-21
6-21
High Risk
High Risk > 1.51
> 1.51 ---
--- Black
Black
137.
Oil Classification
Oil Classification
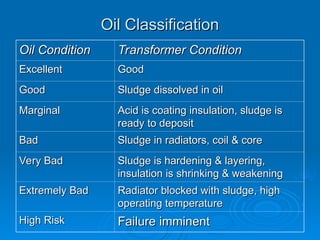
OilCondition
Oil Condition Transformer Condition
Transformer Condition
Excellent
Excellent Good
Good
Good
Good Sludge dissolved in oil
Sludge dissolved in oil
Marginal
Marginal Acid is coating insulation, sludge is
Acid is coating insulation, sludge is
ready to deposit
ready to deposit
Bad
Bad Sludge in radiators, coil & core
Sludge in radiators, coil & core
Very Bad
Very Bad Sludge is hardening & layering,
Sludge is hardening & layering,
insulation is shrinking & weakening
insulation is shrinking & weakening
Extremely Bad
Extremely Bad Radiator blocked with sludge, high
Radiator blocked with sludge, high
operating temperature
operating temperature
High Risk
High Risk Failure imminent
Failure imminent
Dielectric Dissipation Factor- DDF
Dielectric Dissipation Factor - DDF
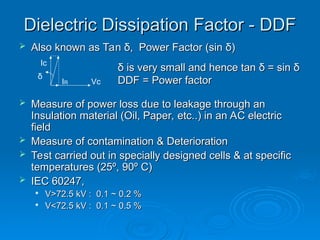
Also known as Tan
Also known as Tan δ
δ, Power Factor (sin
, Power Factor (sin δ
δ)
)
Measure of power loss due to leakage through an
Measure of power loss due to leakage through an
Insulation material (Oil, Paper, etc..) in an AC electric
Insulation material (Oil, Paper, etc..) in an AC electric
field
field
Measure of contamination & Deterioration
Measure of contamination & Deterioration
Test carried out in specially designed cells & at specific
Test carried out in specially designed cells & at specific
temperatures (25º, 90º C)
temperatures (25º, 90º C)
IEC 60247,
IEC 60247,
V>72.5 kV : 0.1 ~ 0.2 %
V>72.5 kV : 0.1 ~ 0.2 %
V<72.5 kV : 0.1 ~ 0.5 %
V<72.5 kV : 0.1 ~ 0.5 %
Ic
Vc
IR
δ
δ
δ is very small and hence tan
is very small and hence tan δ
δ = sin
= sin δ
δ
DDF = Power factor
DDF = Power factor
140.
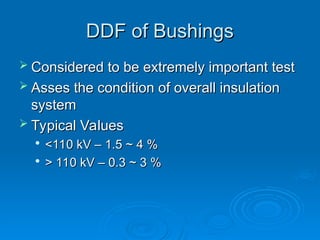
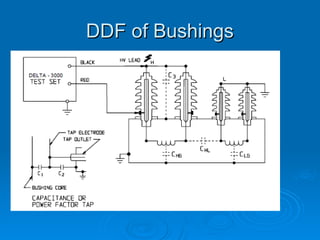
DDF of Bushings
DDFof Bushings
Considered to be extremely important test
Considered to be extremely important test
Asses the condition of overall insulation
Asses the condition of overall insulation
system
system
Typical Values
Typical Values
<110 kV – 1.5 ~ 4 %
<110 kV – 1.5 ~ 4 %
> 110 kV – 0.3 ~ 3 %
> 110 kV – 0.3 ~ 3 %
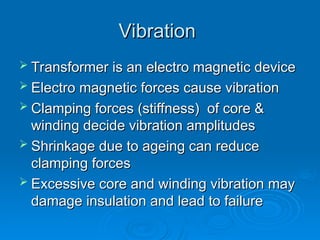
Vibration
Vibration
Transformer isan electro magnetic device
Transformer is an electro magnetic device
Electro magnetic forces cause vibration
Electro magnetic forces cause vibration
Clamping forces (stiffness) of core &
Clamping forces (stiffness) of core &
winding decide vibration amplitudes
winding decide vibration amplitudes
Shrinkage due to ageing can reduce
Shrinkage due to ageing can reduce
clamping forces
clamping forces
Excessive core and winding vibration may
Excessive core and winding vibration may
damage insulation and lead to failure
damage insulation and lead to failure
143.
Vibration
Vibration
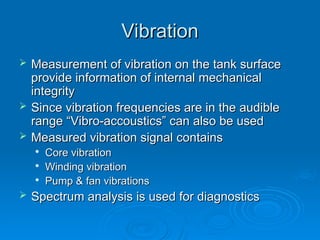
Measurement ofvibration on the tank surface
Measurement of vibration on the tank surface
provide information of internal mechanical
provide information of internal mechanical
integrity
integrity
Since vibration frequencies are in the audible
Since vibration frequencies are in the audible
range “Vibro-accoustics” can also be used
range “Vibro-accoustics” can also be used
Measured vibration signal contains
Measured vibration signal contains
Core vibration
Core vibration
Winding vibration
Winding vibration
Pump & fan vibrations
Pump & fan vibrations
Spectrum analysis is used for diagnostics
Spectrum analysis is used for diagnostics
Vibration
Vibration
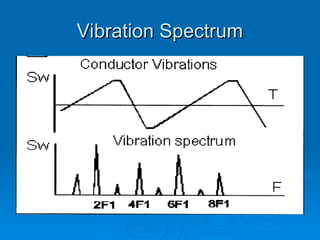
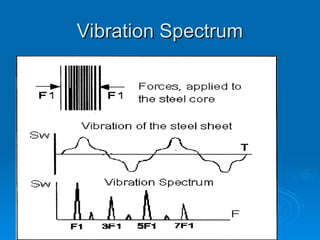
By analyzingthe vibration signal for
By analyzing the vibration signal for
spectrum using FFT the source of
spectrum using FFT the source of
vibration can be diagnosed
vibration can be diagnosed
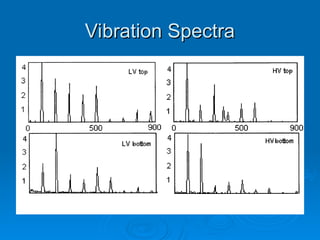
Trending tank vibration according to
Trending tank vibration according to
temperature and loading, an early warning
temperature and loading, an early warning
can be obtained
can be obtained
Hence tank vibration is used as a CM
Hence tank vibration is used as a CM
parameter.
parameter.
148.
Condition Monitoring ofCTs
Condition Monitoring of CTs
Important due to
Important due to
Failures are mostly catastrophic nature
Failures are mostly catastrophic nature
Damage other equipment in the vicinity
Damage other equipment in the vicinity
(Circuit breakers, Surge arrestors, BB support
(Circuit breakers, Surge arrestors, BB support
insulators etc.,)
insulators etc.,)
Generation & transmission outages are
Generation & transmission outages are
possible
possible
Safety of staff
Safety of staff
Maintenance is limited
Maintenance is limited
149.
Condition Monitoring ofCTs
Condition Monitoring of CTs
Different sealing arrangements to cope
Different sealing arrangements to cope
with oil expansion
with oil expansion
Rubber diaphragms
Rubber diaphragms
Nitrogen blanket
Nitrogen blanket
Metal bellows
Metal bellows
150.
Condition Monitoring ofCTs
Condition Monitoring of CTs
CM parameters
CM parameters
Moisture (< 20)
Moisture (< 20)
DGA
DGA
BDV
BDV
DDF
DDF
Internal pressure
Internal pressure
Radio Frequency Interference (RFI)
Radio Frequency Interference (RFI)
Oil leaks:
Oil leaks:
IF OIL CAN GET OUT,
IF OIL CAN GET OUT, WATER CAN GET IN
WATER CAN GET IN
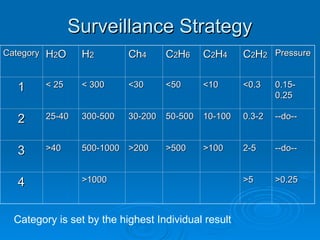
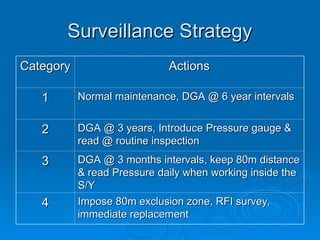
Surveillance Strategy
Surveillance Strategy
Category
CategoryActions
Actions
1
1 Normal maintenance, DGA @ 6 year intervals
Normal maintenance, DGA @ 6 year intervals
2
2 DGA @ 3 years, Introduce Pressure gauge &
DGA @ 3 years, Introduce Pressure gauge &
read @ routine inspection
read @ routine inspection
3
3 DGA @ 3 months intervals, keep 80m distance
DGA @ 3 months intervals, keep 80m distance
& read Pressure daily when working inside the
& read Pressure daily when working inside the
S/Y
S/Y
4
4 Impose 80m exclusion zone, RFI survey,
Impose 80m exclusion zone, RFI survey,
immediate replacement
immediate replacement
153.
Case study
Case study
Samanalawewa4 CTs exploded in 2006/2007
Samanalawewa 4 CTs exploded in 2006/2007
Damaged many equipment including CBs
Damaged many equipment including CBs
Moisture ingress through ruptured diaphragm
Moisture ingress through ruptured diaphragm
70 ppm detected
70 ppm detected
BB protection disabled,
BB protection disabled,
S/Y was by passed to feed power form
S/Y was by passed to feed power form
Ambilipitiya
Ambilipitiya
154.
Case study
Case study
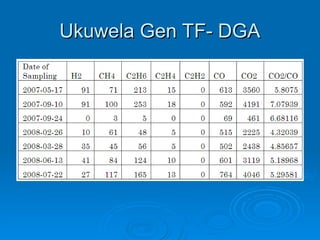
Ukuwela
Ukuwela
DGA revealed excessive Hydrogen
DGA revealed excessive Hydrogen
Moisture was normal
Moisture was normal
Internal pressure was high
Internal pressure was high
Replaced before failure
Replaced before failure
155.
PT & CVT
PT& CVT
Old PTs were fitted with a gas relay
Old PTs were fitted with a gas relay
for PTs, CM parameters similar to that of
for PTs, CM parameters similar to that of
CTs
CTs
A Balance voltage relay for comparison
A Balance voltage relay for comparison
among phases for both PTs & CVTs
among phases for both PTs & CVTs
Alarm level is 3%
Alarm level is 3%
Several explosions & fire at Laxapana in
Several explosions & fire at Laxapana in
2009
2009
#90 [Source: Roland Agnemo]
Ageing under a Nitrogen blanket. These curves are interesting because they show the effect of ”no oxygen” (same as having an efficient Nitrogen blanket). Please note the relative speed of the ageing btw. 0% and 1% moisture. This change in reduction of DP is much more severe than from 1-2% moisture.