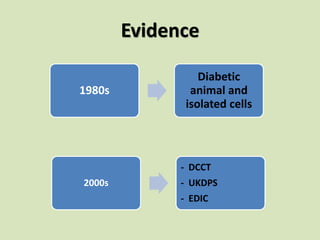
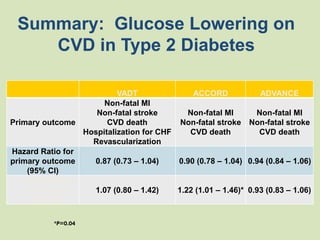
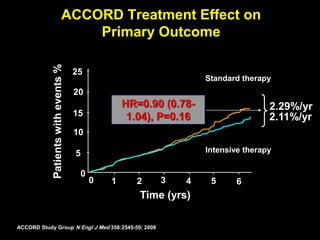
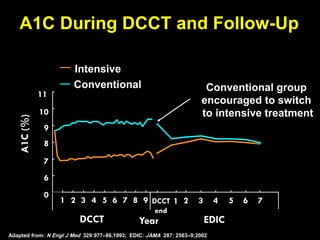
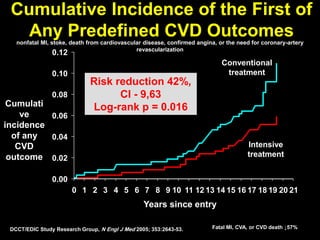
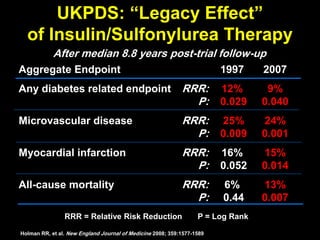
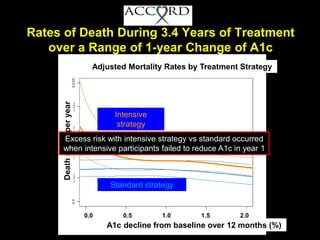
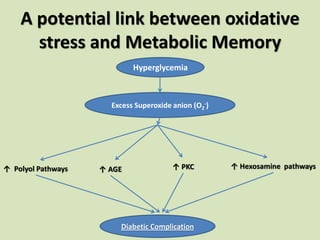
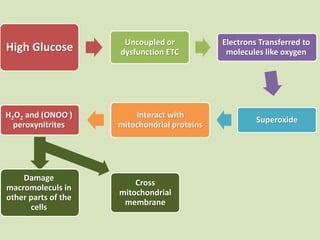
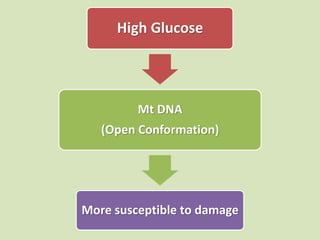
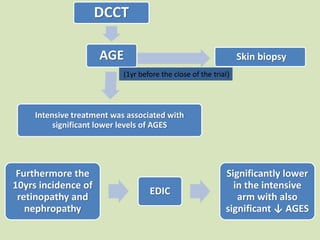
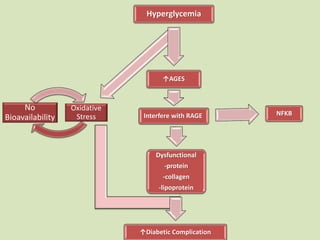
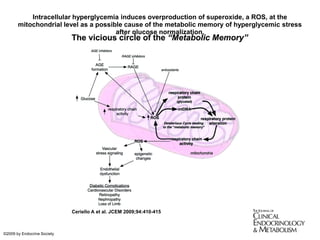
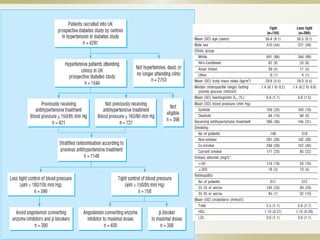
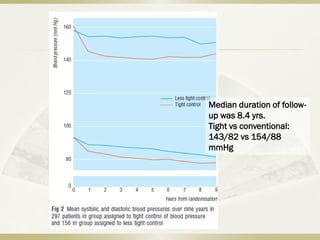
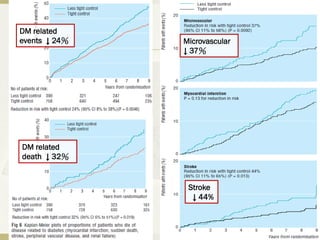
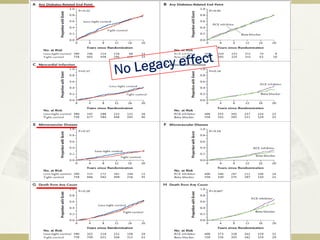
The “Metabolic Memory” is more
than just tight Glucose Control
Legacy effect of Diabetes Treatment
By
Megahed AbuElmagd
Head of Diabetes and Endocrinology Unite
Mansoura
2012
Definition
The concept of a “Metabolic Memory” that is
of diabetic vascular Stresses persisting after
glucose normalization, has been supported
both in the laboratory and in the clinic and in
both Type1 and Type2 diabetes.
Evidence
1980s
Diabetic
animal and
isolated cells
2000s
- DCCT
- UKDPS
- EDIC
*P=0.04
Summary: Glucose Lowering on
CVD in Type 2 Diabetes
VADT ACCORD ADVANCE
Primary outcome
Non-fatal MI
Non-fatal stroke
CVD death
Hospitalization for CHF
Revascularization
Non-fatal MI
Non-fatal stroke
CVD death
Non-fatal MI
Non-fatal stroke
CVD death
Hazard Ratio for
primary outcome
(95% CI)
0.87 (0.73 – 1.04) 0.90 (0.78 – 1.04) 0.94 (0.84 – 1.06)
Hazard Ratio
for mortality
(95% CI)
1.07 (0.80 – 1.42) 1.22 (1.01 – 1.46)* 0.93 (0.83 – 1.06)
ACCORD Treatment Effect on
Primary Outcome
25
0
20
15
10
5
0
1 2 3 4 5
Standard therapy
Intensive therapy
Patientswithevents%
Time (yrs)
HR=0.90 (0.78-
1.04), P=0.16
2.29%/yr
2.11%/yr
ACCORD Study Group N Engl J Med 358:2545-59; 2008
6
Protocol Defined N Events Interaction P-value
Subgroups
Overall 10251 723
Primary Prevention 6643 330 0.04
Secondary Prevention 3608 393
Women 3952 212 0.74
Men 6299 511
Baseline Age<65 6779 383 0.65
Baseline Age≥65 3472 340
Baseline A1C≤8.0 4868 284 0.03
Baseline A1C>8.0 5360 438
Non-White 3647 222 0.29
White 6604 501
ACCORD: Hazard Ratios for Primary
Outcome by Subgroup
0.
6
1.
0
1.
4HR (Intensive vs.
ACCORD Study Group N Engl J Med 358:2545-59;2008.
A1C(%)
YearDCCT
11
10
9
8
7
6
0
91 2 3 4 5 6 7 8 1 2 3 4 5 6 7DCCT
end
EDIC
Conventional group
encouraged to switch
to intensive treatment
Adapted from: N Engl J Med 329:977–86,1993; EDIC: JAMA 287: 2563–9;2002
A1C During DCCT and Follow-Up
Intensive
Conventional
Cumulative Incidence of the First of
Any Predefined CVD Outcomes
Years since entry
Cumulati
ve
incidence
of any
CVD
outcome
Conventional
treatment
Intensive
treatment
0.00
0.02
0.04
0.06
0.08
0.10
0.12
0 1 2 3 4 5 6 7 8 9 10 11 12 13 14 15 16 17 18 19 20 21
Risk reduction 42%,
CI - 9,63
Log-rank p = 0.016
nonfatal MI, stoke, death from cardiovascular disease, confirmed angina, or the need for coronary-artery
revascularization
Fatal MI, CVA, or CVD death ↓57%DCCT/EDIC Study Research Group, N Engl J Med 2005; 353:2643-53.
After median 8.8 years post-trial follow-up
Aggregate Endpoint 1997 2007
Any diabetes related endpoint RRR: 12% 9%
P: 0.029 0.040
Microvascular disease RRR: 25% 24%
P: 0.009 0.001
Myocardial infarction RRR: 16% 15%
P: 0.052 0.014
All-cause mortality RRR: 6% 13%
P: 0.44 0.007
UKPDS: “Legacy Effect”
of Insulin/Sulfonylurea Therapy
RRR = Relative Risk Reduction P = Log Rank
Holman RR, et al. New England Journal of Medicine 2008; 359:1577-1589
11
• Lowering A1C to below or around 7% has been
shown to reduce microvascular and neuropathic
complications of type 1 and type 2 diabetes.
Therefore, for microvascular disease prevention,
the A1C goal for non-pregnant adults in general is
<7%. (A)
ADA – AHA – ACC
Revised Glycemic Control Recommendations
ADA/AHA/ACC. Diabetes Care. 2009; 32:187-92.
12
ADA – AHA – ACC
Revised Glycemic Control Recommendations
• In type 1 and type 2 diabetes, randomized
controlled trials of intensive vs. standard
glycemic control have not shown a significant
reduction in CVD outcomes during the
randomized portion of the trials. Long-term
follow-up of the DCCT and UKPDS cohorts
suggests that treatment to A1C targets below or
around 7% in the years soon after the diagnosis
of diabetes is associated with long-term
reduction in risk of macrovascular disease. Until
more evidence becomes available, the general
goal of <7% appears reasonable for many adults
for macrovascular risk reduction. (B)
ADA/AHA/ACC. Diabetes Care. 2009; 32:187-92.
13
• Subgroup analyses of clinical trials such as the
DCCT and UKPDS, and the microvascular
evidence from the ADVANCE trial, suggest a
small but incremental benefit in microvascular
outcomes with A1C values closer to normal.
Therefore, for selected individual patients,
providers might reasonably suggest even lower
A1C goals than the general goal of <7%, if this
can be achieved without significant hypoglycemia
or other adverse effects of treatment. Such
patients might include those with short duration
of diabetes, long life expectancy, and no
significant cardiovascular disease. (B)
ADA – AHA – ACC
Revised Glycemic Control Recommendations
ADA/AHA/ACC. Diabetes Care. 2009; 32:187-92.
14
• Conversely, less stringent A1C goals than the
general goal of <7% may be appropriate for
patients with a history of severe hypoglycemia,
limited life expectancy, advanced microvascular
or macrovascular complications, extensive
comorbid conditions, and those with
longstanding diabetes in whom the general goal
is difficult to attain despite diabetes self-
management education, appropriate glucose
monitoring, and effective doses of multiple
glucose lowering agents including insulin. (C)
ADA – AHA – ACC
Revised Glycemic Control Recommendations
ADA/AHA/ACC. Diabetes Care. 2009; 32:187-92.
Risk of Death over a Range of Average A1c
Average A1c %
Adjusted log(Hazard Ratio) by Treatment Strategy
Relative to Standard at A1c of 6%
Standard strategy
6 8 97
Steady increase of risk from 6 to 9% A1c with intensive strategy
Excess risk with intensive strategy vs standard occurred above A1c 7%
Intensive strategy
Rates of Death During 3.4 Years of Treatment
over a Range of 1-year Change of A1c
A1c decline from baseline over 12 months (%)
0.0 0.5 1.0 1.5 2.0
Intensive
strategy
Standard strategy
Deathratesperyear
Excess risk with intensive strategy vs standard occurred
when intensive participants failed to reduce A1c in year 1
Adjusted Mortality Rates by Treatment Strategy
A potential link between oxidative
stress and Metabolic Memory
Hyperglycemia
Excess Superoxide anion (O2
-)
Diabetic Complication
↑ Polyol Pathways ↑ AGE ↑ PKC ↑ Hexosamine pathways
High Glucose Uncoupled or
dysfunction ETC
Electrons Transferred to
molecules like oxygen
Superoxide
Interact with
mitochondrial proteins
H2O2 and (ONOO-)
peroxynitrites
Damage
macromoleculs in
other parts of the
cells
Cross
mitochondrial
membrane
High Glucose
Mt DNA
(Open Conformation)
More susceptible to damage
DCCT
AGE
Intensive treatment was associated with
significant lower levels of AGES
Skin biopsy
((1yr before the close of the trial
Furthermore the
10yrs incidence of
retinopathy and
nephropathy
EDIC
Significantly lower
in the intensive
arm with also
significant ↓ AGES
Oxidative
Stress
No
Bioavailability
Hyperglycemia
↑AGES
Interfere with RAGE NFKB
Dysfunctional
-protein
-collagen
-lipoprotein
↑Diabetic Complication
Intracellular hyperglycemia induces overproduction of superoxide, a ROS, at the
mitochondrial level as a possible cause of the metabolic memory of hyperglycemic stress
after glucose normalization.
Ceriello A et al. JCEM 2009;94:410-415
©2009 by Endocrine Society
NEJM 2008; 359:1565-76
BMJ 1998;307: 703-13
Median duration of follow-
up was 8.4 yrs.
Tight vs conventional:
143/82 vs 154/88
mmHg
DM related
events ↓ 24%
DM related
death ↓ 32%
Microvascular
↓ 37%
Stroke
↓ 44%
Possible role of suboptimal BP lowering
 Although prospective studies have showed that
small reductions in BP reduce the CV events, the
BP target of <150/85 mmHg considered for the
‘’tight BP control’’ was by far above the current BP
target of <130/80 in all major guideline.
 Subsequent studies have assess the benefit
associated with lower BP targets, however, no
extended follow-up was conducted in any of them. (
Influence of previous history of diabetes and delayed
start of antihypertensive treatment
 The HDS started 10 years after the original study.
Therefore, the p’t in the HDS were not actually newly
diagnosed.
 During these 10 yrs, additional irreversible organ
damage has likely developed, leading to a higher level
of CV risk.
 A recent systemic review comparing the reductions in
CV events, including p’t with different baseline of CV
risk, showed that the duration of disease with regard to
time treatment started may influence outcome. Once
organ damage is advanced, a high incidence of CV
events persisted despite intensive BP lowing ( ‘’ ceiling
effect’’) . Finally, the importance of an early start of tx
to optimize p’t protection was suggested.
Factorial design of the study and impossibility to
control for the effects of background interventions
 When posttrial follow-up started, the median value
of HbA1C at baseline was significantly higher in the
tight control group than in the less tight control
group. ( 8.3% vs 7.5%).
 Because the data from the main study and from
HDS were analyzed independently following a
factorial design, it was not possible to control for
the effect of potential confounders, such as
glycemic level.
Use of older less efficacious antihypertensive agents
with adverse effects on glucose homeostasis
 61% of p’ts in the tight control group were on 2 or
more antihypertensive agents (compared with 36%
in the less tight control group), a greater use of
thiazide diuretics in tight control group could not be
ruled out. Thus, it’s likely that the adverse
metabolic effects reported for both atenolol and
thiazide diuretics developed, as further suggested
by the significant increases in mean glucose levels
(1.0 vs 0.7 mmlo/L) and in body weight (2.3 vs
0.5kg).
Role of a shorter median time of randomized
interventions in HDS
 The randomized antihypertensive intervention in
the HDS was only conducted during a median of 4
years.
 Although this was enough for benefits in CV
outcomes in the short term, it was probably not
long enough for tight BP control for confer a
protecting legacy effect.
Small differences in BP between tight and less tight
BP control
 The difference between mean BP levels achieved
over the 4 years of the randomized intervention for
the tight and less tight BP control was relatively
small ( 143/82 vs 154/88 mmHg), and this might
have contributed to the lack of differences.
Absence of BP legacy or only a time-to-effect
relationship between BP control and CV outcome?
 BP reduction, per se, is the main determinant of
the prognostic benefit of antihypertensive tx. Most
trials in hypertension have shown the occurrence
of a short time-to-effect relationship between BP
control and the improved in CV outcome. (table)
 A comprehensive review of 14 randomized trials on
antihypertensive drugs concluded that the
reductions in stroke and CHD appear rapidly after
starting treatment. (51)
 In VALUE trail, reaching BP control by the 6th month
was associated with significant benefits. It also
showed that the BP response predicted events and
survival already after only 1 month of active
treatment. ( Most studies have confirmed that
benefits of antihypertensive tx usually appear in
the short term. The effectiveness of tight BP
control was first shown by the HOT trail. After a
mean of 3.8 yrs of f/u, subgroup analysis showed
that T2D p’t randomized to a target DBP <=80 had
a significant reduction of 51% when compared with
the target of <=90 mmHg.
 The HOPE study embedded the MICRO-HOPE
substudy, which investigated the effects of the
addition of an ACEI (10mg/d Ramipril) to the
current medical regimen. After a median of 4.5 yrs
of f/u, a significant reduction of 25% in primary
outcomes was reported, with significant reduction
in the risk of MI by 22%, of stroke by 33%, and of
CV death by 37%.
 The ADVANCE study also assessed the effects of
ACEI/diurectics. After a mean 4.3 yrs of f/u, the
relative risk was significant reduced by 9% for
macro and microvascular events. These modest
reductions are easily explained by the fact that the
difference in BP between the two groups was small.
(5.6 and 2.2 mmHg for SBP and DBP).
 Thus, there are unequivocal evidence that in both
hypertensive p’t with and without DM, benefits of
anti-HTN tx on major CV outcomes usually appear
shortly after treatment implementation. On the
other hand, with regard to the long-term effects of
an initial tx, the evidence is rather limited.
 Strong data in favor of long-term benefits of an
early start of anti-HTN tx come from the Syst-Eur
study.
 In Syst-Eur study, elderly p’t with isolated systolic HTN
after 2 yrs of randomized tx with nitrendipinde or
placebo were invited. After 4 yrs of f/u ( 6yrs after
randomization), p’t with early anti-HTN tx had a
significantly greater reduction in the risk of stroke (28%),
CV complications (15%), and total mortality (13%).
 In the 492 DM p’t, the additional benefits were even
more pronounced , with significant reductions in the risk
of above mentioned by 60%, 51%, and 38%. (55)
 These results are in clear contrast with results of the
UKPDS-HDS. Thus, it is likely that the putative absence
of a legacy effect was a result of several limitations of
this study, and it dose not reflect a real lack of long-term
benefit of early BP lowering in diabetes.
Conclusion
 The observations in the UKPDS-HDS might indeed
seem to demonstrate the absence of a legacy effect.
However, these results need to be interpreted with
caution.
 Other factors may contribute to explain the observed
loss of CV benefits, and the most important of them
is likely to be a delayed start of tx, leading to an
increased basal risk of CV events.
 Rather than focus on the possible lack of BP legacy,
the interpretation should emphasize the
unquestionable finding that CV protection is more
likely to be effectively achieved if tight BP control is
implemented early and sustained over time.
 A recent critical analysis of several hypertension
trials showed that the longer the disease duration
before starting anti-HTN tx, the smaller the benefits
in terms of CV risk reduction and the larger the
residual risk remaining, even if optimal preventive
measures are taken. (39)
 Therefore, an adequate anti-HTN tx, possibly early in
the course of the disease, remains a cornerstone in
the modern approach to diabetes management.
Thank you for your attention

ueda2012 metabolic memory-d.mgahed

  • 2.
    The “Metabolic Memory”is more than just tight Glucose Control Legacy effect of Diabetes Treatment By Megahed AbuElmagd Head of Diabetes and Endocrinology Unite Mansoura 2012
  • 3.
    Definition The concept ofa “Metabolic Memory” that is of diabetic vascular Stresses persisting after glucose normalization, has been supported both in the laboratory and in the clinic and in both Type1 and Type2 diabetes.
  • 4.
  • 5.
    *P=0.04 Summary: Glucose Loweringon CVD in Type 2 Diabetes VADT ACCORD ADVANCE Primary outcome Non-fatal MI Non-fatal stroke CVD death Hospitalization for CHF Revascularization Non-fatal MI Non-fatal stroke CVD death Non-fatal MI Non-fatal stroke CVD death Hazard Ratio for primary outcome (95% CI) 0.87 (0.73 – 1.04) 0.90 (0.78 – 1.04) 0.94 (0.84 – 1.06) Hazard Ratio for mortality (95% CI) 1.07 (0.80 – 1.42) 1.22 (1.01 – 1.46)* 0.93 (0.83 – 1.06)
  • 6.
    ACCORD Treatment Effecton Primary Outcome 25 0 20 15 10 5 0 1 2 3 4 5 Standard therapy Intensive therapy Patientswithevents% Time (yrs) HR=0.90 (0.78- 1.04), P=0.16 2.29%/yr 2.11%/yr ACCORD Study Group N Engl J Med 358:2545-59; 2008 6
  • 7.
    Protocol Defined NEvents Interaction P-value Subgroups Overall 10251 723 Primary Prevention 6643 330 0.04 Secondary Prevention 3608 393 Women 3952 212 0.74 Men 6299 511 Baseline Age<65 6779 383 0.65 Baseline Age≥65 3472 340 Baseline A1C≤8.0 4868 284 0.03 Baseline A1C>8.0 5360 438 Non-White 3647 222 0.29 White 6604 501 ACCORD: Hazard Ratios for Primary Outcome by Subgroup 0. 6 1. 0 1. 4HR (Intensive vs. ACCORD Study Group N Engl J Med 358:2545-59;2008.
  • 8.
    A1C(%) YearDCCT 11 10 9 8 7 6 0 91 2 34 5 6 7 8 1 2 3 4 5 6 7DCCT end EDIC Conventional group encouraged to switch to intensive treatment Adapted from: N Engl J Med 329:977–86,1993; EDIC: JAMA 287: 2563–9;2002 A1C During DCCT and Follow-Up Intensive Conventional
  • 9.
    Cumulative Incidence ofthe First of Any Predefined CVD Outcomes Years since entry Cumulati ve incidence of any CVD outcome Conventional treatment Intensive treatment 0.00 0.02 0.04 0.06 0.08 0.10 0.12 0 1 2 3 4 5 6 7 8 9 10 11 12 13 14 15 16 17 18 19 20 21 Risk reduction 42%, CI - 9,63 Log-rank p = 0.016 nonfatal MI, stoke, death from cardiovascular disease, confirmed angina, or the need for coronary-artery revascularization Fatal MI, CVA, or CVD death ↓57%DCCT/EDIC Study Research Group, N Engl J Med 2005; 353:2643-53.
  • 10.
    After median 8.8years post-trial follow-up Aggregate Endpoint 1997 2007 Any diabetes related endpoint RRR: 12% 9% P: 0.029 0.040 Microvascular disease RRR: 25% 24% P: 0.009 0.001 Myocardial infarction RRR: 16% 15% P: 0.052 0.014 All-cause mortality RRR: 6% 13% P: 0.44 0.007 UKPDS: “Legacy Effect” of Insulin/Sulfonylurea Therapy RRR = Relative Risk Reduction P = Log Rank Holman RR, et al. New England Journal of Medicine 2008; 359:1577-1589
  • 11.
    11 • Lowering A1Cto below or around 7% has been shown to reduce microvascular and neuropathic complications of type 1 and type 2 diabetes. Therefore, for microvascular disease prevention, the A1C goal for non-pregnant adults in general is <7%. (A) ADA – AHA – ACC Revised Glycemic Control Recommendations ADA/AHA/ACC. Diabetes Care. 2009; 32:187-92.
  • 12.
    12 ADA – AHA– ACC Revised Glycemic Control Recommendations • In type 1 and type 2 diabetes, randomized controlled trials of intensive vs. standard glycemic control have not shown a significant reduction in CVD outcomes during the randomized portion of the trials. Long-term follow-up of the DCCT and UKPDS cohorts suggests that treatment to A1C targets below or around 7% in the years soon after the diagnosis of diabetes is associated with long-term reduction in risk of macrovascular disease. Until more evidence becomes available, the general goal of <7% appears reasonable for many adults for macrovascular risk reduction. (B) ADA/AHA/ACC. Diabetes Care. 2009; 32:187-92.
  • 13.
    13 • Subgroup analysesof clinical trials such as the DCCT and UKPDS, and the microvascular evidence from the ADVANCE trial, suggest a small but incremental benefit in microvascular outcomes with A1C values closer to normal. Therefore, for selected individual patients, providers might reasonably suggest even lower A1C goals than the general goal of <7%, if this can be achieved without significant hypoglycemia or other adverse effects of treatment. Such patients might include those with short duration of diabetes, long life expectancy, and no significant cardiovascular disease. (B) ADA – AHA – ACC Revised Glycemic Control Recommendations ADA/AHA/ACC. Diabetes Care. 2009; 32:187-92.
  • 14.
    14 • Conversely, lessstringent A1C goals than the general goal of <7% may be appropriate for patients with a history of severe hypoglycemia, limited life expectancy, advanced microvascular or macrovascular complications, extensive comorbid conditions, and those with longstanding diabetes in whom the general goal is difficult to attain despite diabetes self- management education, appropriate glucose monitoring, and effective doses of multiple glucose lowering agents including insulin. (C) ADA – AHA – ACC Revised Glycemic Control Recommendations ADA/AHA/ACC. Diabetes Care. 2009; 32:187-92.
  • 15.
    Risk of Deathover a Range of Average A1c Average A1c % Adjusted log(Hazard Ratio) by Treatment Strategy Relative to Standard at A1c of 6% Standard strategy 6 8 97 Steady increase of risk from 6 to 9% A1c with intensive strategy Excess risk with intensive strategy vs standard occurred above A1c 7% Intensive strategy
  • 16.
    Rates of DeathDuring 3.4 Years of Treatment over a Range of 1-year Change of A1c A1c decline from baseline over 12 months (%) 0.0 0.5 1.0 1.5 2.0 Intensive strategy Standard strategy Deathratesperyear Excess risk with intensive strategy vs standard occurred when intensive participants failed to reduce A1c in year 1 Adjusted Mortality Rates by Treatment Strategy
  • 17.
    A potential linkbetween oxidative stress and Metabolic Memory Hyperglycemia Excess Superoxide anion (O2 -) Diabetic Complication ↑ Polyol Pathways ↑ AGE ↑ PKC ↑ Hexosamine pathways
  • 18.
    High Glucose Uncoupledor dysfunction ETC Electrons Transferred to molecules like oxygen Superoxide Interact with mitochondrial proteins H2O2 and (ONOO-) peroxynitrites Damage macromoleculs in other parts of the cells Cross mitochondrial membrane
  • 19.
    High Glucose Mt DNA (OpenConformation) More susceptible to damage
  • 20.
    DCCT AGE Intensive treatment wasassociated with significant lower levels of AGES Skin biopsy ((1yr before the close of the trial Furthermore the 10yrs incidence of retinopathy and nephropathy EDIC Significantly lower in the intensive arm with also significant ↓ AGES
  • 21.
    Oxidative Stress No Bioavailability Hyperglycemia ↑AGES Interfere with RAGENFKB Dysfunctional -protein -collagen -lipoprotein ↑Diabetic Complication
  • 22.
    Intracellular hyperglycemia inducesoverproduction of superoxide, a ROS, at the mitochondrial level as a possible cause of the metabolic memory of hyperglycemic stress after glucose normalization. Ceriello A et al. JCEM 2009;94:410-415 ©2009 by Endocrine Society
  • 24.
  • 26.
    Median duration offollow- up was 8.4 yrs. Tight vs conventional: 143/82 vs 154/88 mmHg
  • 27.
    DM related events ↓24% DM related death ↓ 32% Microvascular ↓ 37% Stroke ↓ 44%
  • 29.
    Possible role ofsuboptimal BP lowering  Although prospective studies have showed that small reductions in BP reduce the CV events, the BP target of <150/85 mmHg considered for the ‘’tight BP control’’ was by far above the current BP target of <130/80 in all major guideline.  Subsequent studies have assess the benefit associated with lower BP targets, however, no extended follow-up was conducted in any of them. (
  • 30.
    Influence of previoushistory of diabetes and delayed start of antihypertensive treatment  The HDS started 10 years after the original study. Therefore, the p’t in the HDS were not actually newly diagnosed.  During these 10 yrs, additional irreversible organ damage has likely developed, leading to a higher level of CV risk.  A recent systemic review comparing the reductions in CV events, including p’t with different baseline of CV risk, showed that the duration of disease with regard to time treatment started may influence outcome. Once organ damage is advanced, a high incidence of CV events persisted despite intensive BP lowing ( ‘’ ceiling effect’’) . Finally, the importance of an early start of tx to optimize p’t protection was suggested.
  • 31.
    Factorial design ofthe study and impossibility to control for the effects of background interventions  When posttrial follow-up started, the median value of HbA1C at baseline was significantly higher in the tight control group than in the less tight control group. ( 8.3% vs 7.5%).  Because the data from the main study and from HDS were analyzed independently following a factorial design, it was not possible to control for the effect of potential confounders, such as glycemic level.
  • 32.
    Use of olderless efficacious antihypertensive agents with adverse effects on glucose homeostasis  61% of p’ts in the tight control group were on 2 or more antihypertensive agents (compared with 36% in the less tight control group), a greater use of thiazide diuretics in tight control group could not be ruled out. Thus, it’s likely that the adverse metabolic effects reported for both atenolol and thiazide diuretics developed, as further suggested by the significant increases in mean glucose levels (1.0 vs 0.7 mmlo/L) and in body weight (2.3 vs 0.5kg).
  • 33.
    Role of ashorter median time of randomized interventions in HDS  The randomized antihypertensive intervention in the HDS was only conducted during a median of 4 years.  Although this was enough for benefits in CV outcomes in the short term, it was probably not long enough for tight BP control for confer a protecting legacy effect.
  • 34.
    Small differences inBP between tight and less tight BP control  The difference between mean BP levels achieved over the 4 years of the randomized intervention for the tight and less tight BP control was relatively small ( 143/82 vs 154/88 mmHg), and this might have contributed to the lack of differences.
  • 35.
    Absence of BPlegacy or only a time-to-effect relationship between BP control and CV outcome?  BP reduction, per se, is the main determinant of the prognostic benefit of antihypertensive tx. Most trials in hypertension have shown the occurrence of a short time-to-effect relationship between BP control and the improved in CV outcome. (table)  A comprehensive review of 14 randomized trials on antihypertensive drugs concluded that the reductions in stroke and CHD appear rapidly after starting treatment. (51)
  • 36.
     In VALUEtrail, reaching BP control by the 6th month was associated with significant benefits. It also showed that the BP response predicted events and survival already after only 1 month of active treatment. ( Most studies have confirmed that benefits of antihypertensive tx usually appear in the short term. The effectiveness of tight BP control was first shown by the HOT trail. After a mean of 3.8 yrs of f/u, subgroup analysis showed that T2D p’t randomized to a target DBP <=80 had a significant reduction of 51% when compared with the target of <=90 mmHg.
  • 37.
     The HOPEstudy embedded the MICRO-HOPE substudy, which investigated the effects of the addition of an ACEI (10mg/d Ramipril) to the current medical regimen. After a median of 4.5 yrs of f/u, a significant reduction of 25% in primary outcomes was reported, with significant reduction in the risk of MI by 22%, of stroke by 33%, and of CV death by 37%.  The ADVANCE study also assessed the effects of ACEI/diurectics. After a mean 4.3 yrs of f/u, the relative risk was significant reduced by 9% for macro and microvascular events. These modest reductions are easily explained by the fact that the difference in BP between the two groups was small. (5.6 and 2.2 mmHg for SBP and DBP).
  • 38.
     Thus, thereare unequivocal evidence that in both hypertensive p’t with and without DM, benefits of anti-HTN tx on major CV outcomes usually appear shortly after treatment implementation. On the other hand, with regard to the long-term effects of an initial tx, the evidence is rather limited.  Strong data in favor of long-term benefits of an early start of anti-HTN tx come from the Syst-Eur study.
  • 39.
     In Syst-Eurstudy, elderly p’t with isolated systolic HTN after 2 yrs of randomized tx with nitrendipinde or placebo were invited. After 4 yrs of f/u ( 6yrs after randomization), p’t with early anti-HTN tx had a significantly greater reduction in the risk of stroke (28%), CV complications (15%), and total mortality (13%).  In the 492 DM p’t, the additional benefits were even more pronounced , with significant reductions in the risk of above mentioned by 60%, 51%, and 38%. (55)  These results are in clear contrast with results of the UKPDS-HDS. Thus, it is likely that the putative absence of a legacy effect was a result of several limitations of this study, and it dose not reflect a real lack of long-term benefit of early BP lowering in diabetes.
  • 40.
    Conclusion  The observationsin the UKPDS-HDS might indeed seem to demonstrate the absence of a legacy effect. However, these results need to be interpreted with caution.  Other factors may contribute to explain the observed loss of CV benefits, and the most important of them is likely to be a delayed start of tx, leading to an increased basal risk of CV events.  Rather than focus on the possible lack of BP legacy, the interpretation should emphasize the unquestionable finding that CV protection is more likely to be effectively achieved if tight BP control is implemented early and sustained over time.
  • 41.
     A recentcritical analysis of several hypertension trials showed that the longer the disease duration before starting anti-HTN tx, the smaller the benefits in terms of CV risk reduction and the larger the residual risk remaining, even if optimal preventive measures are taken. (39)  Therefore, an adequate anti-HTN tx, possibly early in the course of the disease, remains a cornerstone in the modern approach to diabetes management.
  • 42.
    Thank you foryour attention