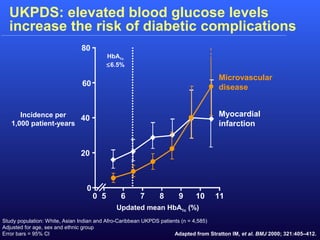
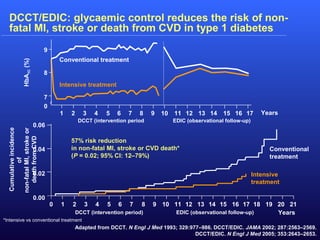
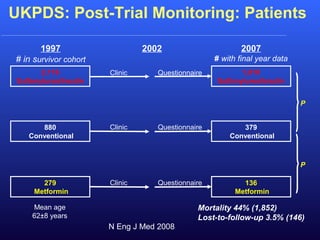
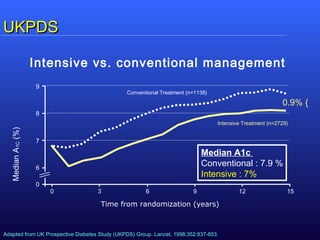
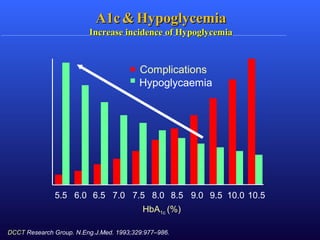
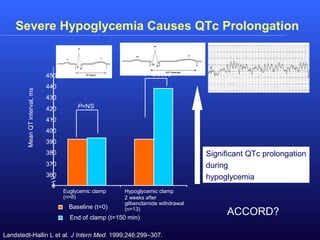
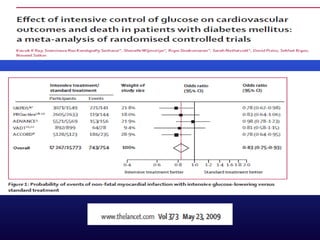
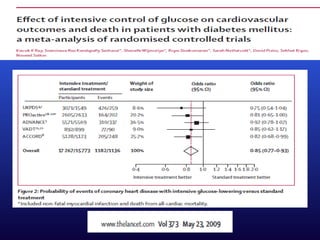
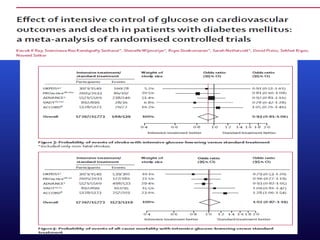
Does Tight Glycemic Control
Improve CV Diabetic Complications?
Khalifa Abdallah
Prof. of Internal Medicine
Diabetes, Metabolism & Lipidology Unit
Alexandria Faculty of Medicine
No
UKPDS: elevated blood glucose levels
increase the risk of diabetic complications
Study population: White, Asian Indian and Afro-Caribbean UKPDS patients (n = 4,585)
Adjusted for age, sex and ethnic group
Error bars = 95% CI Adapted from Stratton IM, et al. BMJ 2000; 321:405–412.
20
40
60
80
Incidence per
1,000 patient-years
5 6 7 8 9 10 11
Myocardial
infarction
Microvascular
disease
Updated mean HbA1c (%)
0
0
HbA1c
≤6.5%
Intensive vs. conventional management
Time from randomization (years)
MedianA1C(%)
Conventional Treatment (n=1138)
Intensive Treatment (n=2729)
9
8
7
6
0
0 3 6 9 12 15
{0.9%
Adapted from UK Prospective Diabetes Study (UKPDS) Group. Lancet. 1998;352:837-853.
UKPDSUKPDS
NS = not significant; PVD = peripheral vascular disease.
*Per 1000 patient-years.
**Combined microvascular and macrovascular events.
Adapted from United Kingdom Prospective Diabetes Study Group (UKPDS) Lancet 1998;352:837-853.
Intensive Glucose Control Significantly
Reduced Microvascular Disease
Rate*
Conventional Intensive
glucose glucose
control control % Risk
(n=2729) (n=1138) reduction p
Macrovascular events
• MI 17.4 14.7 16
0.052
• Stroke 5.0 5.6 –11
NS
• PVD 1.6 1.1 35
NS
• Diabetes-related death 11.5 10.4 10
NS
• All-cause mortality 18.9 17.9 6
NS
Microvascular events 11.4 8.6 25
0.0099
All events** 46.0 40.9 12
0.029
57% risk reduction
in non-fatal MI, stroke or CVD death*
(P = 0.02; 95% CI: 12–79%)
Cumulativeincidence
of
non-fatalMI,strokeor
deathfromCVD
Conventional
treatment
Intensive
treatment
0 1 2 3 4 5 6 7 8 9 10 11 12 13 14 15 16 17 18 19 20 21
Years
0.06
0.04
0.02
0.00
Adapted from DCCT. N Engl J Med 1993; 329:977–986. DCCT/EDIC. JAMA 2002; 287:2563–2569.
DCCT/EDIC. N Engl J Med 2005; 353:2643–2653.
DCCT/EDIC: glycaemic control reduces the risk of non-
fatal MI, stroke or death from CVD in type 1 diabetes
0
7
1 6
HbA1C(%)
9
8
2 3 4 5 7 8 9
Conventional treatment
Intensive treatment
11 12 13 14 15 16 1710
*Intensive vs conventional treatment
DCCT (intervention period EDIC (observational follow-up)
DCCT (intervention period) EDIC (observational follow-up)
Years
A1c Reduction With Intensive &
Conventional Management
0 2 4 6 8 10
Years from randomization
5 731 9
8
9
10
7
HbA1c(%)
6
0
Intensive
Conventional
DCCT Research Group. N.Eng.J.Med. 1993;329:977–986.
9.1%
7.2%
UKPDS: Post-Trial Changes in HbA1c
UKPDS results
presented
Mean (95%CI)
UKPDS 80. N Eng J Med 2008; 359
After median 8.5 years post-trial follow-up
Aggregate Endpoint 1997 2007
Any diabetes related endpoint RRR: 12% 9%
P: 0.029 0.040
Microvascular disease RRR: 25% 24%
P: 0.0099 0.001
Myocardial infarction RRR: 16% 15%
P: 0.052 0.014
All-cause mortality RRR: 6% 13%
P: 0.44 0.007
RRR = Relative Risk Reduction, P = Log Rank
UKPDS: Legacy Effect of Earlier Glucose
Control
N Eng J Med 2008
UKPDS: Post-Trial Monitoring: Patients
880
Conventional
2,118
Sulfonylurea/Insulin
279
Metformin
1997
# in survivor cohort
2002
Clinic
Clinic
Clinic
Questionnaire
Questionnaire
Questionnaire
2007
# with final year data
379
Conventional
1,010
Sulfonylurea/Insulin
136
Metformin
P
P
Mortality 44% (1,852)
Lost-to-follow-up 3.5% (146)
Mean age
62±8 years
N Eng J Med 2008
Intensive vs. conventional management
Time from randomization (years)
MedianA1C(%)
Conventional Treatment (n=1138)
Intensive Treatment (n=2729)
9
8
7
6
0
0 3 6 9 12 15
{0.9%
Adapted from UK Prospective Diabetes Study (UKPDS) Group. Lancet. 1998;352:837-853.
UKPDSUKPDS
Median A1c
Conventional : 7.9 %
Intensive : 7%
Key insights from the latest
randomised trials
ACCORD ADVANCE and VADT- No SignificantACCORD ADVANCE and VADT- No Significant
Effect on Macro or Micro Vascular OutcomesEffect on Macro or Micro Vascular Outcomes
ACCORDACCORD ADVANCEADVANCE VADTVADT
No. of participantsNo. of participants 10,25110,251 11,14011,140 17911791
Participant age ,yearsParticipant age ,years 6262 6666 6060
Duration of diabetes atDuration of diabetes at
study entry, yearsstudy entry, years
1010 88 11.511.5
HbA1C at Baseline, %HbA1C at Baseline, % 8.18.1 7.57.5 9.49.4
Participants with priorParticipants with prior
cardiovascular event, %cardiovascular event, %
3535 3232 4040
Duration of follow-up,Duration of follow-up,
yearsyears
3.43.4 5.05.0 66
Summary of ACCORD, ADVANCE and VADTSummary of ACCORD, ADVANCE and VADT
ACCORDACCORD ADVANCEADVANCE VADTVADT
No. of participantsNo. of participants 10,25110,251 11,14011,140 17911791
Participant age ,yearsParticipant age ,years 6262 6666 6060
HbA1C at Baseline, %HbA1C at Baseline, % 8.18.1 7.57.5 9.49.4
Significant Effect onSignificant Effect on
MacrovascularMacrovascular
Outcomes?Outcomes?
NoNo NoNo NoNo
Significant Effect onSignificant Effect on
MicrovascularMicrovascular
Outcomes?Outcomes?
NANA Significant forSignificant for
nephropathy, notnephropathy, not
retinopathyretinopathy
NoNo
Rosiglitazone use,Rosiglitazone use,
(intensive vs. standard)(intensive vs. standard)
90% vs. 58%90% vs. 58% 17% vs. 11%17% vs. 11% 85% vs.85% vs.
78%78%
Duration of follow-up,Duration of follow-up,
yearsyears
3.43.4 5.05.0 66
Summary of ACCORD, ADVANCE and VADTSummary of ACCORD, ADVANCE and VADT
ACCORDACCORD ADVANCEADVANCE VADTVADT
No. of participantsNo. of participants 10,25110,251 11,14011,140 17911791
Participant age ,yearsParticipant age ,years 6262 6666 6060
HbA1C at Baseline, %HbA1C at Baseline, % 8.18.1 7.57.5 9.49.4
Significant Effect onSignificant Effect on
MicrovascularMicrovascular
Outcomes?Outcomes?
NANA Significant forSignificant for
nephropathy, notnephropathy, not
retinopathyretinopathy
NoNo
Rosiglitazone use,Rosiglitazone use,
(intensive vs. standard)(intensive vs. standard)
90% vs. 58%90% vs. 58% 17% vs. 11%17% vs. 11% 85% vs.85% vs.
78%78%
Duration of follow-up,Duration of follow-up,
yearsyears
3.43.4 5.05.0 66
Significant Effect onSignificant Effect on
MacrovascularMacrovascular
OutcomesOutcomes??
No No No
Summary of ACCORD, ADVANCE and VADTSummary of ACCORD, ADVANCE and VADT
Incidence of Severe Hypoglycemia (%)Incidence of Severe Hypoglycemia (%)
ACCORDACCORD ADVANCEADVANCE VADTVADT
Intensive armIntensive arm 16.216.2 2.72.7 21.221.2
Standard armStandard arm 5.15.1 1.51.5 9.99.9
A1cA1c && HypoglycemiaHypoglycemia
Increase incidence of HypoglycemiaIncrease incidence of Hypoglycemia
HbA1c (%)
5.5 6.0 6.5 7.0 7.5 8.0 8.5 9.0 9.5 10.0
Complications
Hypoglycaemia
10.5
DCCT Research Group. N.Eng.J.Med. 1993;329:977–986.
Asymptomatic Episodes of Hypoglycemia May Go
Unreported
• In a cohort of patients
with diabetes, more than
50% had asymptomatic
(unrecognized)
hypoglycemia, as
identified by continuous
glucose monitoring1
• Other researchers have
reported similar findings2,3
1. Copyright © 2003 American Diabetes Association. Chico A et al. Diabetes Care. 2003;26(4):1153–1157.
Reprinted with permission from the American Diabetes Association.
2. Weber KK et al. Exp Clin Endocrinol Diabetes. 2007;115(8):491–494.
3. Zick R et al. Diab Technol Ther. 2007;9(6):483–492.
0
25
50
75
100
All patients
with diabetes
Type 1
diabetes
Patients,%
Type 2
diabetes
55.7
62.5
46.6
Patients With ≥1 Unrecognized
Hypoglycemic Event, %
n=70 n=40 n=30
Severe Hypoglycemia Causes QTc Prolongation
P=NS
P=0.0003
Landstedt-Hallin L et al. J Intern Med. 1999;246:299–307.
Euglycemic clamp
(n=8)
Hypoglycemic clamp
2 weeks after
glibenclamide withdrawal
(n=13)
0
360
370
380
390
400
410
420
430
440
450
MeanQTinterval,ms
Baseline (t=0)
End of clamp (t=150 min)
ACCORD?
Significant QTc prolongation
during
hypoglycemia
Conclusions
• Although observational trials demonstrated
that the relationship between glycemic control
and CV diabetic complications was log-linear
and extended down to the normal A1c with no
threshold, yet randomized clinical trials failed
to confirm this hypothesis
• There is no solid evidence that tight glycemic
control ( A1c <6.5 %) has clear benefit on
reducing CV outcome in type 2 diabetic
individuals but there is definite evidence that
tight glycemic control increases the risk of
severe hypoglycemia
•Older patients with long standing
diabetes and existing co-morbidities do
not benefit from intensive glycemic
control
•Controlling nonglycemic risk factors
(hypertension, dyslipidemia, obesity, …)
with standard glycemic control (A1c <
7%) is still the recommended strategy to
prevent CV diabetic complications)
Conclusions-Cont.
Thank you

ueda2012 glycemic control cvd debate f-d.khalifa

  • 1.
    Does Tight GlycemicControl Improve CV Diabetic Complications? Khalifa Abdallah Prof. of Internal Medicine Diabetes, Metabolism & Lipidology Unit Alexandria Faculty of Medicine No
  • 2.
    UKPDS: elevated bloodglucose levels increase the risk of diabetic complications Study population: White, Asian Indian and Afro-Caribbean UKPDS patients (n = 4,585) Adjusted for age, sex and ethnic group Error bars = 95% CI Adapted from Stratton IM, et al. BMJ 2000; 321:405–412. 20 40 60 80 Incidence per 1,000 patient-years 5 6 7 8 9 10 11 Myocardial infarction Microvascular disease Updated mean HbA1c (%) 0 0 HbA1c ≤6.5%
  • 3.
    Intensive vs. conventionalmanagement Time from randomization (years) MedianA1C(%) Conventional Treatment (n=1138) Intensive Treatment (n=2729) 9 8 7 6 0 0 3 6 9 12 15 {0.9% Adapted from UK Prospective Diabetes Study (UKPDS) Group. Lancet. 1998;352:837-853. UKPDSUKPDS
  • 4.
    NS = notsignificant; PVD = peripheral vascular disease. *Per 1000 patient-years. **Combined microvascular and macrovascular events. Adapted from United Kingdom Prospective Diabetes Study Group (UKPDS) Lancet 1998;352:837-853. Intensive Glucose Control Significantly Reduced Microvascular Disease Rate* Conventional Intensive glucose glucose control control % Risk (n=2729) (n=1138) reduction p Macrovascular events • MI 17.4 14.7 16 0.052 • Stroke 5.0 5.6 –11 NS • PVD 1.6 1.1 35 NS • Diabetes-related death 11.5 10.4 10 NS • All-cause mortality 18.9 17.9 6 NS Microvascular events 11.4 8.6 25 0.0099 All events** 46.0 40.9 12 0.029
  • 5.
    57% risk reduction innon-fatal MI, stroke or CVD death* (P = 0.02; 95% CI: 12–79%) Cumulativeincidence of non-fatalMI,strokeor deathfromCVD Conventional treatment Intensive treatment 0 1 2 3 4 5 6 7 8 9 10 11 12 13 14 15 16 17 18 19 20 21 Years 0.06 0.04 0.02 0.00 Adapted from DCCT. N Engl J Med 1993; 329:977–986. DCCT/EDIC. JAMA 2002; 287:2563–2569. DCCT/EDIC. N Engl J Med 2005; 353:2643–2653. DCCT/EDIC: glycaemic control reduces the risk of non- fatal MI, stroke or death from CVD in type 1 diabetes 0 7 1 6 HbA1C(%) 9 8 2 3 4 5 7 8 9 Conventional treatment Intensive treatment 11 12 13 14 15 16 1710 *Intensive vs conventional treatment DCCT (intervention period EDIC (observational follow-up) DCCT (intervention period) EDIC (observational follow-up) Years
  • 6.
    A1c Reduction WithIntensive & Conventional Management 0 2 4 6 8 10 Years from randomization 5 731 9 8 9 10 7 HbA1c(%) 6 0 Intensive Conventional DCCT Research Group. N.Eng.J.Med. 1993;329:977–986. 9.1% 7.2%
  • 7.
    UKPDS: Post-Trial Changesin HbA1c UKPDS results presented Mean (95%CI) UKPDS 80. N Eng J Med 2008; 359
  • 8.
    After median 8.5years post-trial follow-up Aggregate Endpoint 1997 2007 Any diabetes related endpoint RRR: 12% 9% P: 0.029 0.040 Microvascular disease RRR: 25% 24% P: 0.0099 0.001 Myocardial infarction RRR: 16% 15% P: 0.052 0.014 All-cause mortality RRR: 6% 13% P: 0.44 0.007 RRR = Relative Risk Reduction, P = Log Rank UKPDS: Legacy Effect of Earlier Glucose Control N Eng J Med 2008
  • 9.
    UKPDS: Post-Trial Monitoring:Patients 880 Conventional 2,118 Sulfonylurea/Insulin 279 Metformin 1997 # in survivor cohort 2002 Clinic Clinic Clinic Questionnaire Questionnaire Questionnaire 2007 # with final year data 379 Conventional 1,010 Sulfonylurea/Insulin 136 Metformin P P Mortality 44% (1,852) Lost-to-follow-up 3.5% (146) Mean age 62±8 years N Eng J Med 2008
  • 10.
    Intensive vs. conventionalmanagement Time from randomization (years) MedianA1C(%) Conventional Treatment (n=1138) Intensive Treatment (n=2729) 9 8 7 6 0 0 3 6 9 12 15 {0.9% Adapted from UK Prospective Diabetes Study (UKPDS) Group. Lancet. 1998;352:837-853. UKPDSUKPDS Median A1c Conventional : 7.9 % Intensive : 7%
  • 11.
    Key insights fromthe latest randomised trials
  • 12.
    ACCORD ADVANCE andVADT- No SignificantACCORD ADVANCE and VADT- No Significant Effect on Macro or Micro Vascular OutcomesEffect on Macro or Micro Vascular Outcomes ACCORDACCORD ADVANCEADVANCE VADTVADT No. of participantsNo. of participants 10,25110,251 11,14011,140 17911791 Participant age ,yearsParticipant age ,years 6262 6666 6060 Duration of diabetes atDuration of diabetes at study entry, yearsstudy entry, years 1010 88 11.511.5 HbA1C at Baseline, %HbA1C at Baseline, % 8.18.1 7.57.5 9.49.4 Participants with priorParticipants with prior cardiovascular event, %cardiovascular event, % 3535 3232 4040 Duration of follow-up,Duration of follow-up, yearsyears 3.43.4 5.05.0 66
  • 13.
    Summary of ACCORD,ADVANCE and VADTSummary of ACCORD, ADVANCE and VADT ACCORDACCORD ADVANCEADVANCE VADTVADT No. of participantsNo. of participants 10,25110,251 11,14011,140 17911791 Participant age ,yearsParticipant age ,years 6262 6666 6060 HbA1C at Baseline, %HbA1C at Baseline, % 8.18.1 7.57.5 9.49.4 Significant Effect onSignificant Effect on MacrovascularMacrovascular Outcomes?Outcomes? NoNo NoNo NoNo Significant Effect onSignificant Effect on MicrovascularMicrovascular Outcomes?Outcomes? NANA Significant forSignificant for nephropathy, notnephropathy, not retinopathyretinopathy NoNo Rosiglitazone use,Rosiglitazone use, (intensive vs. standard)(intensive vs. standard) 90% vs. 58%90% vs. 58% 17% vs. 11%17% vs. 11% 85% vs.85% vs. 78%78% Duration of follow-up,Duration of follow-up, yearsyears 3.43.4 5.05.0 66
  • 14.
    Summary of ACCORD,ADVANCE and VADTSummary of ACCORD, ADVANCE and VADT ACCORDACCORD ADVANCEADVANCE VADTVADT No. of participantsNo. of participants 10,25110,251 11,14011,140 17911791 Participant age ,yearsParticipant age ,years 6262 6666 6060 HbA1C at Baseline, %HbA1C at Baseline, % 8.18.1 7.57.5 9.49.4 Significant Effect onSignificant Effect on MicrovascularMicrovascular Outcomes?Outcomes? NANA Significant forSignificant for nephropathy, notnephropathy, not retinopathyretinopathy NoNo Rosiglitazone use,Rosiglitazone use, (intensive vs. standard)(intensive vs. standard) 90% vs. 58%90% vs. 58% 17% vs. 11%17% vs. 11% 85% vs.85% vs. 78%78% Duration of follow-up,Duration of follow-up, yearsyears 3.43.4 5.05.0 66 Significant Effect onSignificant Effect on MacrovascularMacrovascular OutcomesOutcomes?? No No No
  • 15.
    Summary of ACCORD,ADVANCE and VADTSummary of ACCORD, ADVANCE and VADT Incidence of Severe Hypoglycemia (%)Incidence of Severe Hypoglycemia (%) ACCORDACCORD ADVANCEADVANCE VADTVADT Intensive armIntensive arm 16.216.2 2.72.7 21.221.2 Standard armStandard arm 5.15.1 1.51.5 9.99.9
  • 16.
    A1cA1c && HypoglycemiaHypoglycemia Increaseincidence of HypoglycemiaIncrease incidence of Hypoglycemia HbA1c (%) 5.5 6.0 6.5 7.0 7.5 8.0 8.5 9.0 9.5 10.0 Complications Hypoglycaemia 10.5 DCCT Research Group. N.Eng.J.Med. 1993;329:977–986.
  • 17.
    Asymptomatic Episodes ofHypoglycemia May Go Unreported • In a cohort of patients with diabetes, more than 50% had asymptomatic (unrecognized) hypoglycemia, as identified by continuous glucose monitoring1 • Other researchers have reported similar findings2,3 1. Copyright © 2003 American Diabetes Association. Chico A et al. Diabetes Care. 2003;26(4):1153–1157. Reprinted with permission from the American Diabetes Association. 2. Weber KK et al. Exp Clin Endocrinol Diabetes. 2007;115(8):491–494. 3. Zick R et al. Diab Technol Ther. 2007;9(6):483–492. 0 25 50 75 100 All patients with diabetes Type 1 diabetes Patients,% Type 2 diabetes 55.7 62.5 46.6 Patients With ≥1 Unrecognized Hypoglycemic Event, % n=70 n=40 n=30
  • 18.
    Severe Hypoglycemia CausesQTc Prolongation P=NS P=0.0003 Landstedt-Hallin L et al. J Intern Med. 1999;246:299–307. Euglycemic clamp (n=8) Hypoglycemic clamp 2 weeks after glibenclamide withdrawal (n=13) 0 360 370 380 390 400 410 420 430 440 450 MeanQTinterval,ms Baseline (t=0) End of clamp (t=150 min) ACCORD? Significant QTc prolongation during hypoglycemia
  • 23.
    Conclusions • Although observationaltrials demonstrated that the relationship between glycemic control and CV diabetic complications was log-linear and extended down to the normal A1c with no threshold, yet randomized clinical trials failed to confirm this hypothesis • There is no solid evidence that tight glycemic control ( A1c <6.5 %) has clear benefit on reducing CV outcome in type 2 diabetic individuals but there is definite evidence that tight glycemic control increases the risk of severe hypoglycemia
  • 24.
    •Older patients withlong standing diabetes and existing co-morbidities do not benefit from intensive glycemic control •Controlling nonglycemic risk factors (hypertension, dyslipidemia, obesity, …) with standard glycemic control (A1c < 7%) is still the recommended strategy to prevent CV diabetic complications) Conclusions-Cont.
  • 25.

Editor's Notes

  • #3 The incidence of myocardial infarction (MI) and clinical complications in type 2 diabetes is significantly associated with glycaemia. The study population included 4,585 participants from the United Kingdom Prospective Diabetes Study (UKPDS), whether randomized or not to treatment. Of these, 3,642 were included in an analysis of relative risk to determine the relation between exposure to glycaemia over time and the risk of macrovascular or microvascular complications. The incidence rates for any endpoint related to diabetes increased with each higher category of updated mean HbA1c. The increase in the incidence rate for microvascular endpoints was greater over the range of increasing glycaemia than was the increase in the incidence rate for MI. Thus, at near normal concentrations of HbA1c, the risk of MI was 2–3 times that of a microvascular endpoint, whereas in the highest category of HbA1c concentration the risks were of the same order. Stratton IM, et al. BMJ 2000; 321:405–412.
  • #4 United Kingdom Prospective Study 33 was the largest study of newly diagnosed type 2 diabetes patients ever undertaken to examine the outcomes of treatment strategies over time More than 4200 patients were eligible for randomisation to receive conventional or intensive treatment for 10 years1 Conventional therapy consisted of dietary advice; in patients who developed marked hyperglycaemia, secondary sulphonylurea or insulin therapy was provided, with the additional option of metformin in overweight patients Intensive therapy consisted of dietary advice, along with sulphonylureas or insulin therapy with once-daily Ultralente insulin or isophane insulin
  • #5 The landmark UKPDS demonstrated that intensive glucose control resulted in significant reductions in microvascular events but had little to no benefit in macrovascular events. Glucose control is generally regarded as the first priority in the treatment of patients with diabetes, and elevated blood glucose is considered an important factor in the increased risk for CVD in these individuals. The relationship between glucose control and cardiovascular risk was studied in the UKPDS.19 As part of the study, the effect of intensive glucose control with either sulfonylurea or insulin on the risk of microvascular and/or macrovascular complications in patients with type 2 diabetes was compared with conventional glucose control. The goal of intensive therapy was to decrease fasting plasma glucose (FPG) to &amp;lt;6 mmol/L. Conventional treatment goal was an FPG of &amp;lt;15 mmol/L without symptoms of hyperglycemia. Newly diagnosed asymptomatic patients with type 2 diabetes (n=3867) were enrolled in the study and followed for 10 years. Median HbA1c values over 10 years were significantly higher in the conventional treatment group than in the intensive treatment group (7.9% vs. 7.0%, p&amp;lt;0.0001). As expected, intensive control of blood glucose with sulfonylurea or insulin was significantly more effective than conventional therapy in reducing the risk of any diabetes-related endpoints (combined microvascular and macrovascular events) by 12% (p=0.029). Intensive therapy also significantly reduced the risk for microvascular events by 25% (p=0.0099) and decreased the risk of MI by 16% (p=0.052). However, intensive control of FPG was no more effective than conventional treatment in reducing mortality due to MI, stroke, or amputation or death from peripheral vascular disease.19 Furthermore, intensive control of blood glucose had no significant impact on diabetes-related death, all-cause mortality, or the incidence of stroke or peripheral vascular disease among patients enrolled in UKPDS.19
  • #6 In DCCT (Diabetes Control and Complications Trial), 1,441 patients with type 1 diabetes were randomized to intensive ( 3 daily insulin injections or insulin pump) or conventional treatment (1–2 daily insulin injections) for a mean follow-up period of 6.5 years. At the end of DCCT, participants receiving conventional treatment were offered intensive treatment. All patients returned to their own healthcare provider for diabetes care. In total, 1,397 patients (96%) from the DCCT were followed in the observational EDIC (Epidemiology of Diabetes Interventions and Complications) study for a mean 17 years of follow-up. As shown in the upper graph, in DCCT the absolute difference in mean HbA1c between the intensive and conventional groups was ~2% (7.4% vs 9.1%; P &amp;lt; 0.01) at 6.5 years, which was sustained during the intervention period. During EDIC, differences in HbA1c narrowed in these groups (8.0% vs and 8.2%, respectively; P = 0.03) at 11 years. As shown in the lower graph, changes in HbA1c associated with intensive treatment were accompanied by a reduction in risk of non-fatal MI, stroke or death. In EDIC, patients who had received intensive treatment in DCCT had reduced the risk of non-fatal myocardial infarction (MI), stroke or death from cardiovascular disease (CVD) by 57% in patients with type 1 diabetes (95% CI, 12–79%; P = 0.02). Intensive treatment also reduced the risk of any CVD event by 42% (95% CI, 9–63%; P = 0.02). There are a number of potential mechanisms by which intensive glycaemic control may reduce CVD risk, including a reduction in HbA1c. DCCT/EDIC. N Engl J Med 2005; 353:2643–2653.
  • #7 In the conventional management group (1–2 insulin injections daily), HbA1c remained relatively constant during the study period with no significant change from baseline (mean HbA1c baseline value 8.9%). HbA1c in the intensive management group (at least 3 insulin injections daily) reached its lowest point in the first 6 months of treatment. Differences in HbA1c between the two management groups were statistically significant from 3 months until the end of the study (p&amp;lt;0.001). Although 44% people receiving intensive management achieved the goal of HbA1c 6.05% at least once, less than 5% of patients maintained an average value in this range. Reference The Diabetes Control and Complications Trial Research Group. The effect of intensive treatment of diabetes on the development and progression of long-term complications in insulin-dependent diabetes mellitus. N Eng J Med. 1993; 329:977–986.
  • #11 United Kingdom Prospective Study 33 was the largest study of newly diagnosed type 2 diabetes patients ever undertaken to examine the outcomes of treatment strategies over time More than 4200 patients were eligible for randomisation to receive conventional or intensive treatment for 10 years1 Conventional therapy consisted of dietary advice; in patients who developed marked hyperglycaemia, secondary sulphonylurea or insulin therapy was provided, with the additional option of metformin in overweight patients Intensive therapy consisted of dietary advice, along with sulphonylureas or insulin therapy with once-daily Ultralente insulin or isophane insulin
  • #18 Asymptomatic Episodes of Hypoglycemia May Go Unreported In clinical studies of continuous glucose monitoring (CGM), episodes of hypoglycemia have been found to go unrecognized.1–3 Chico et al1 used CGM to measure the frequency of unrecognized episodes of hypoglycemia in patients with type 1 (n=40) and type 2 (n=30) diabetes. CGM detected unrecognized hypoglycemic events in 55.7% of all patients. In the subset of patients with type 2 diabetes, CGM detected hypoglycemic events in 46.6% of patients.1 Other researchers have reported similar findings.2,3
  • #19 Severe Hypoglycemia May Cause a Prolongation of QT Interval in Patients With Type 2 Diabetes Severe hypoglycemia may cause prolongation of the QT interval in patients with type 2 diabetes. Landstedt-Hallin et al1 examined the effect of insulin-induced hypoglycemia on cardiac repolarization in 13 patients with type 2 diabetes. All patients had been treated with both insulin and oral glibenclamide for at least 8 months before the start of the study. The patients stopped using oral glibenclamide for 2 weeks but continued with insulin therapy. They were subjected to a first hypoglycemic clamp at the end of these 2 weeks. The patients then resumed combined glibenclamide and insulin therapy, and after 6 to 8 months they participated in a second hypoglycemic clamp. Eight patients were subjected to a third euglycemic clamp study after an additional 3 to 4 months.1 As demonstrated in the graph, the study showed that mean QT intervals and QT dispersion were significantly prolonged after the hypoglycemic clamps. These results showed that hypoglycemia affected repolarization of the mycardium, creating an increased risk of arrhythmias.1