Downloaded 560 times

![Graphical methodGraphical method
26
( )
( ) xxwV
VVxxwV
Fy
∆−=∆
=∆+−∆−
=Σ↑+
0)(
:0
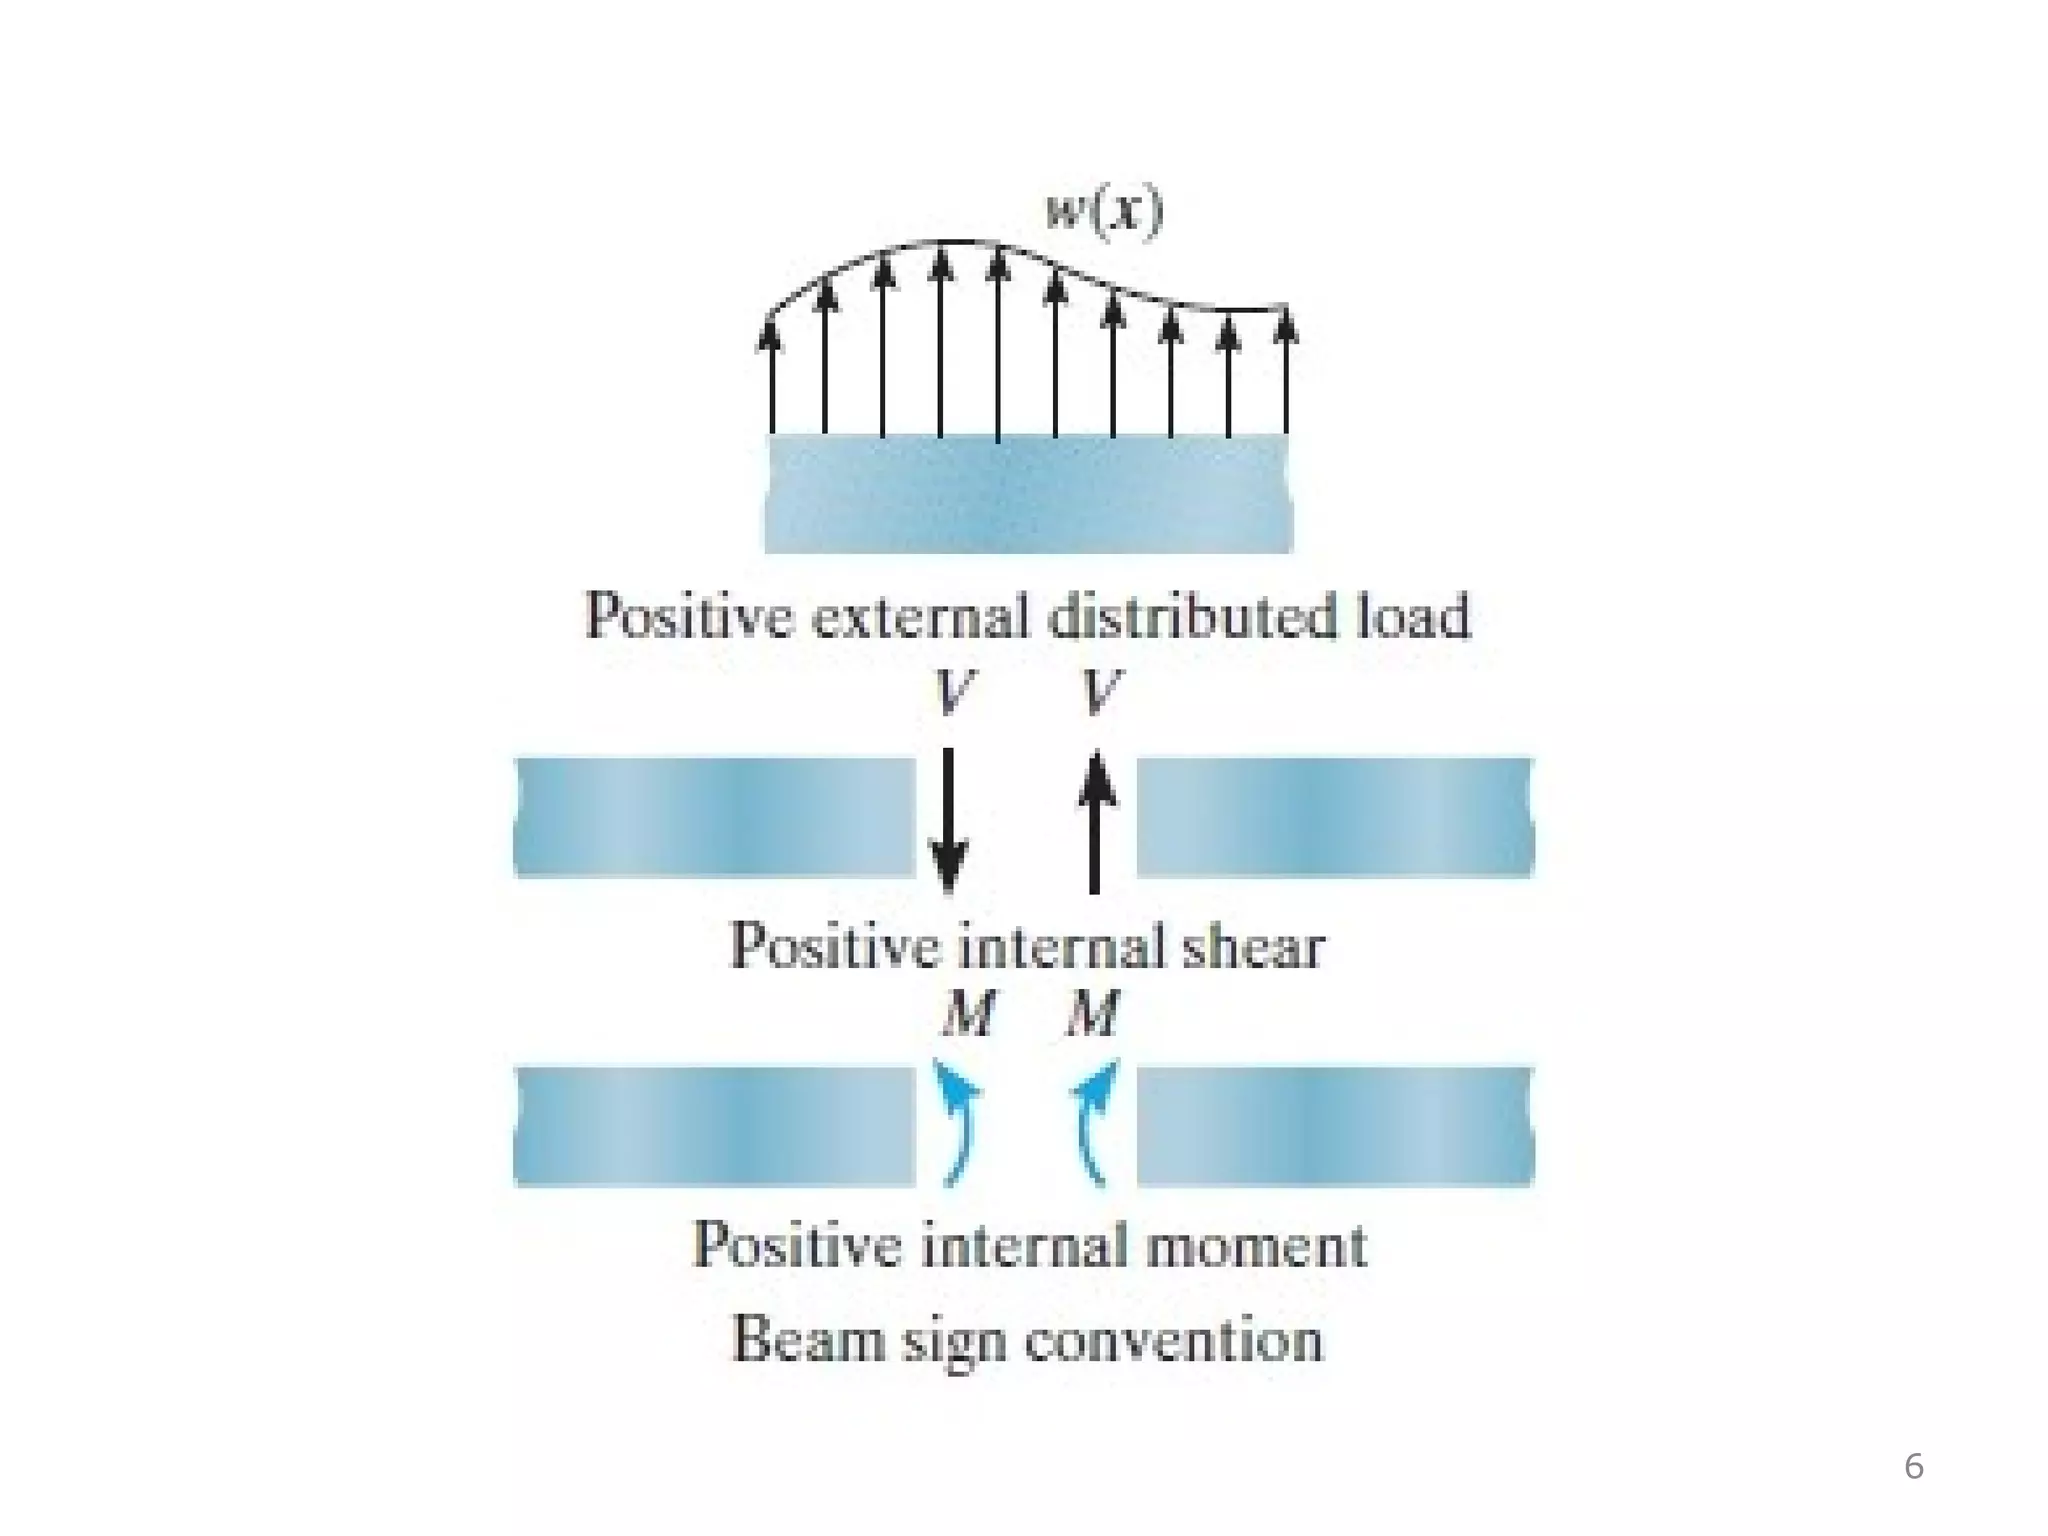
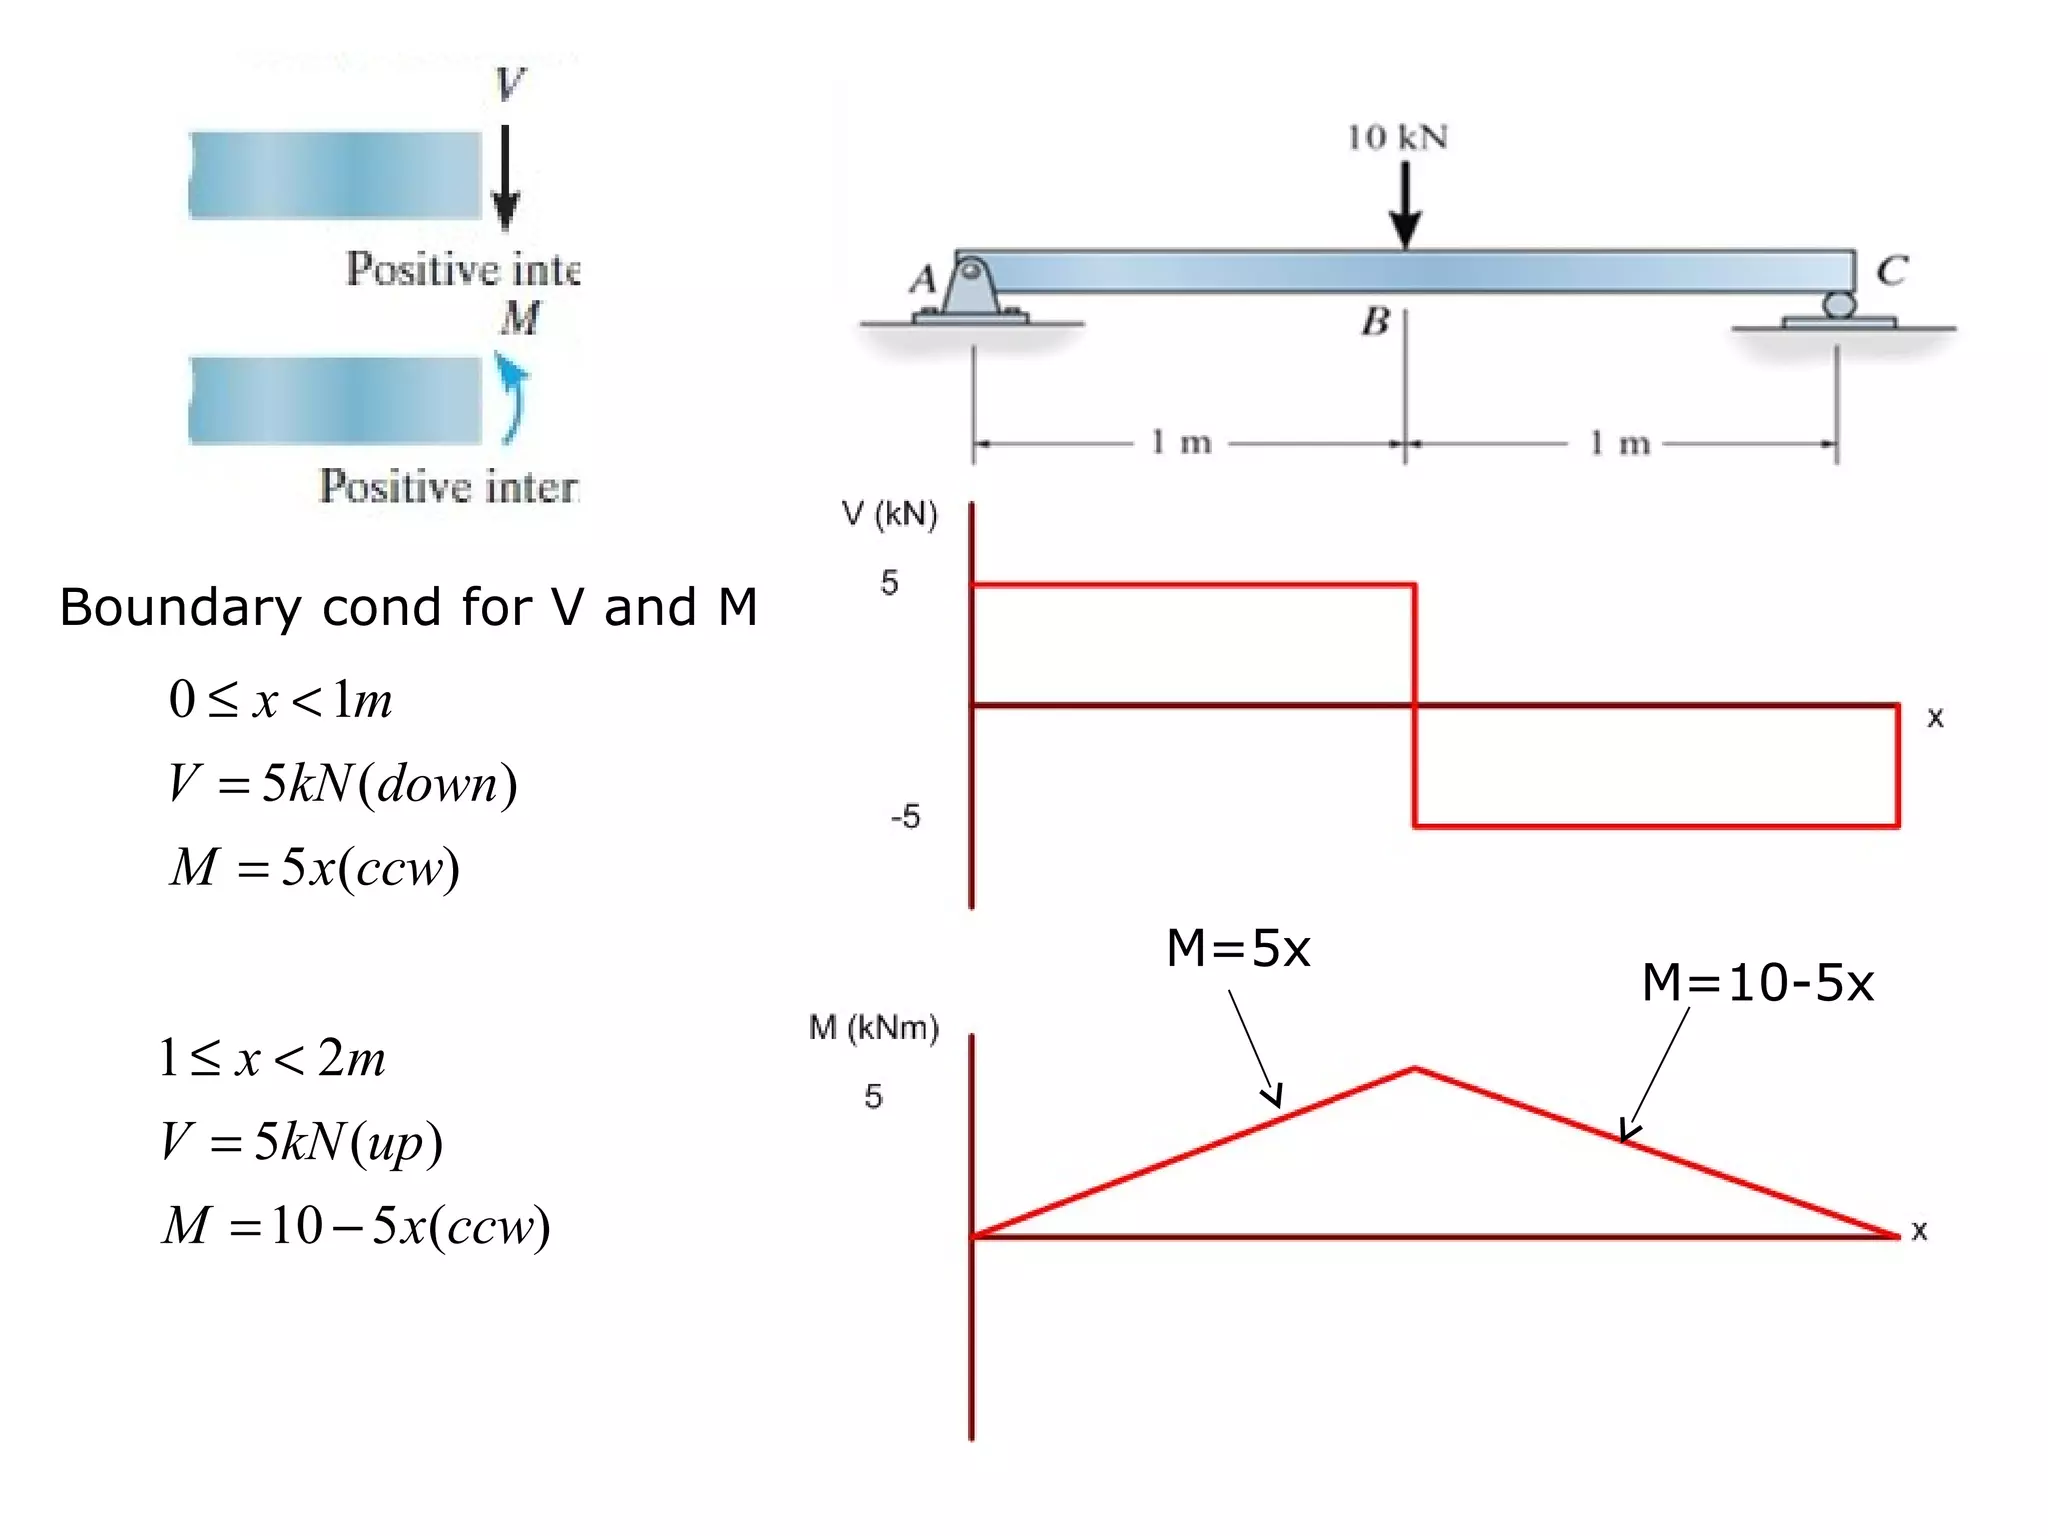
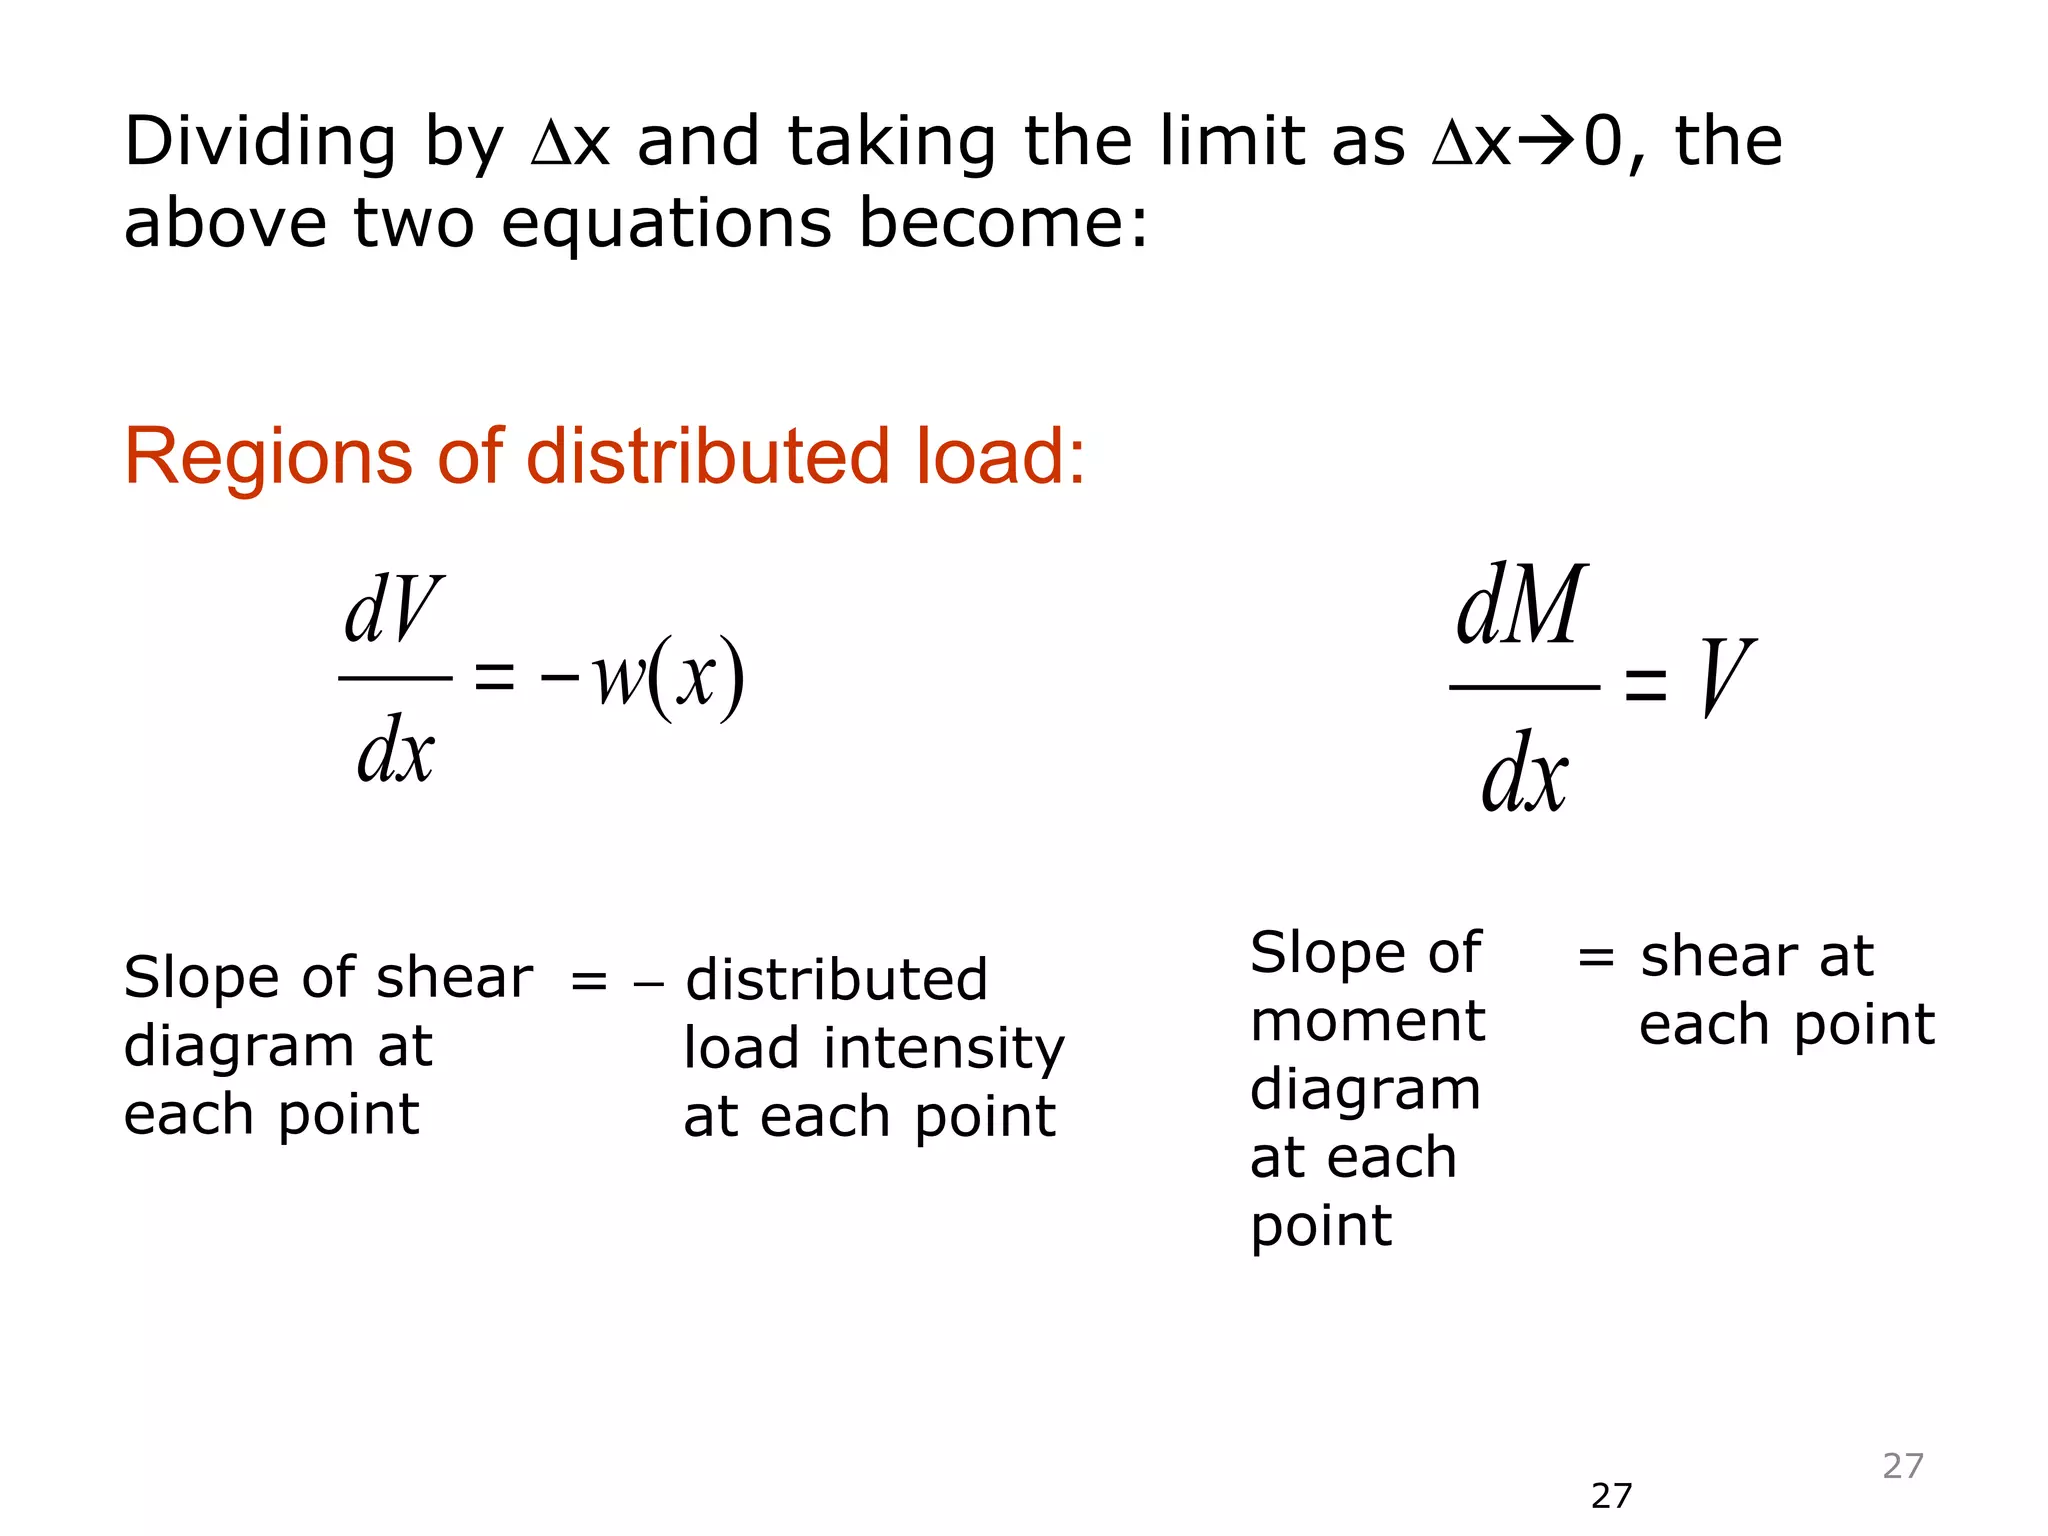
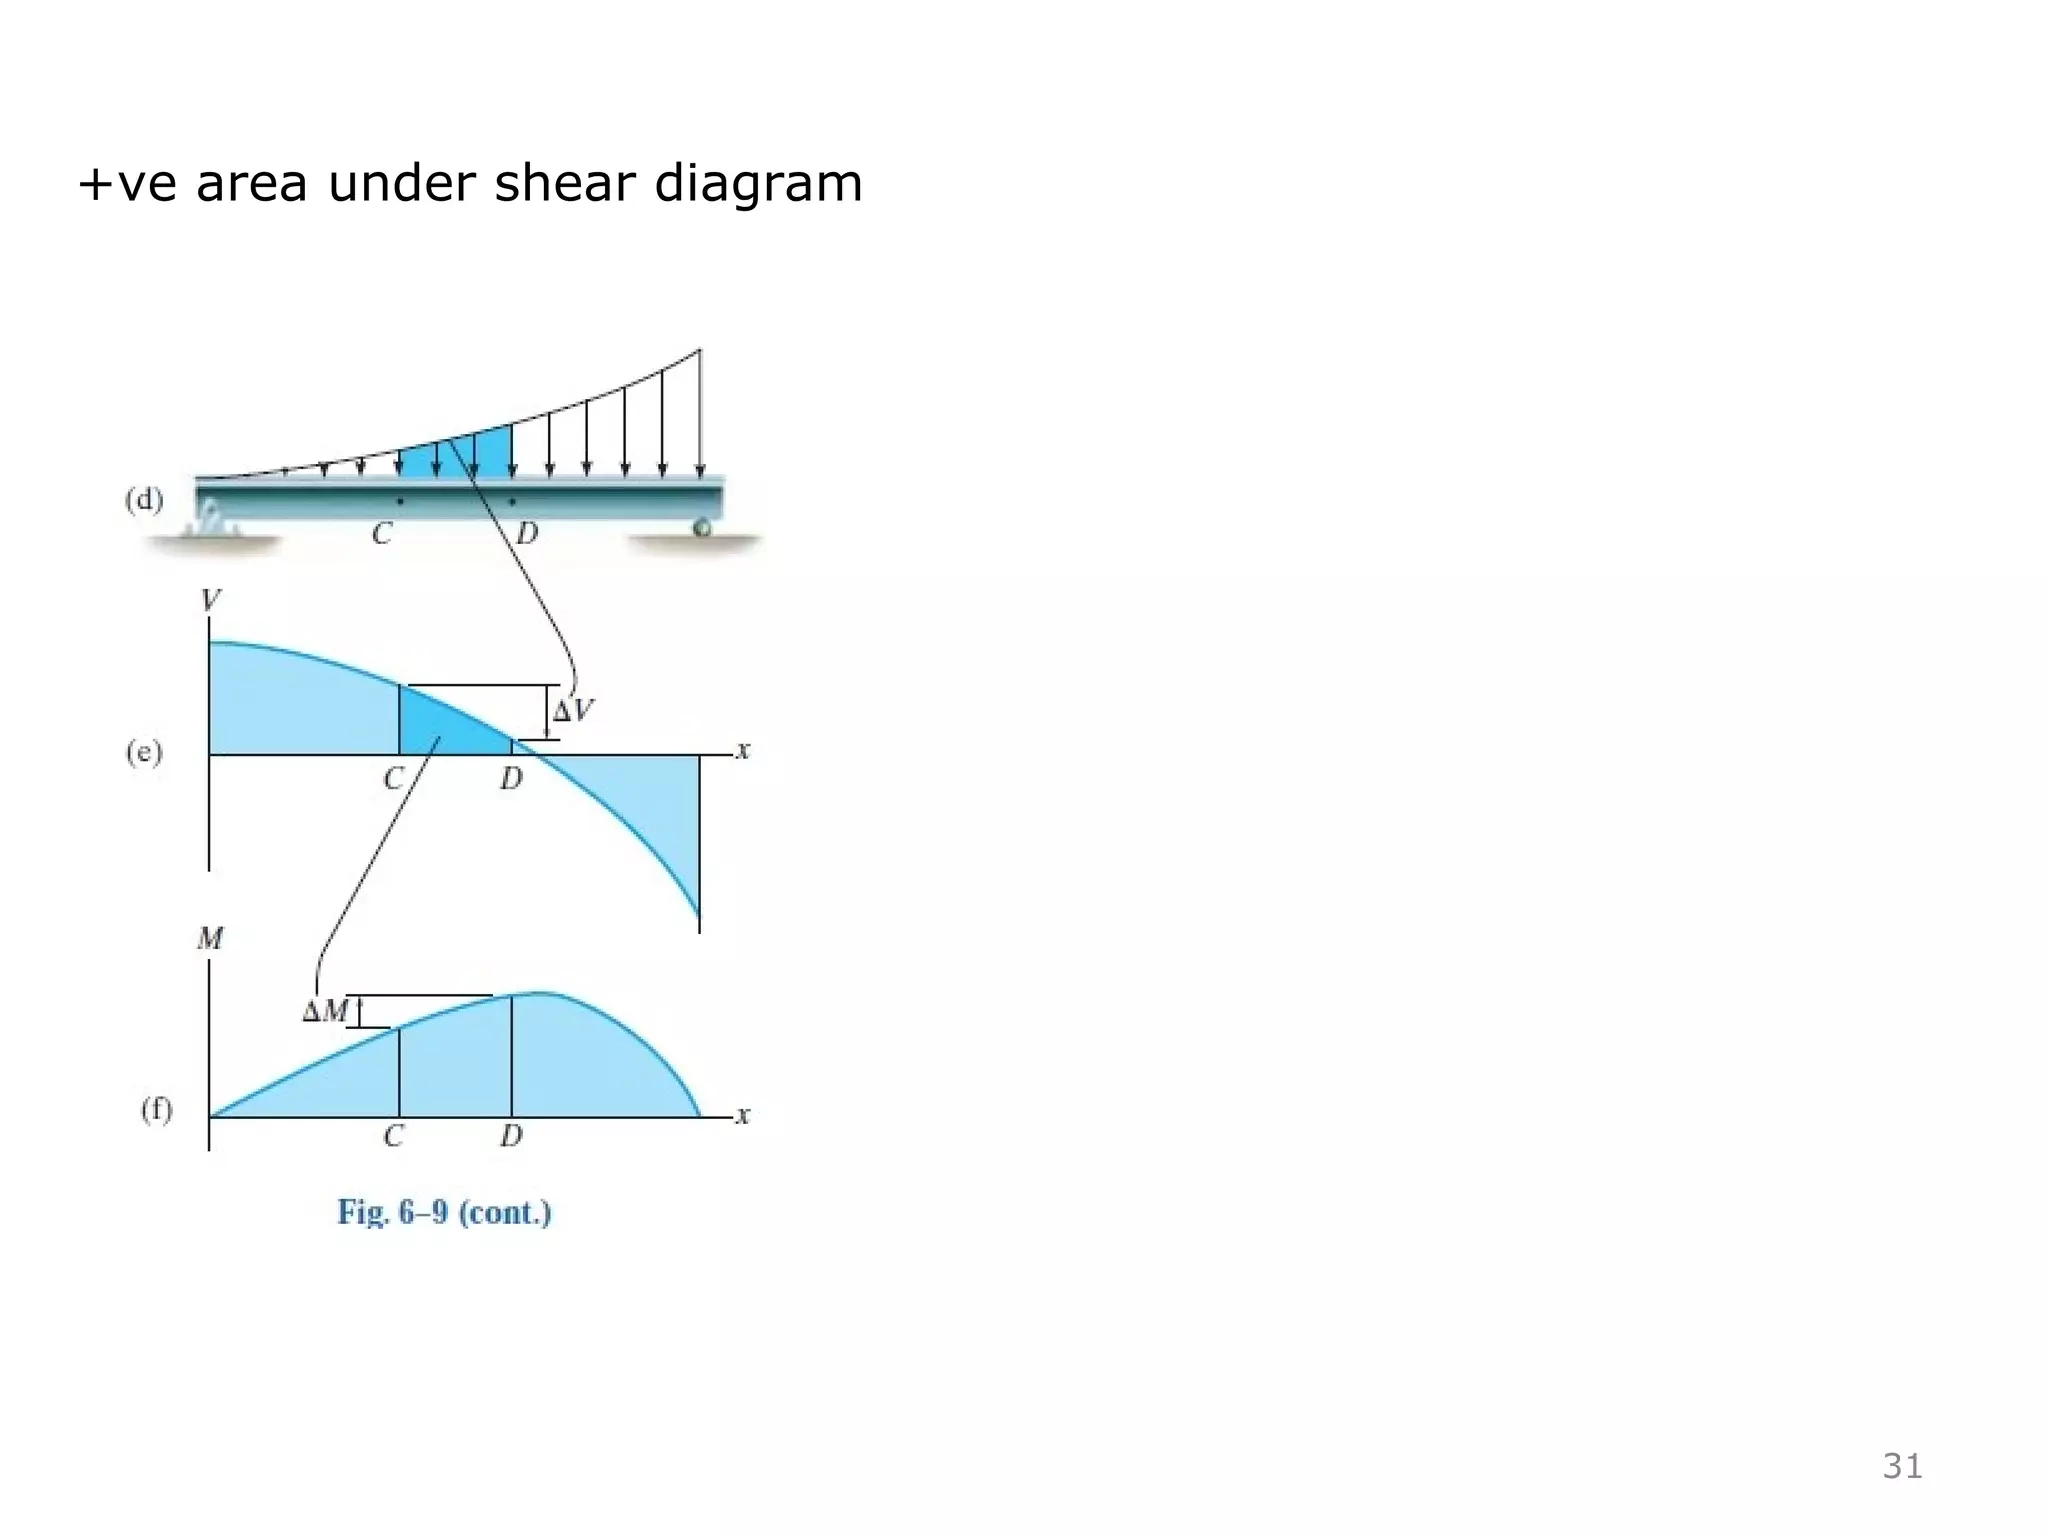
• Relationship between load and
shear:
( ) ( )[ ] ( )
( ) ( )2
0
:0
xkxwxVM
MMxkxxwMxV
Mo
∆−∆=∆
=∆++∆∆+−∆−
=Σ
• Relationship between shear and
bending moment:
26](https://image.slidesharecdn.com/typesofbeam-150403092842-conversion-gate01/75/Types-of-beam-26-2048.jpg)
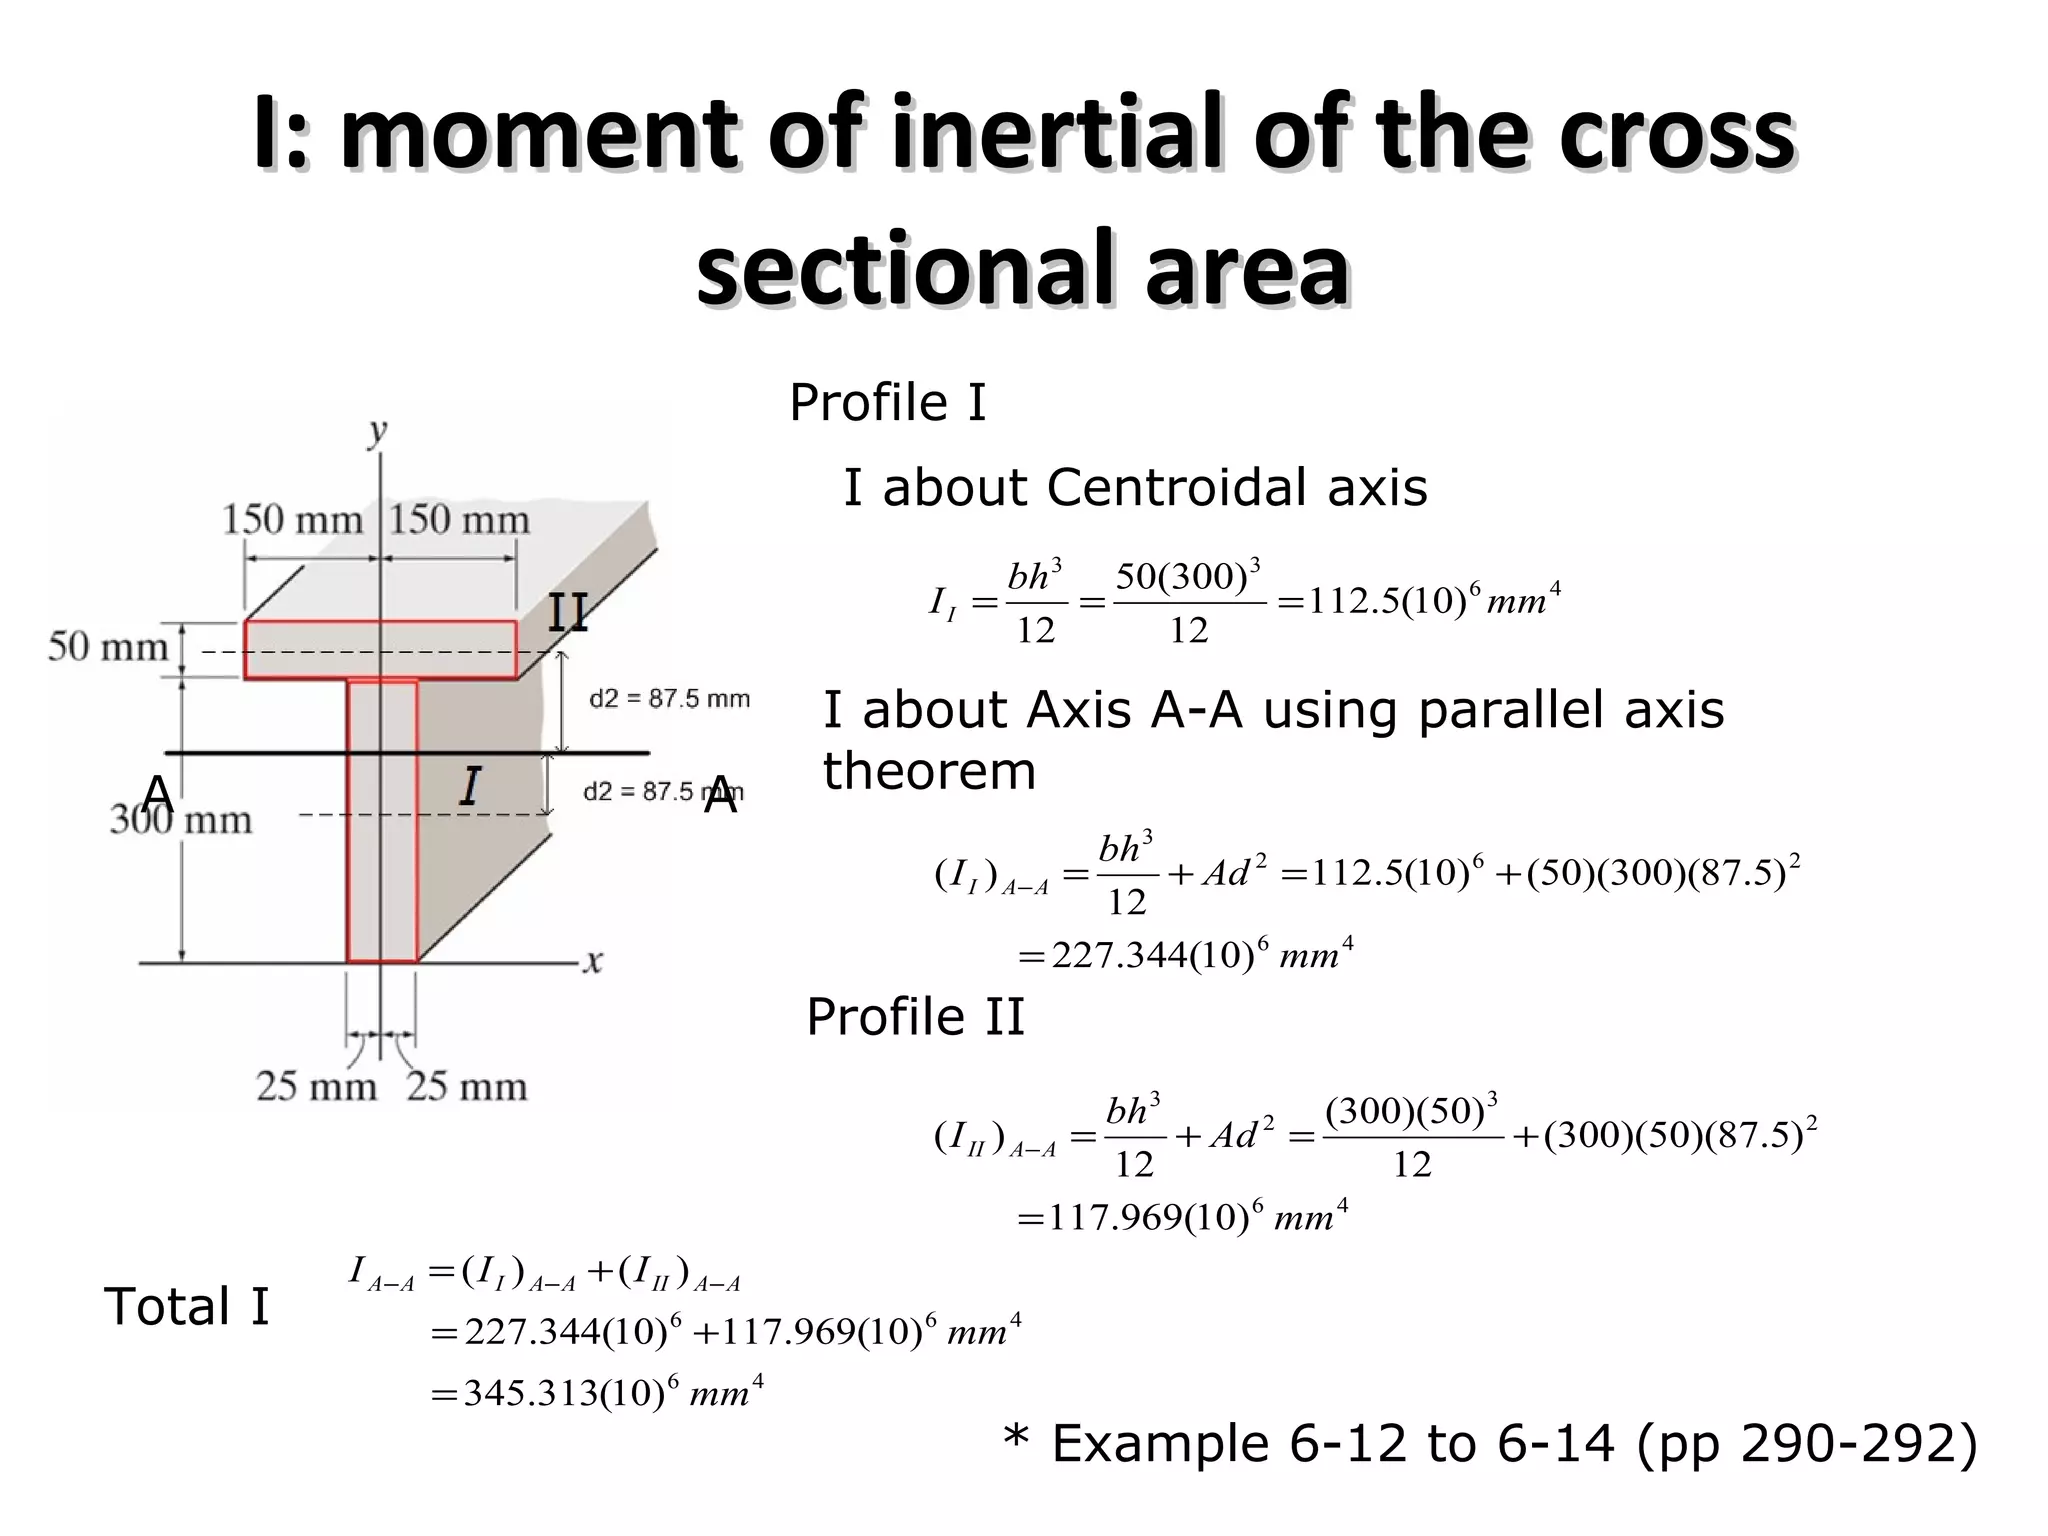
![46
3
2
3
)10(8.786
12
)300(40
])170)(40)(300(
12
)40(300
[2
mm
II
=
++=
Total Moment of Inertia
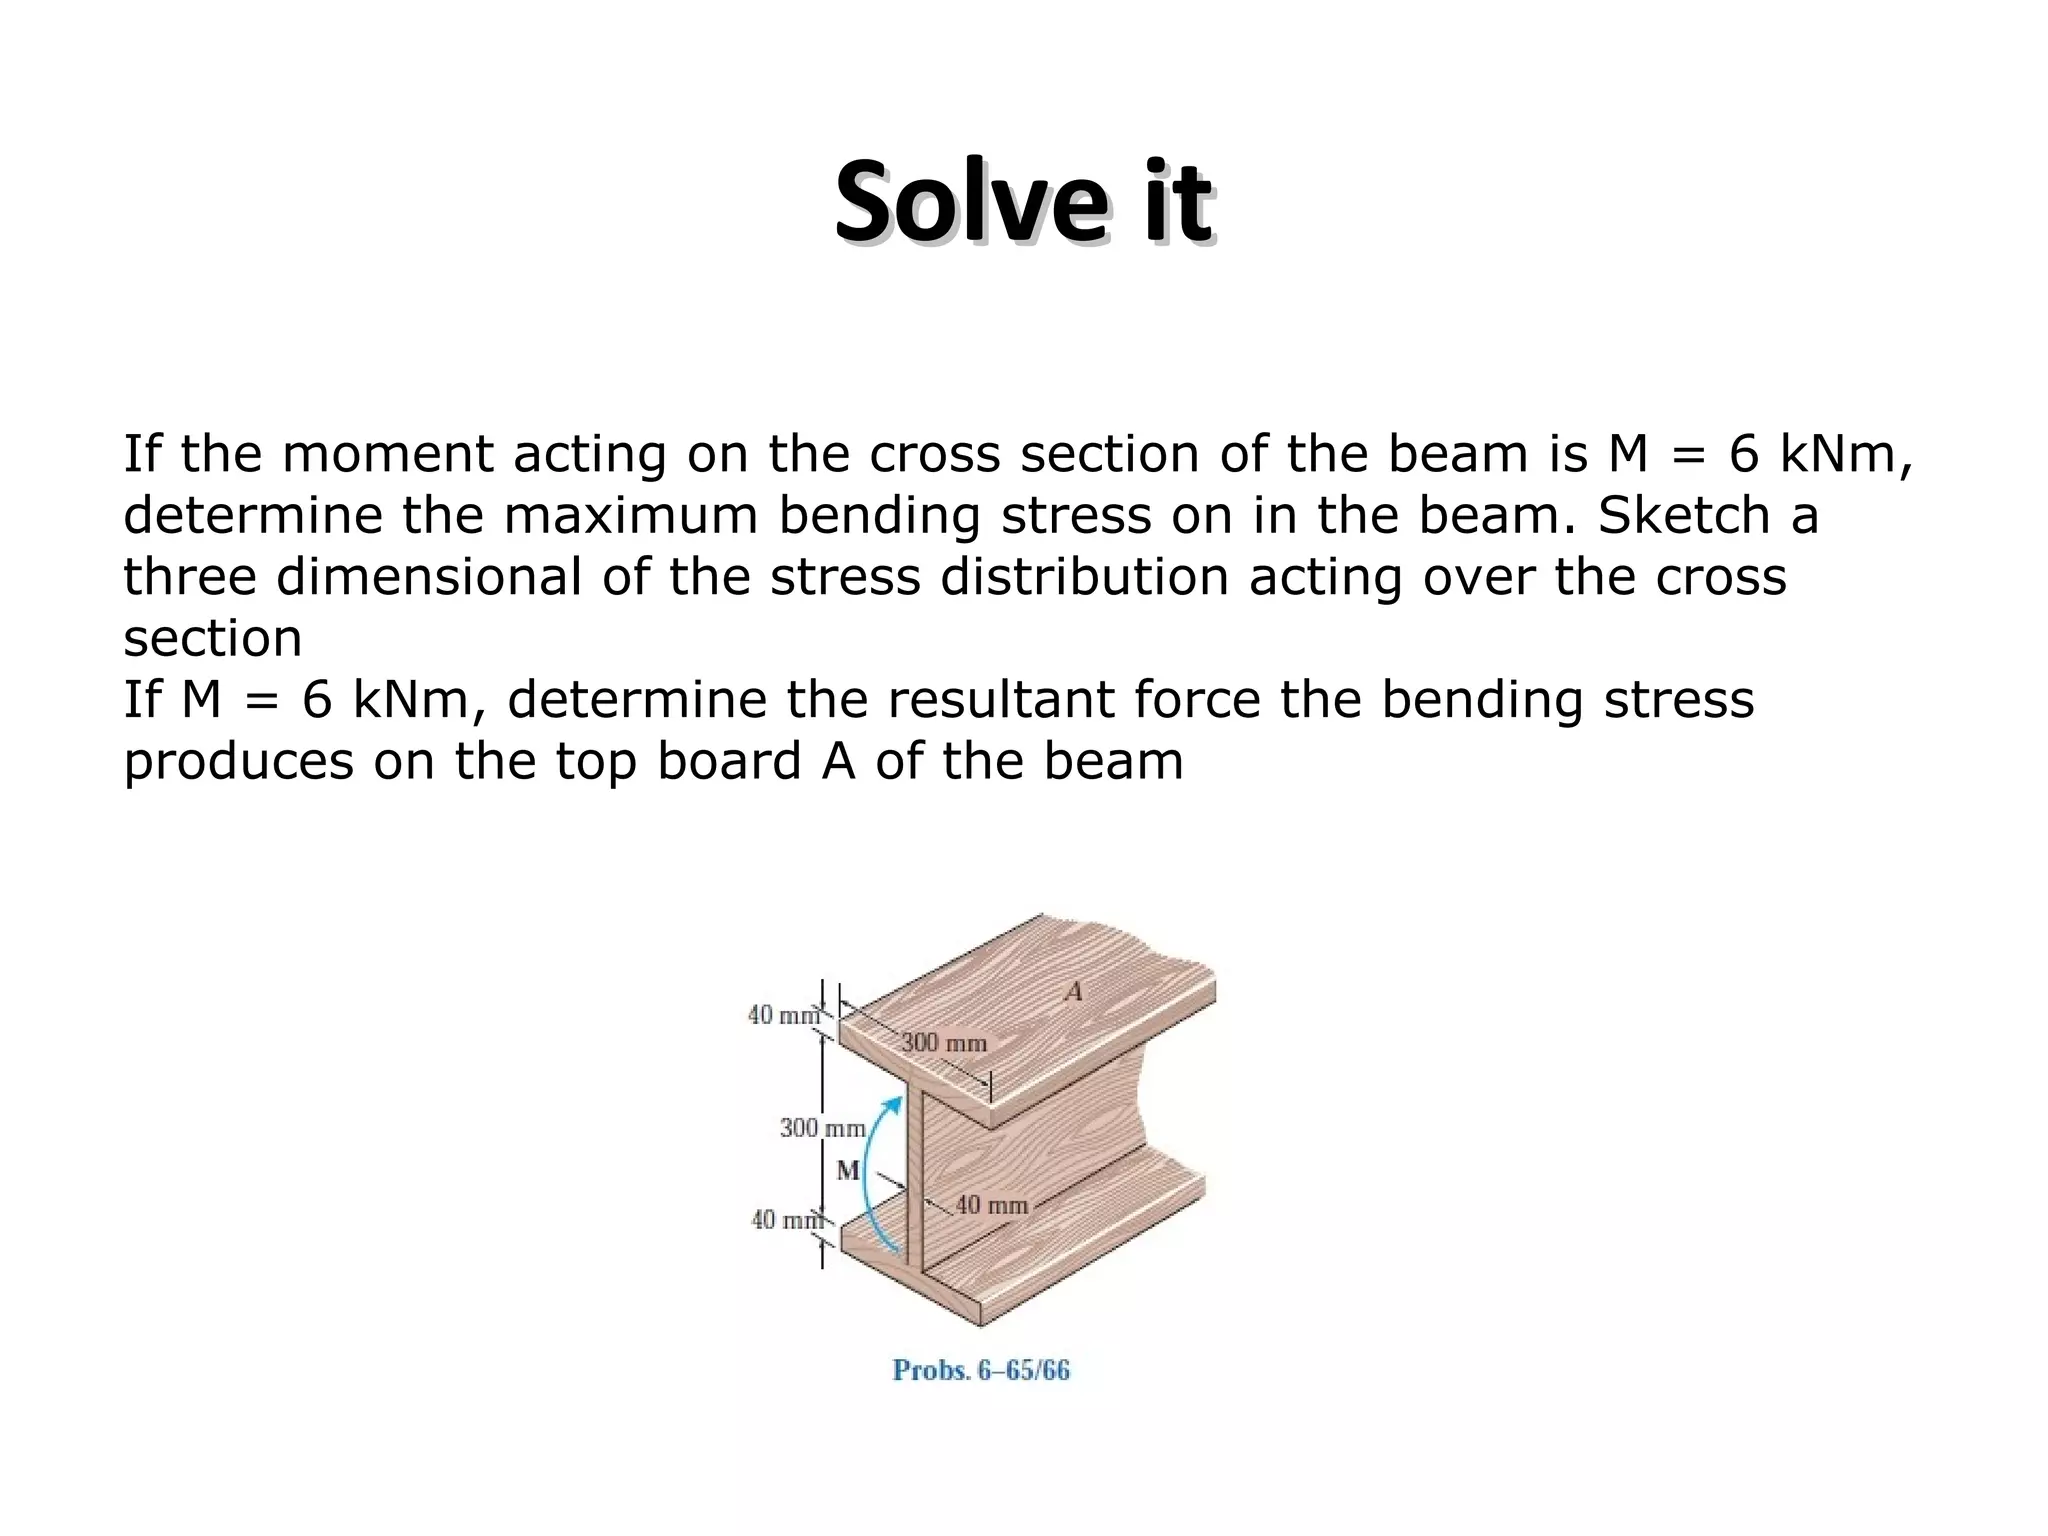
Max Bending Stress at the top and bottom
MPa
II
Mc
Mtop 45.1
)190()10(6000 3
−=
−
=−=
MPaMbottom 45.1=
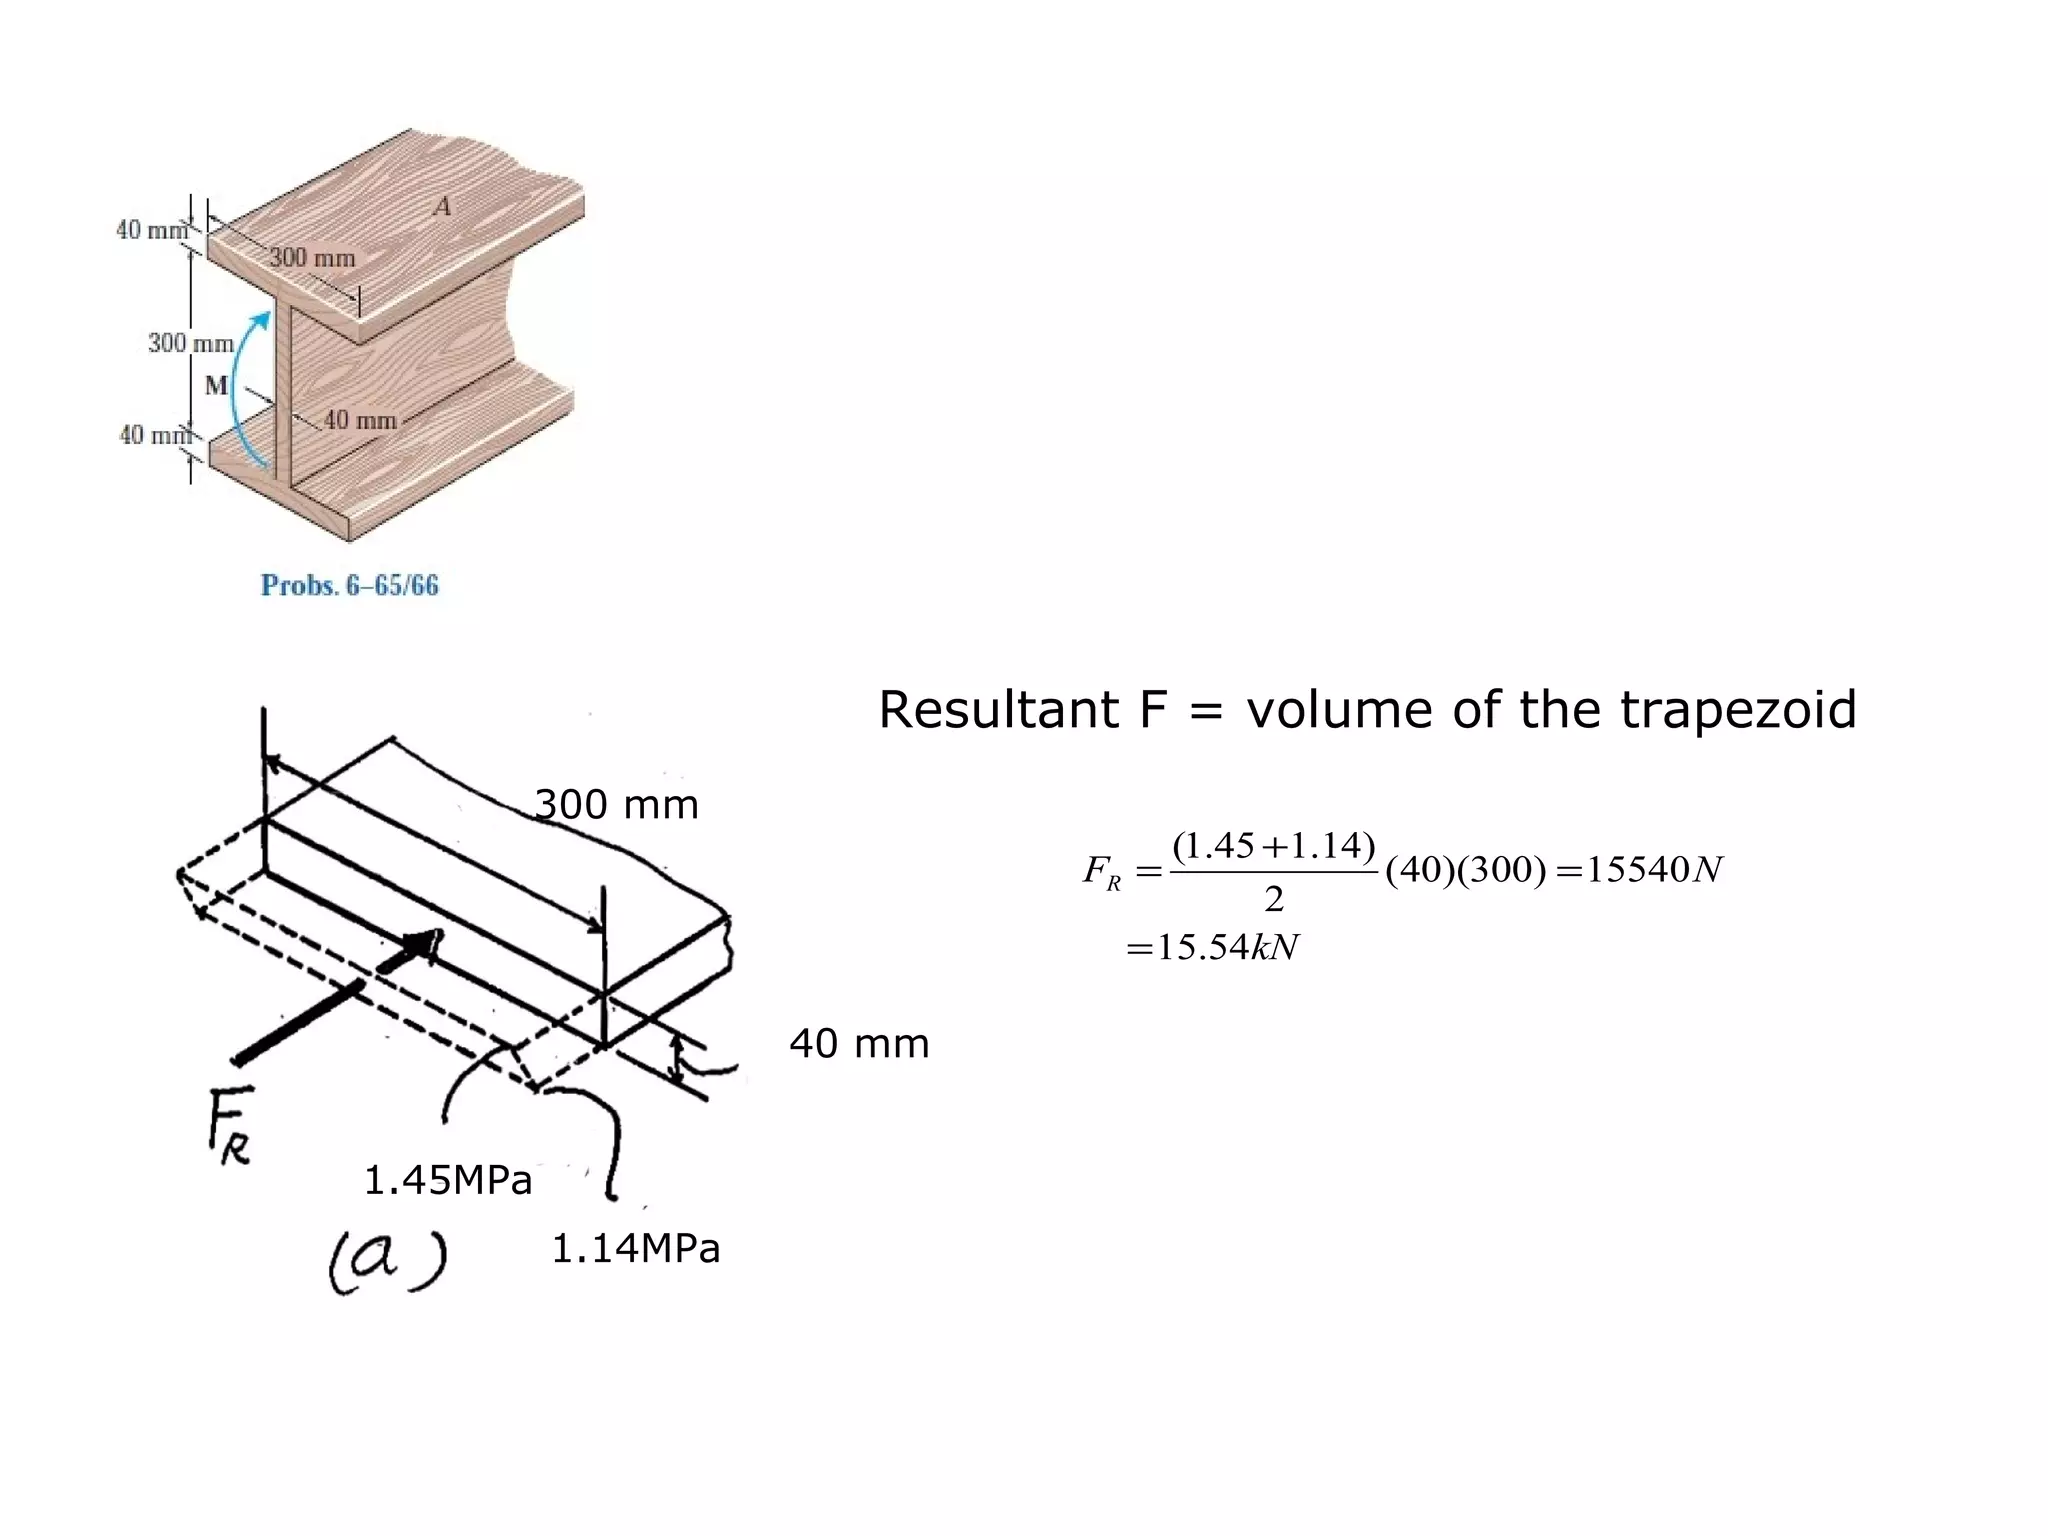
Bottom of the flange
MPa
II
Mc
M topf 14.1
)150()10(6000 3
_ −=
−
=−=
MPaM bottomf 14.1_ =
1.45MPa
1.14MPa
6kNm](https://image.slidesharecdn.com/typesofbeam-150403092842-conversion-gate01/75/Types-of-beam-45-2048.jpg)
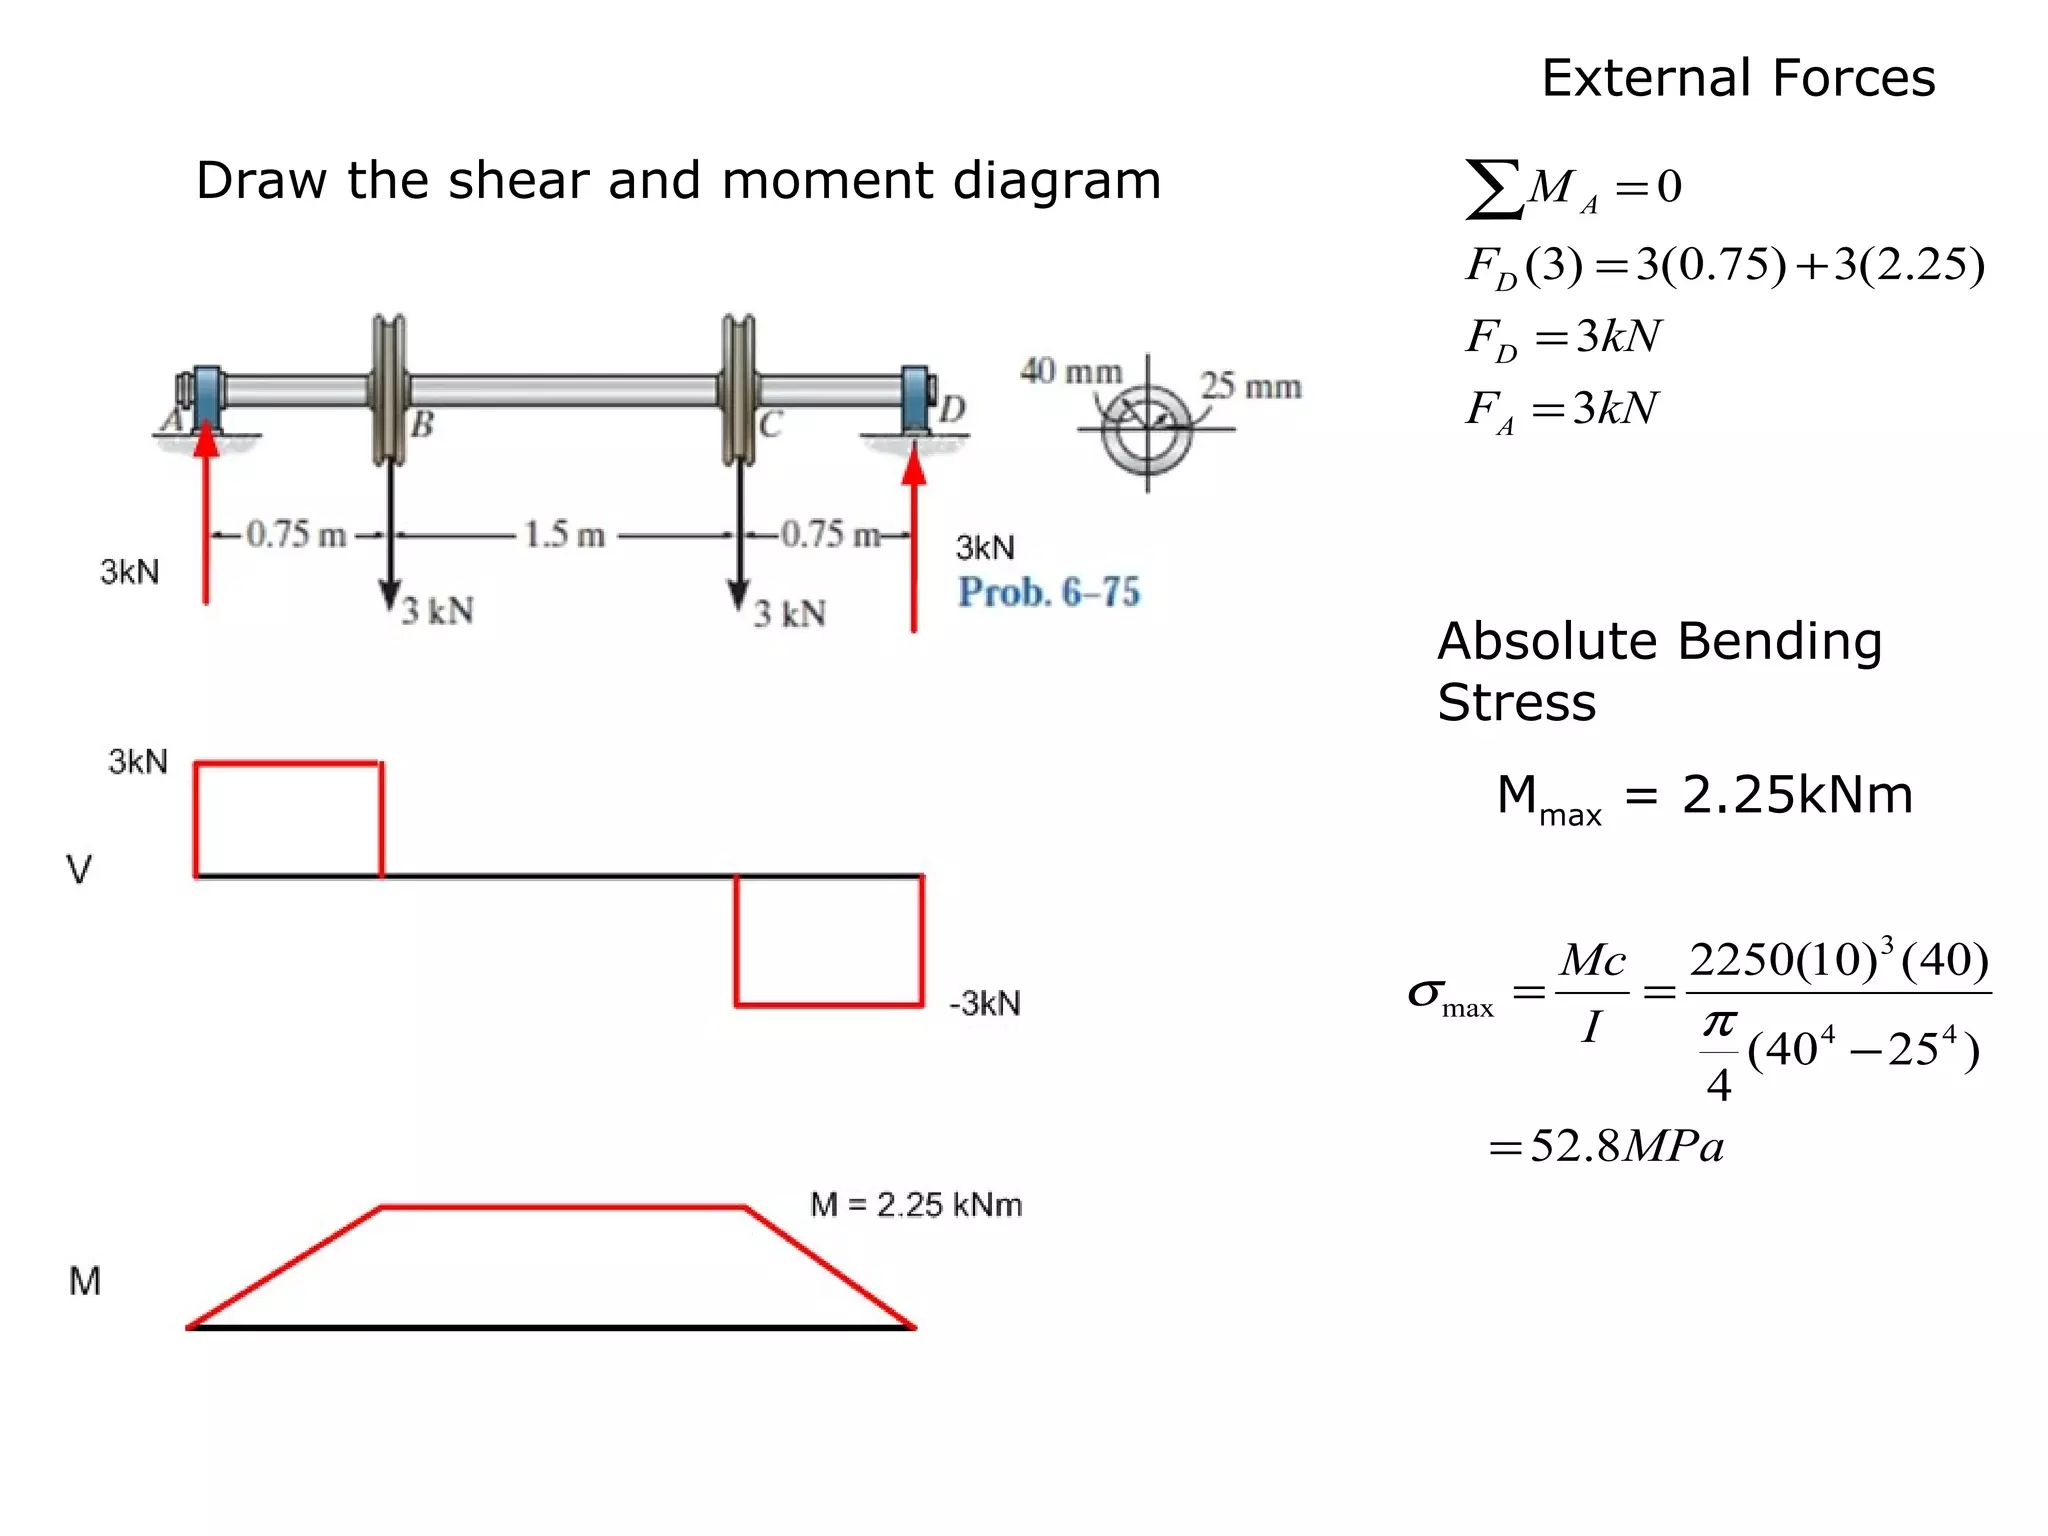

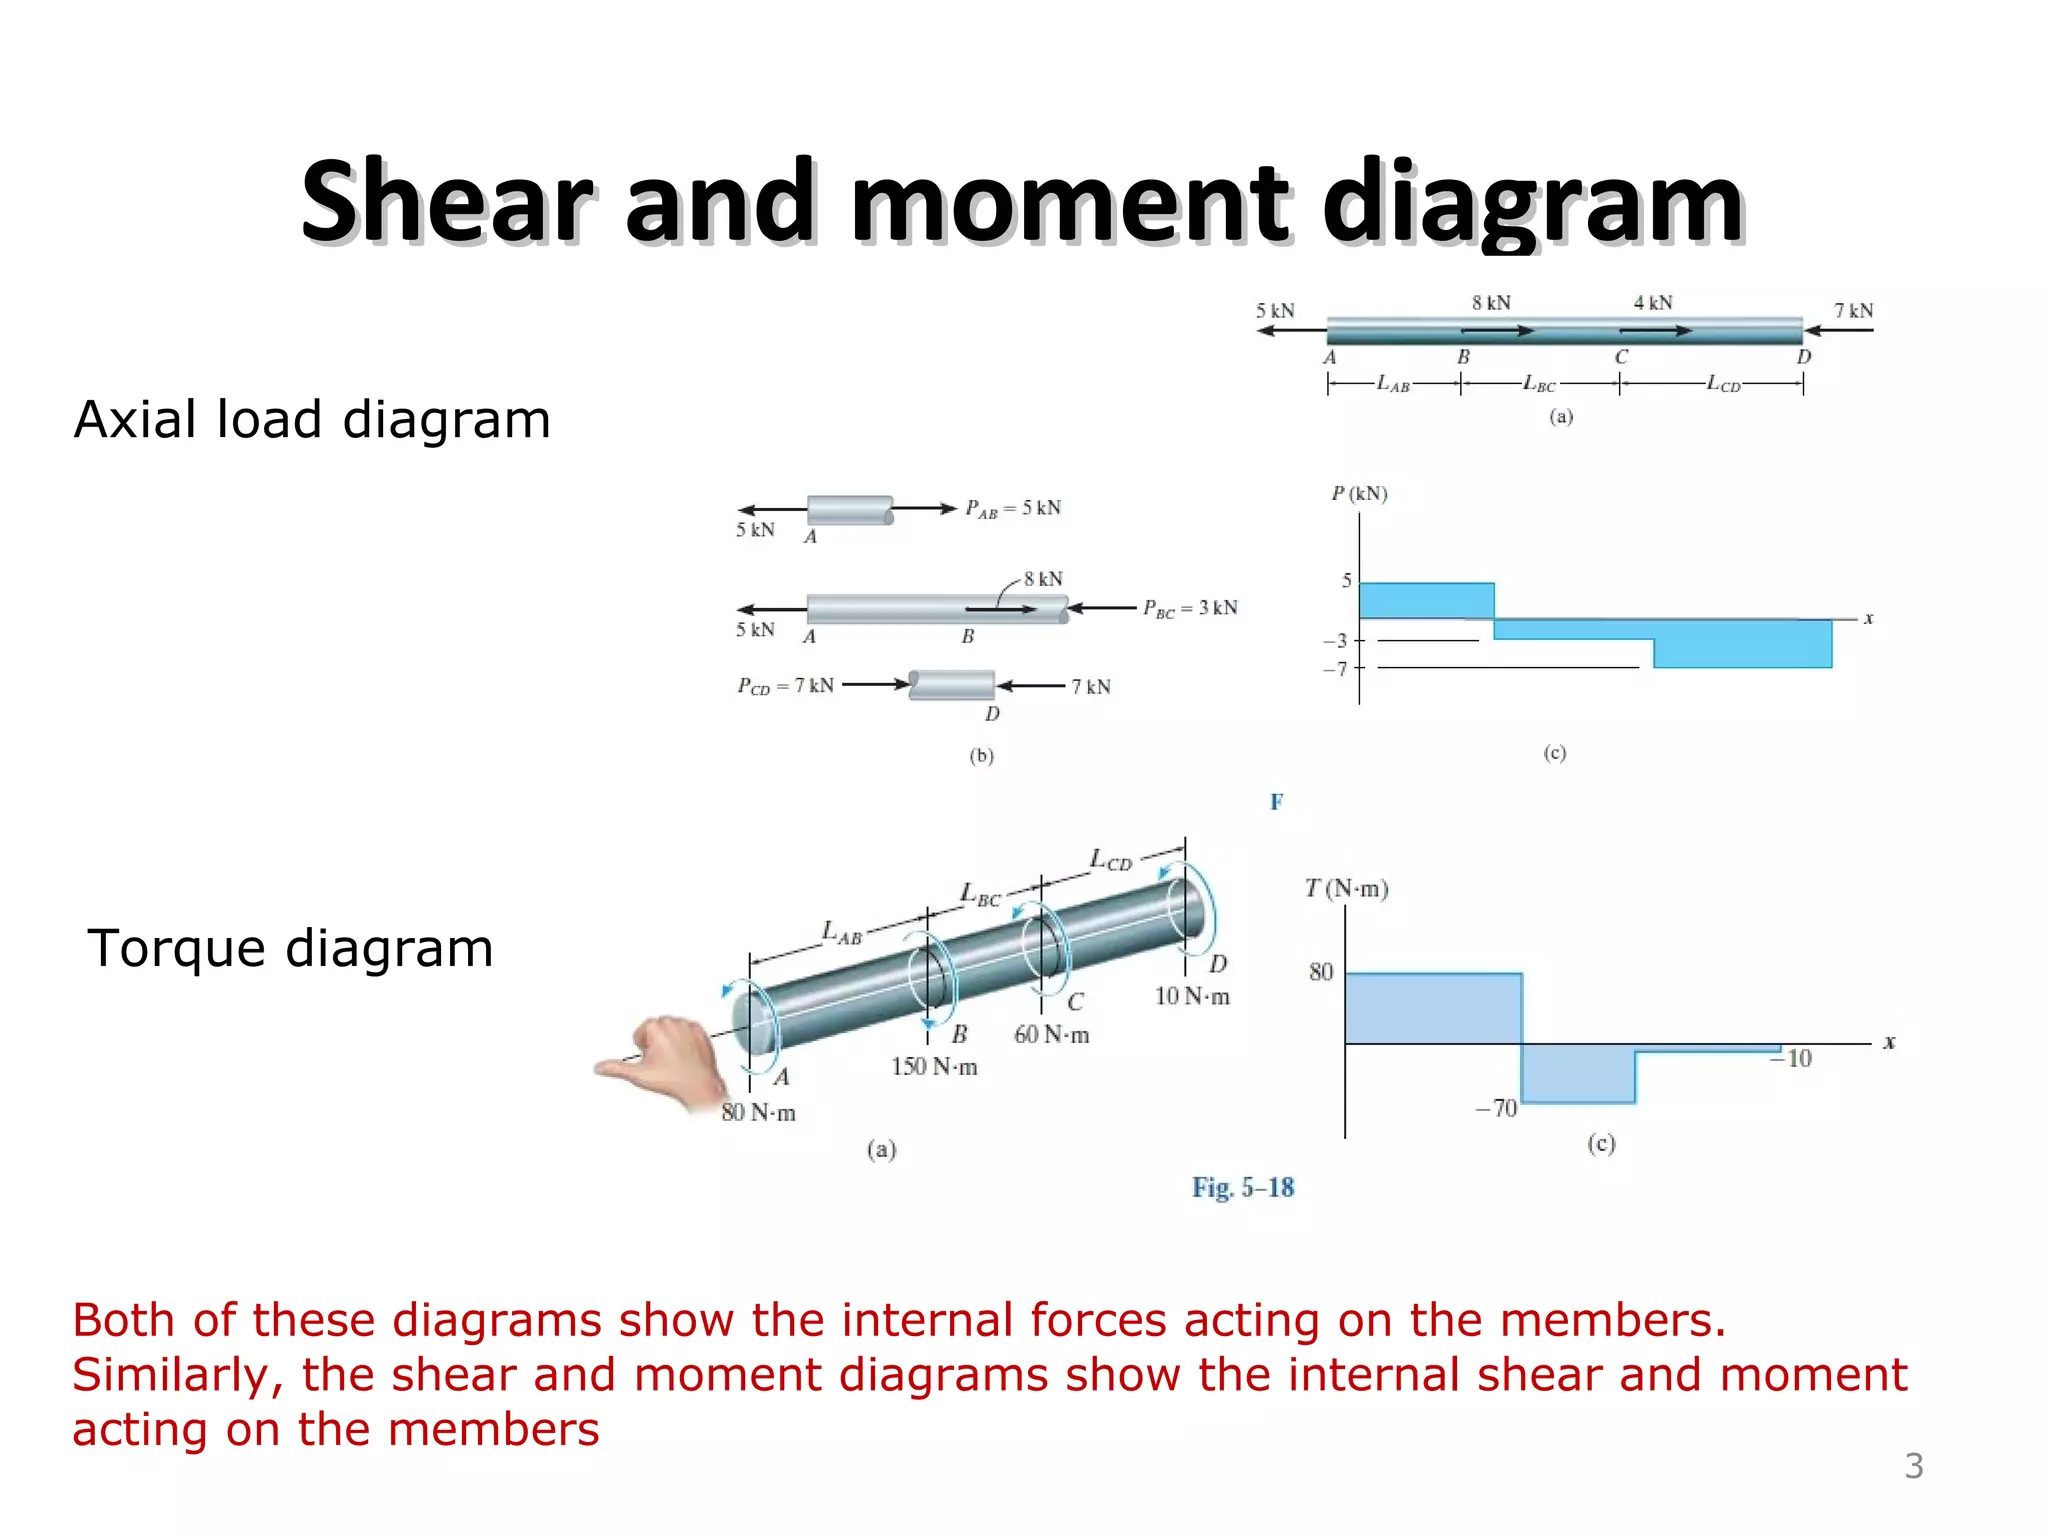
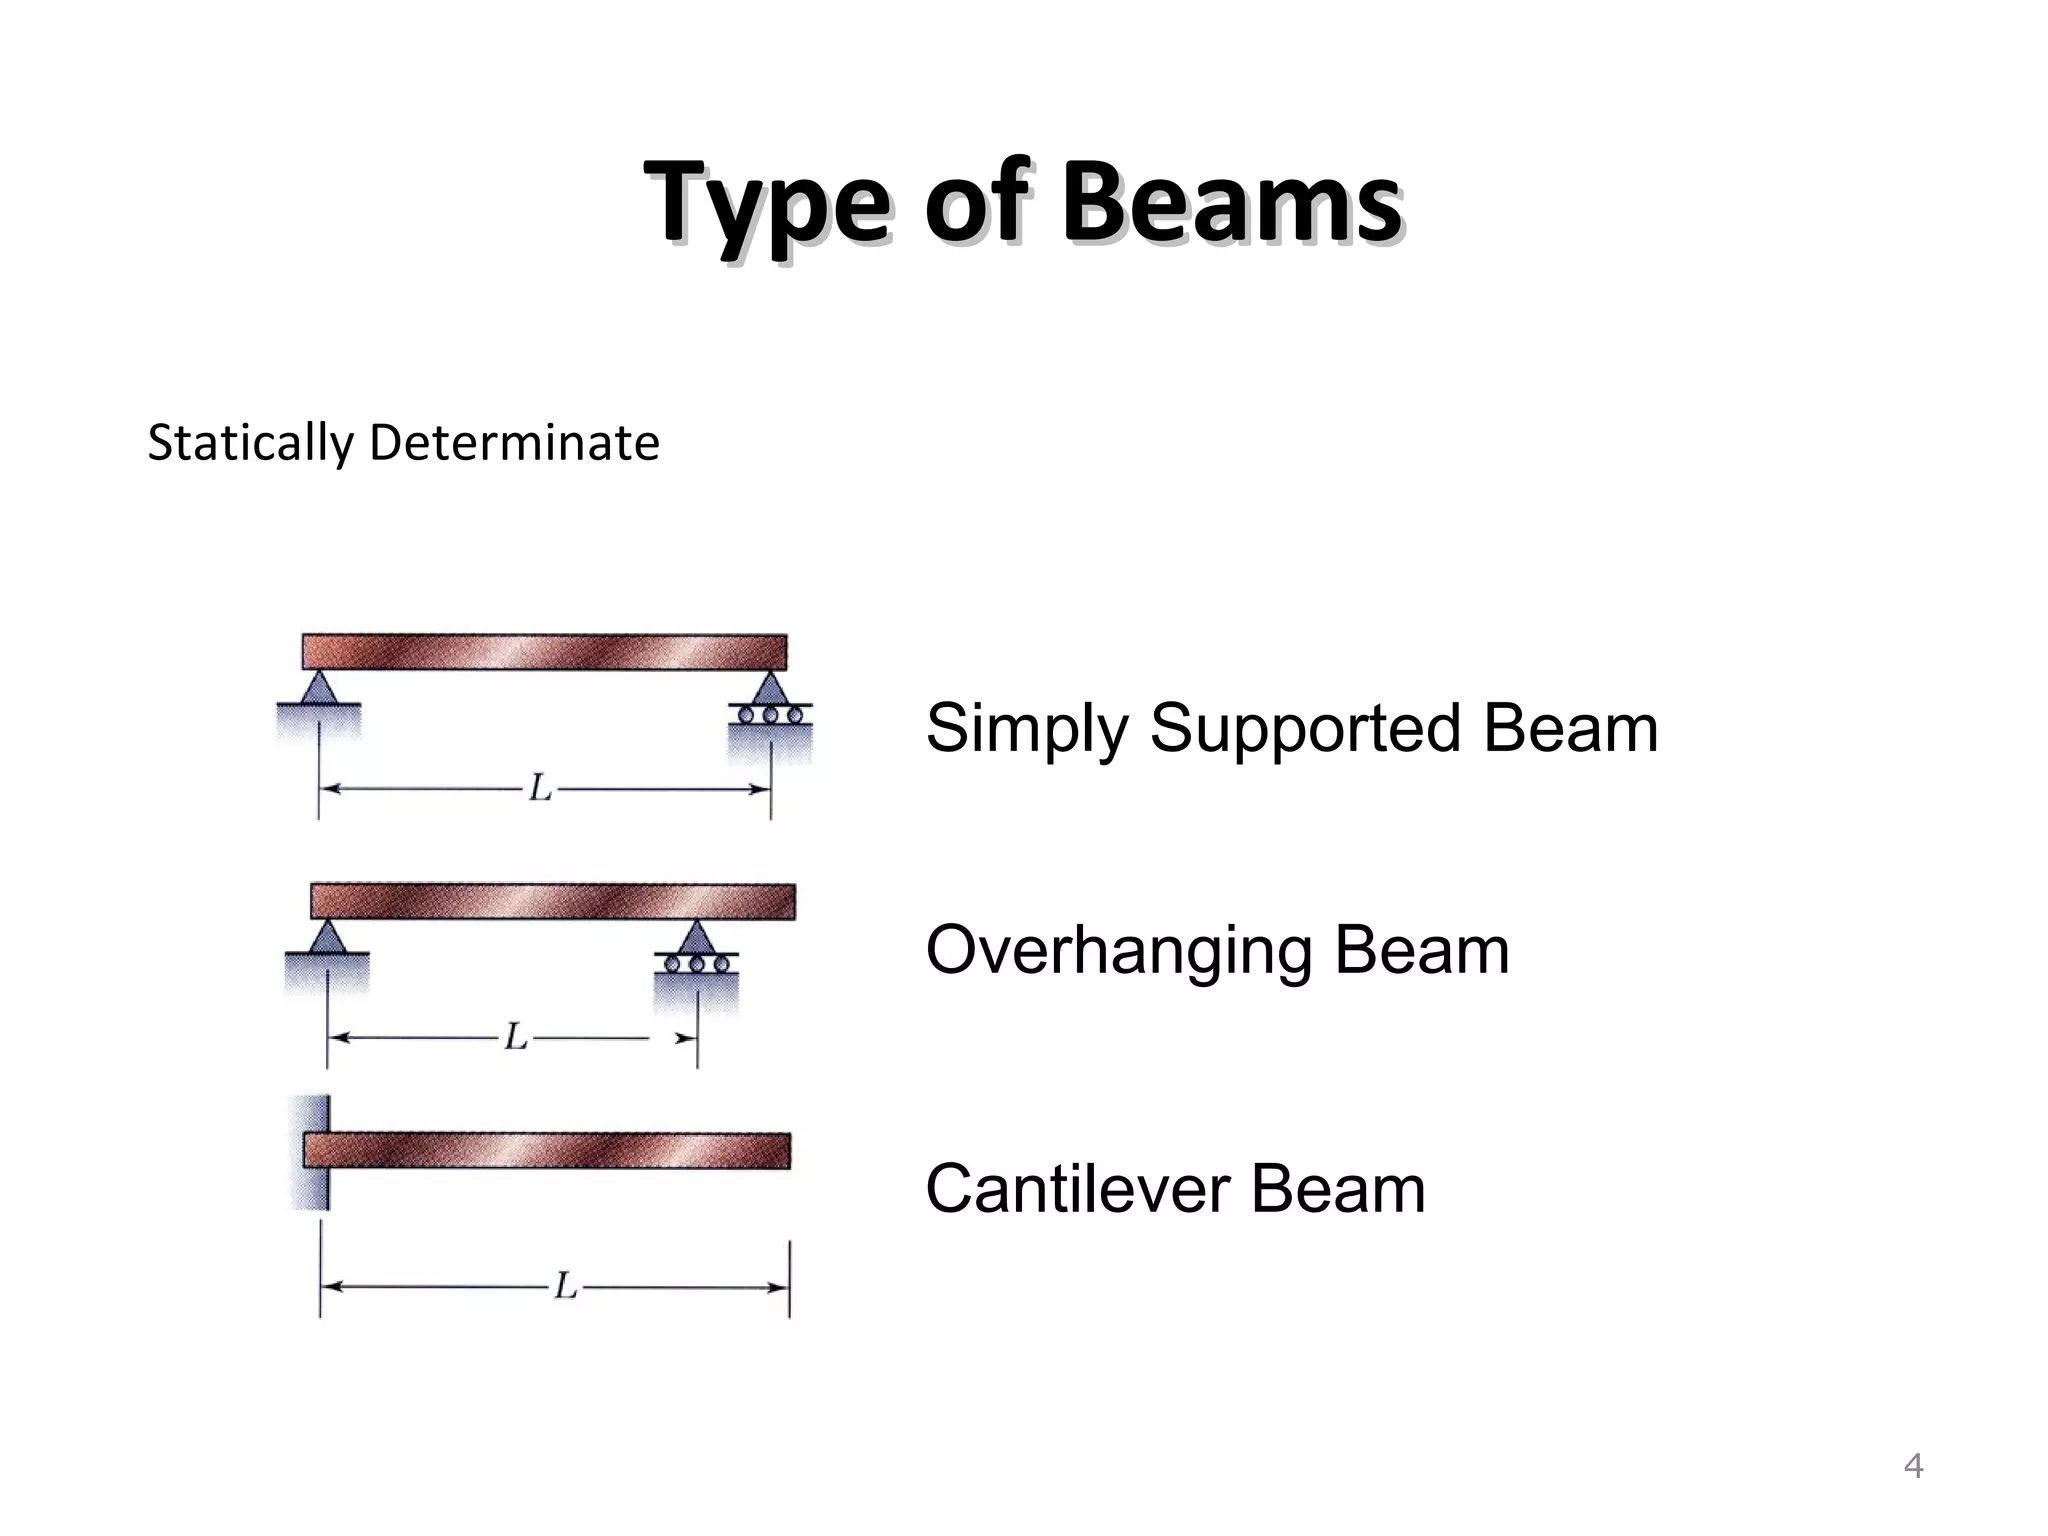
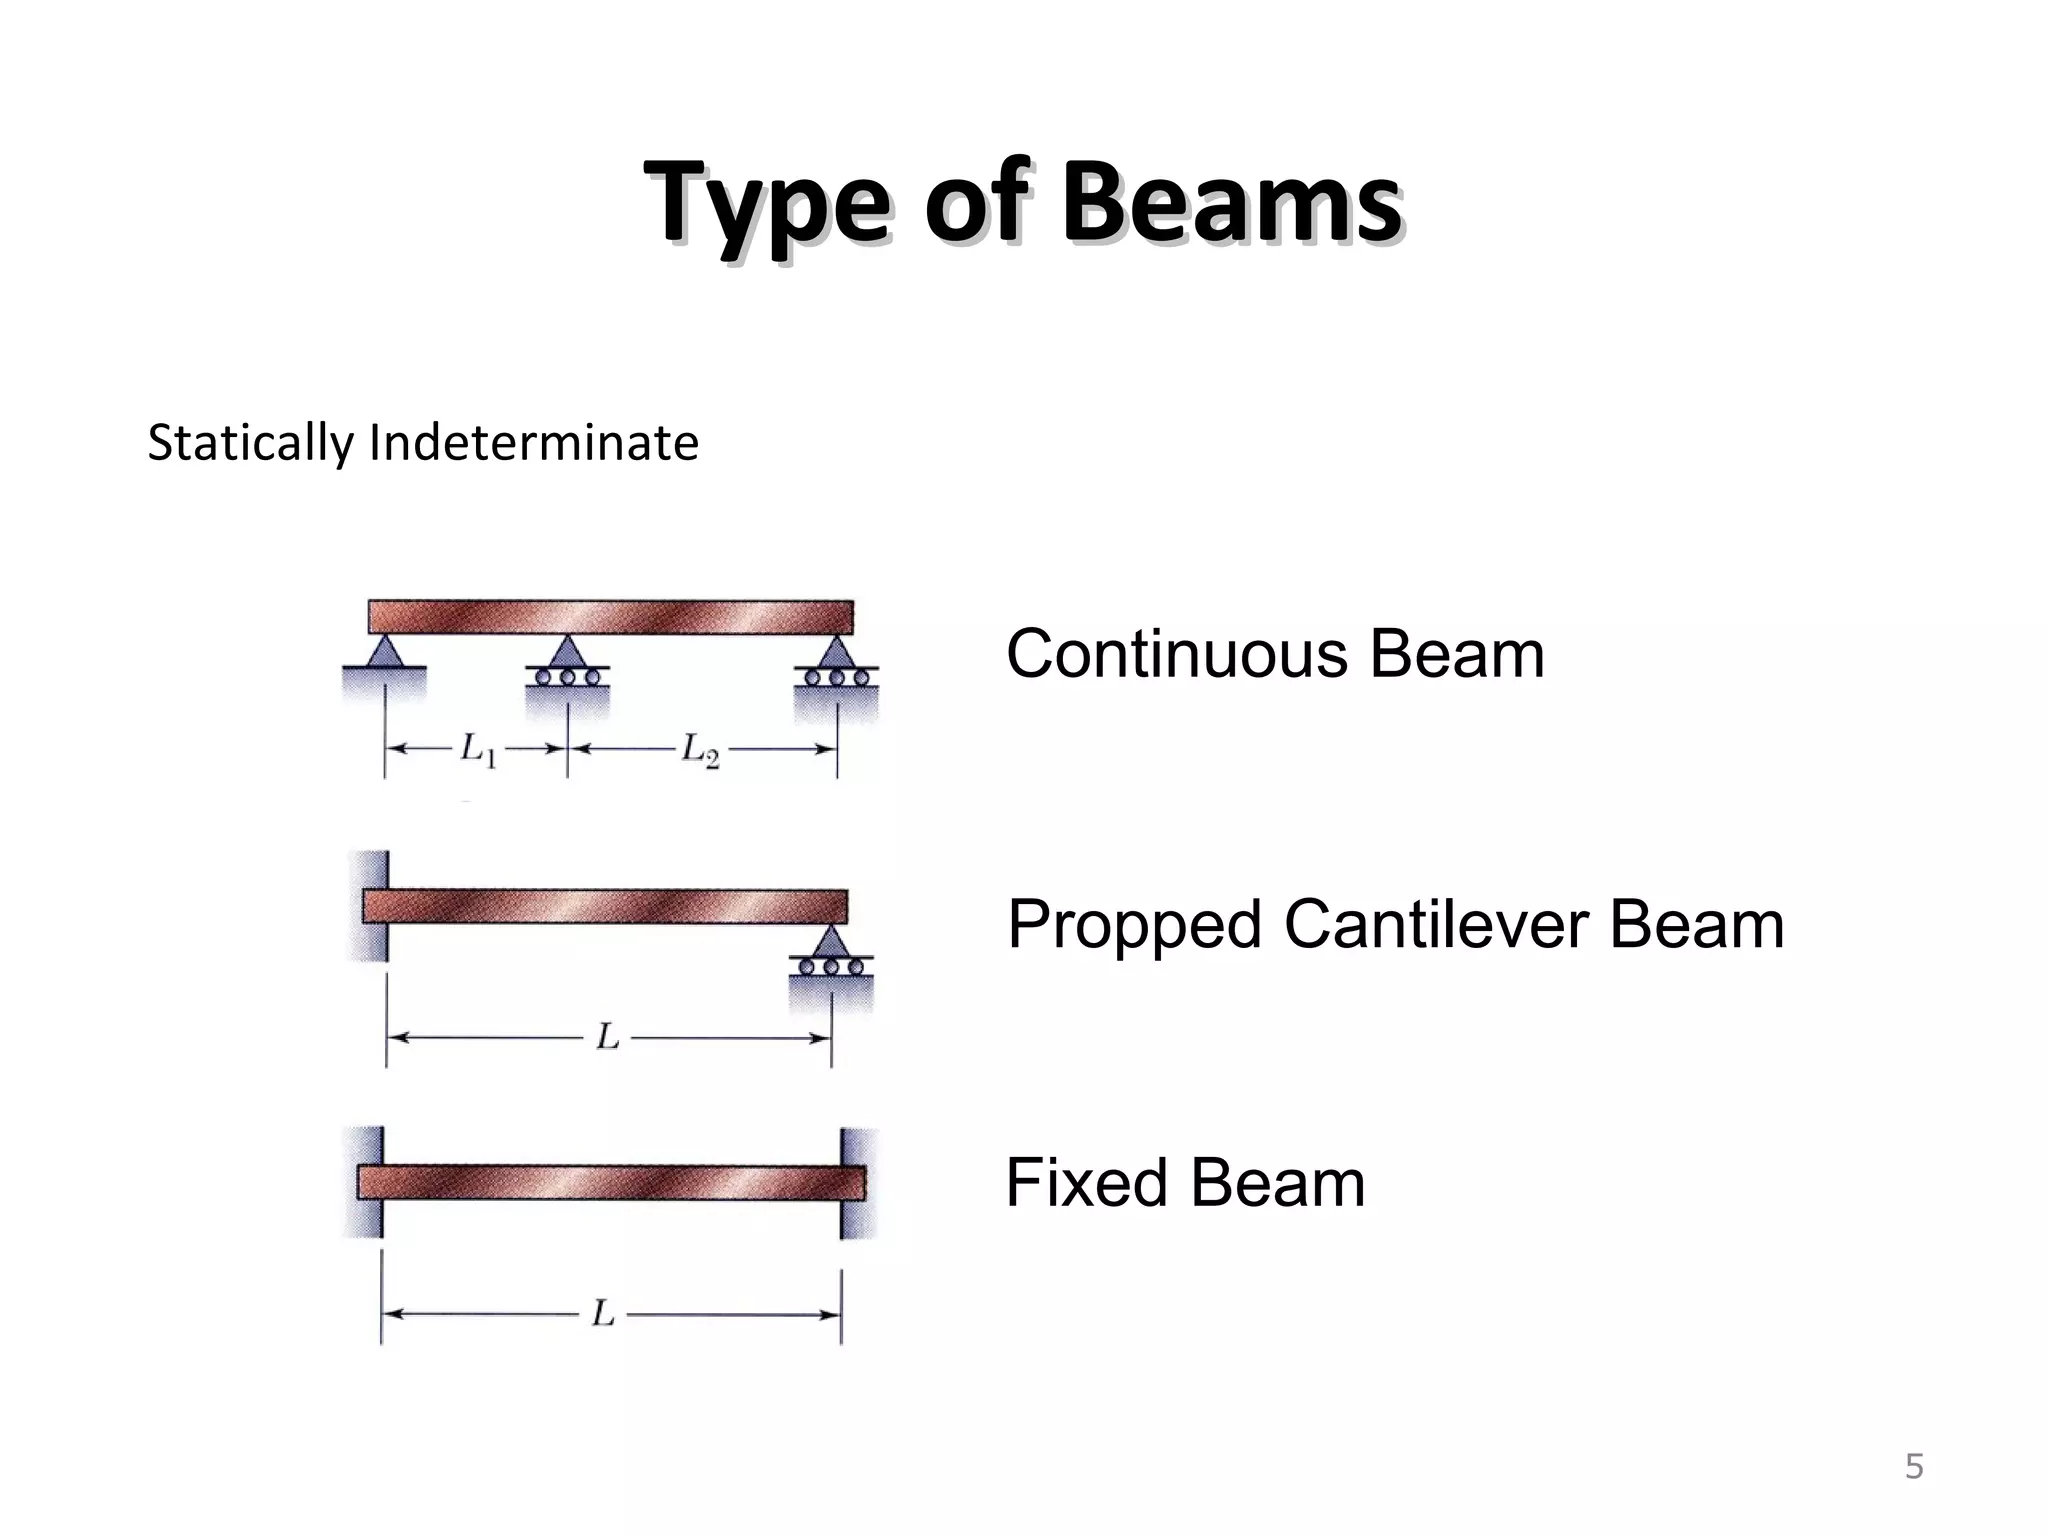
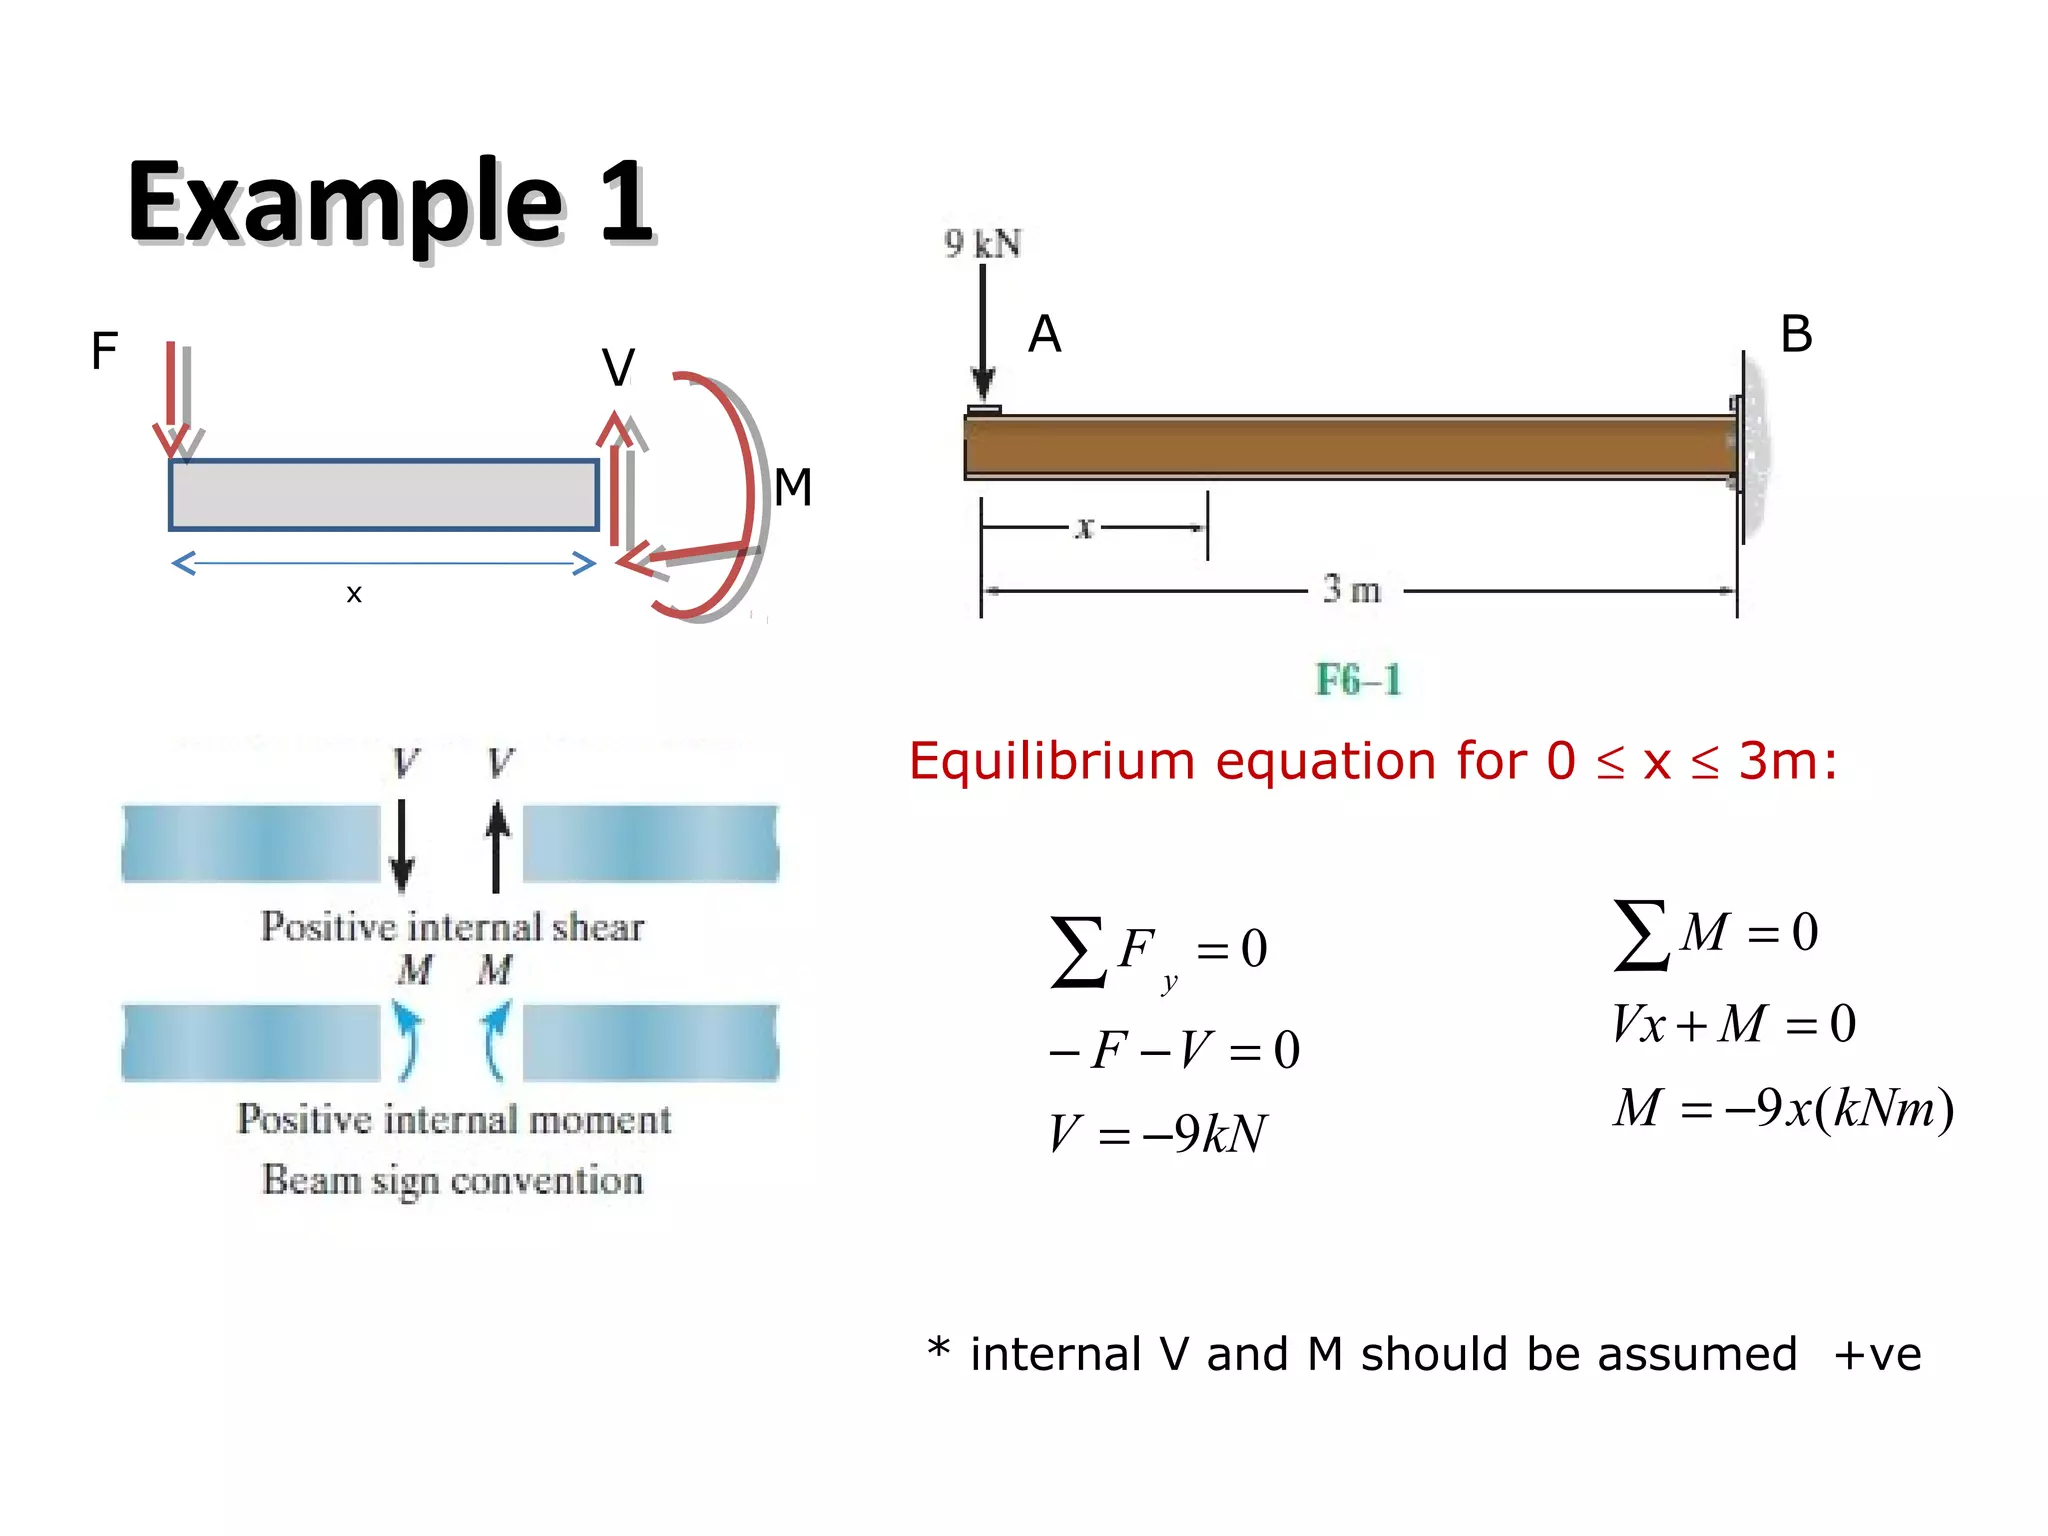
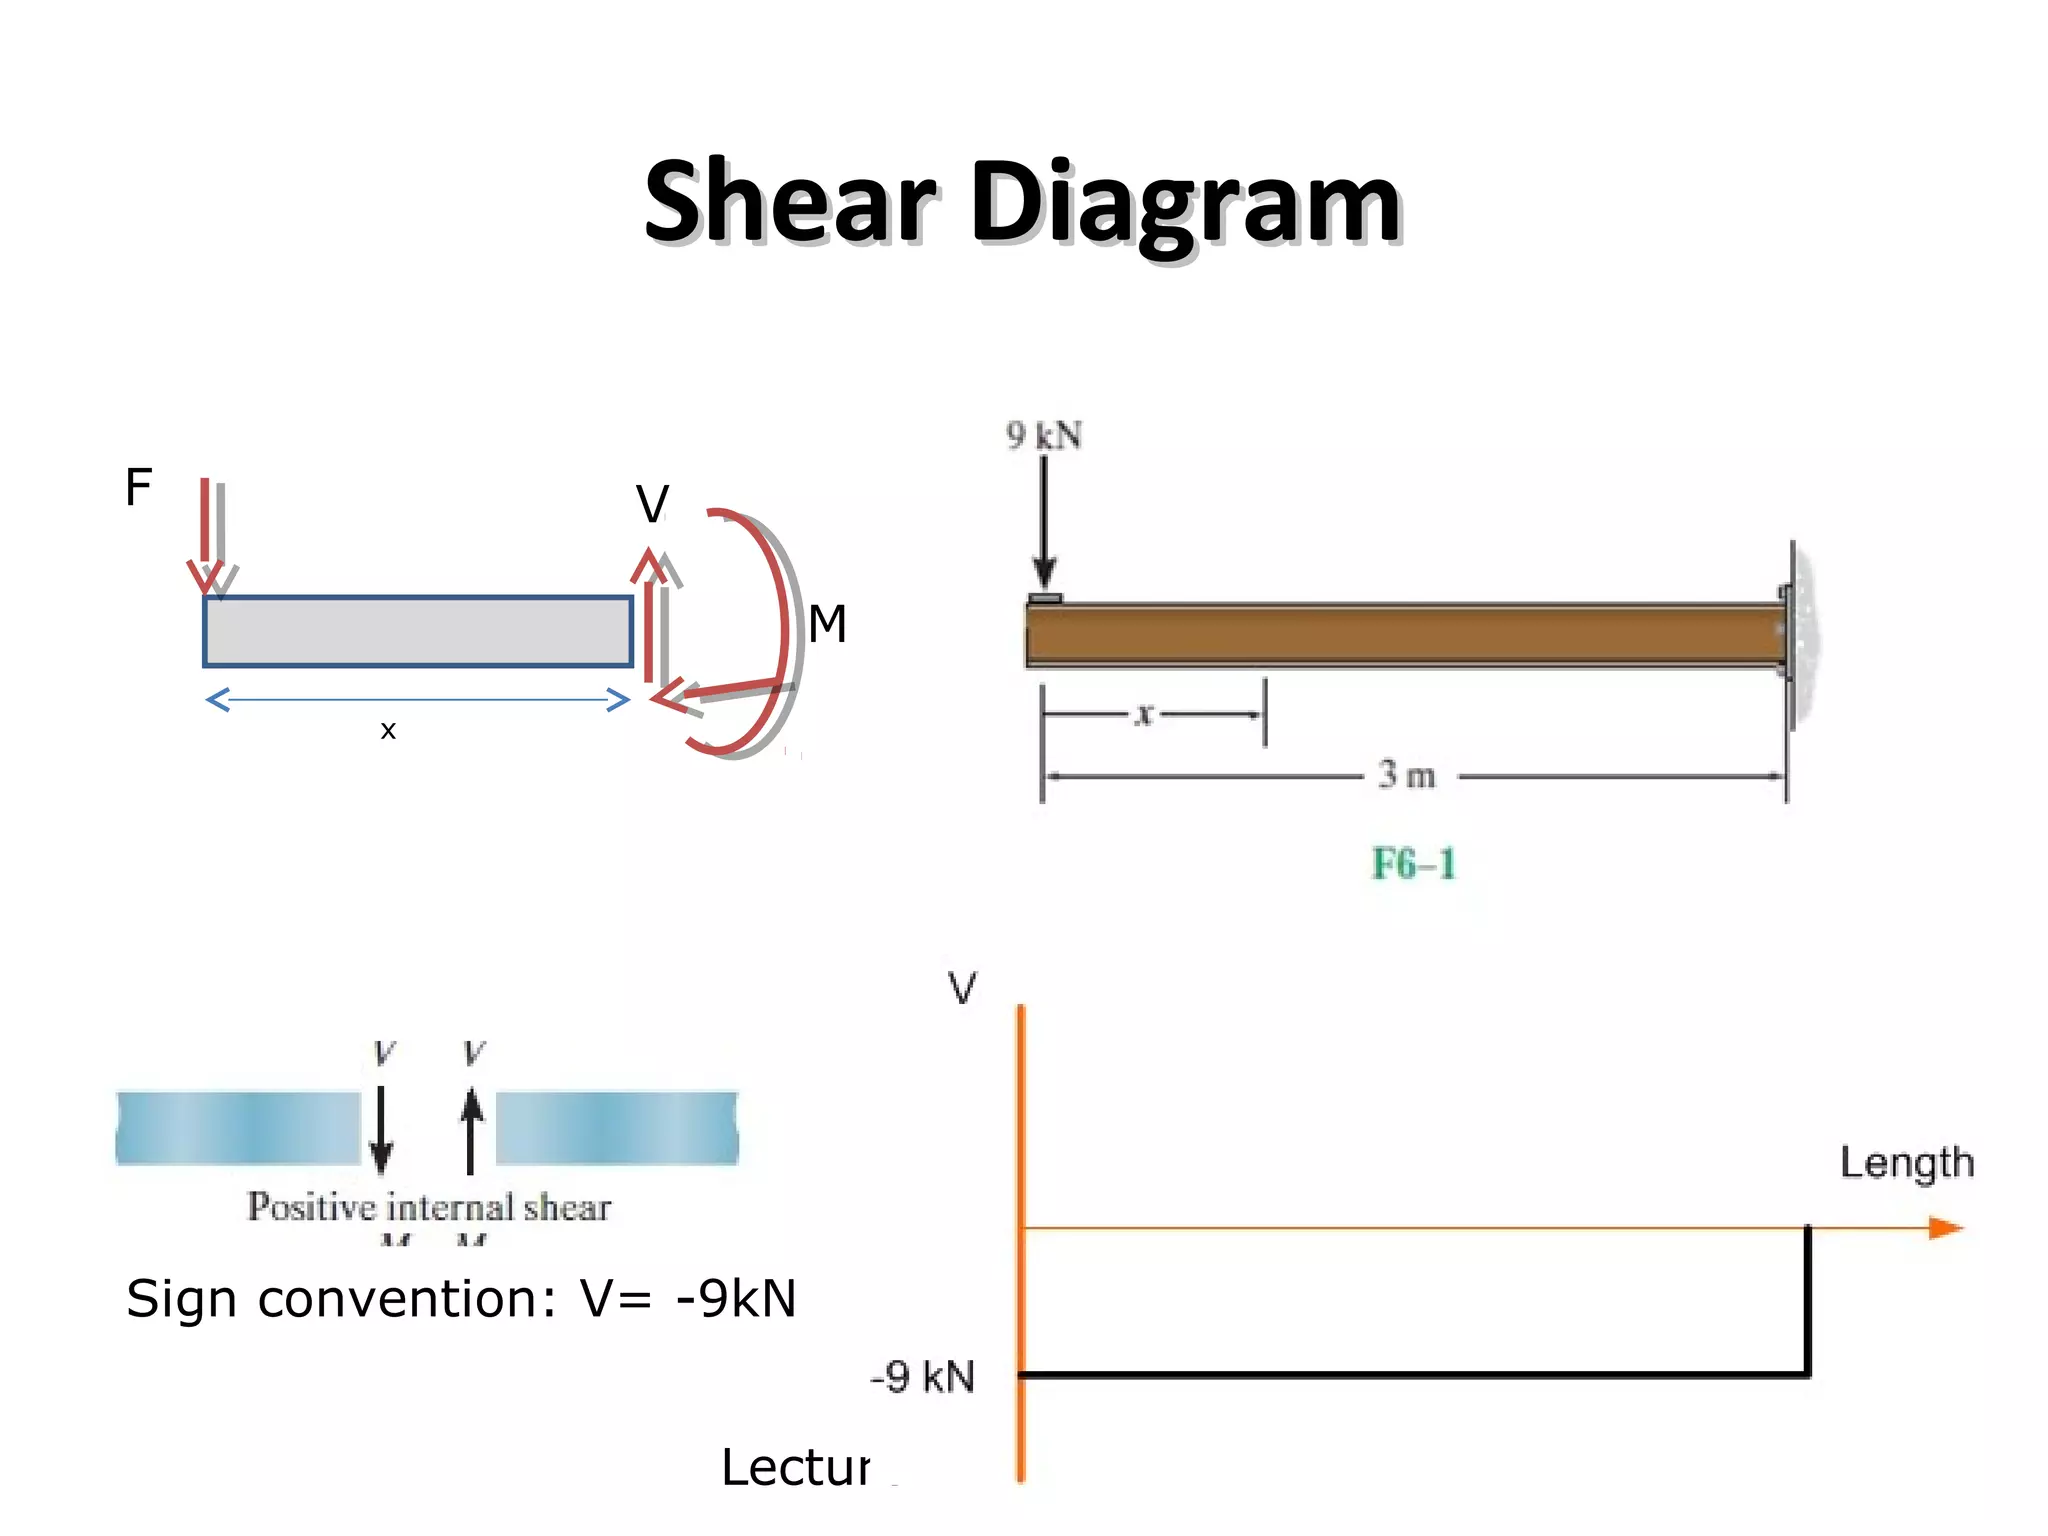
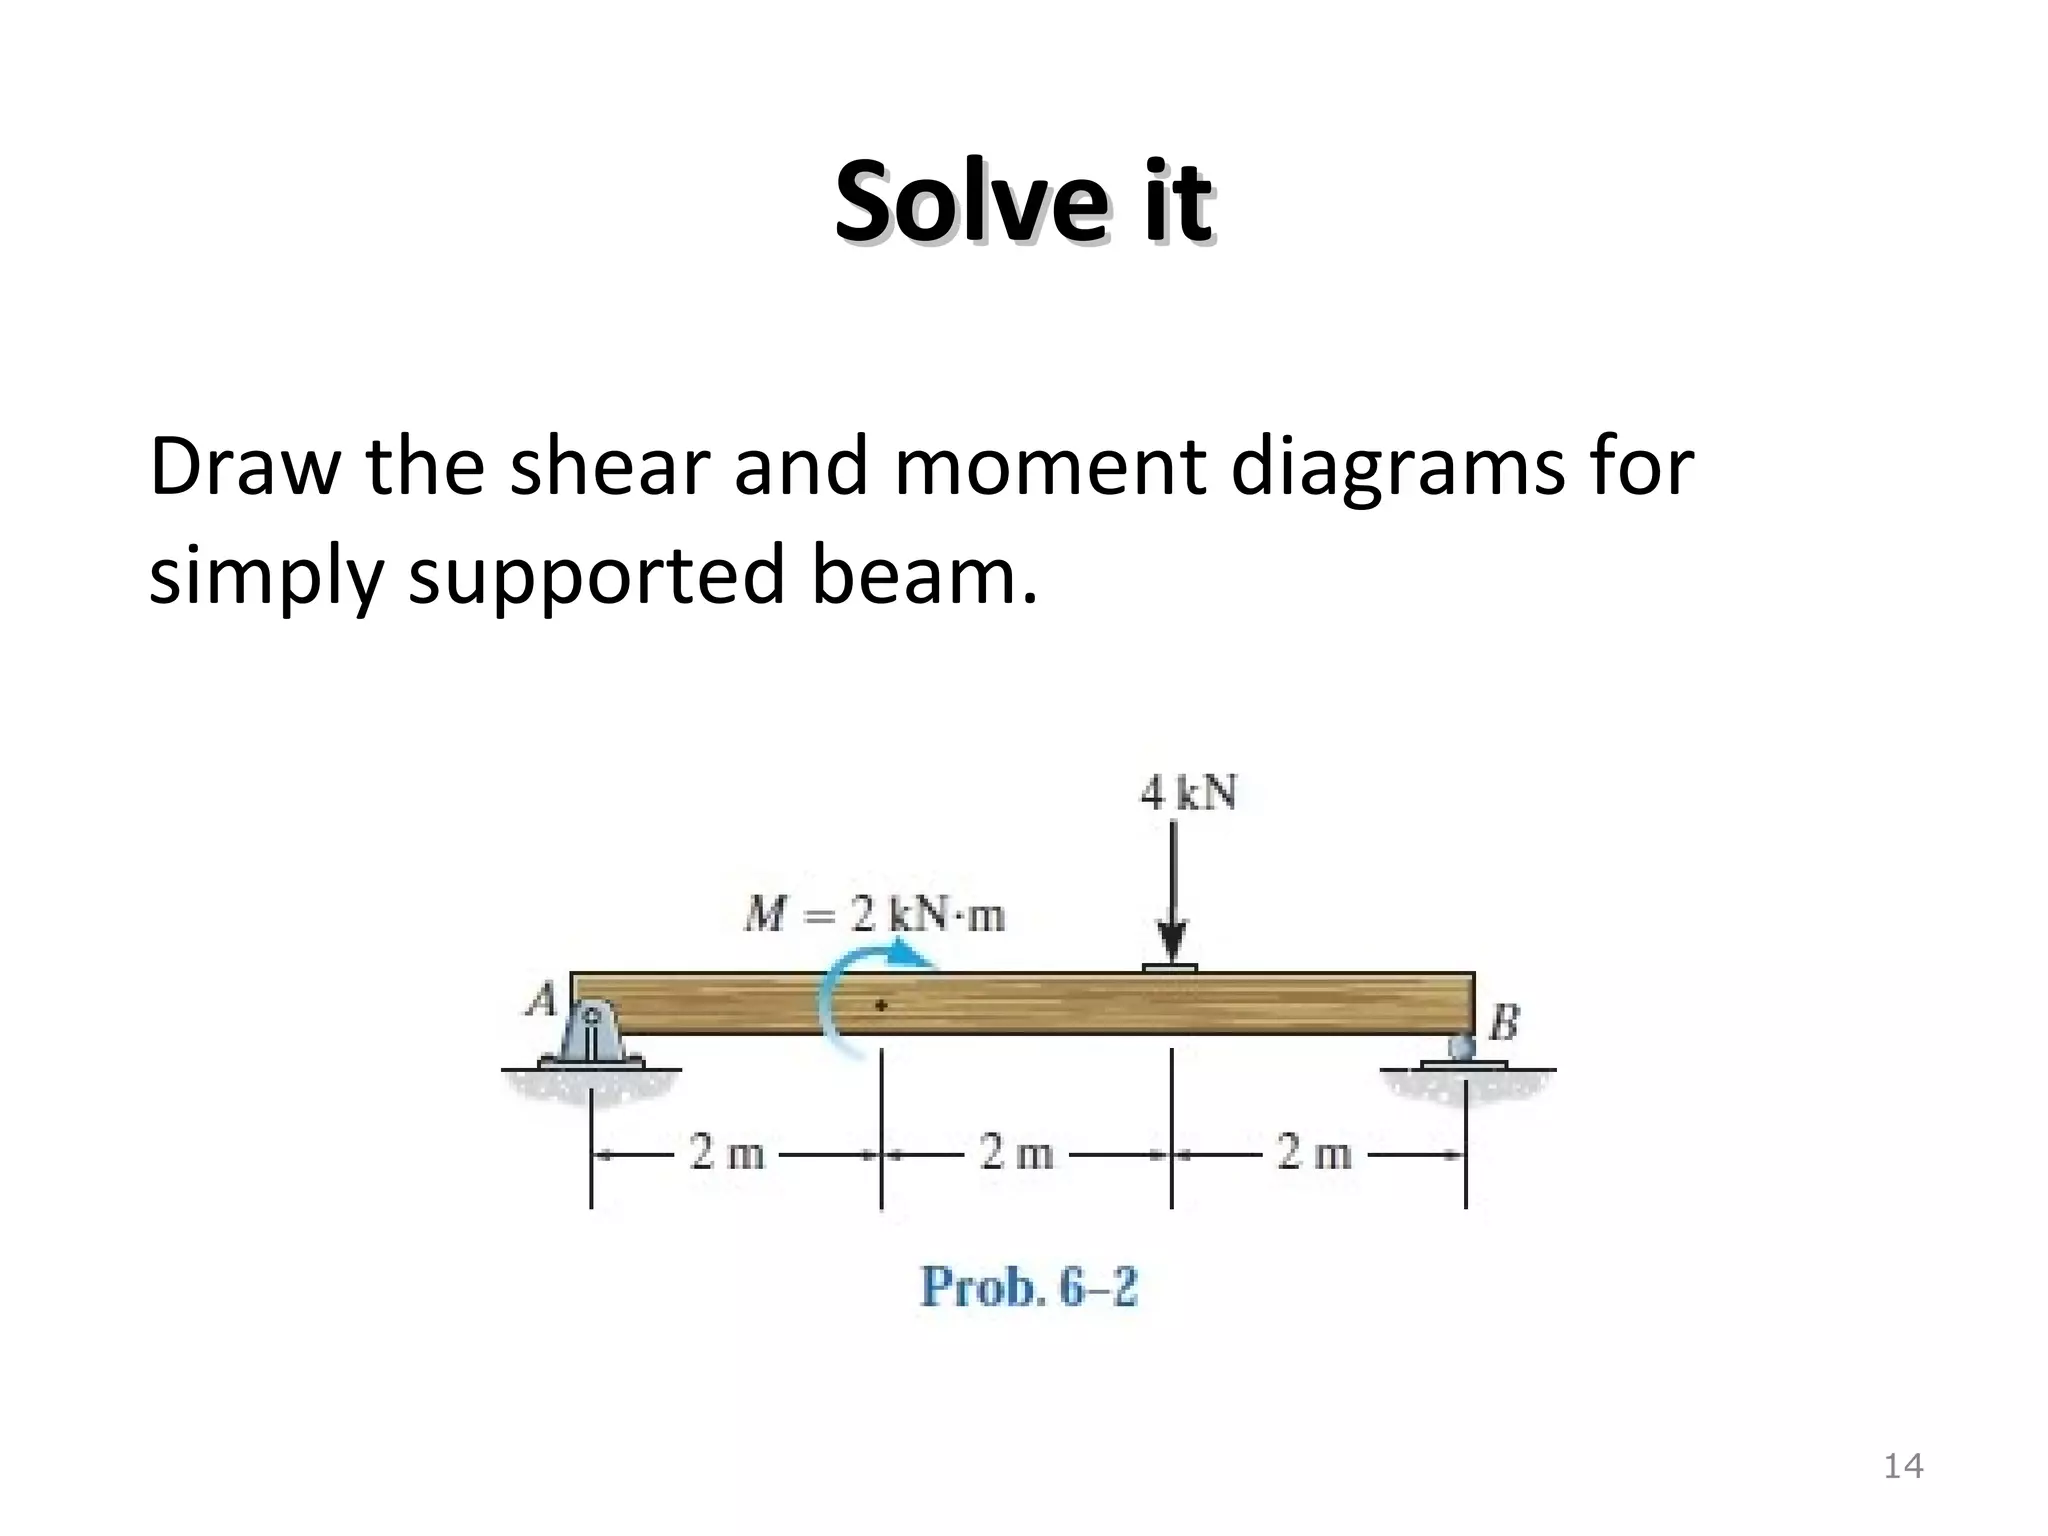
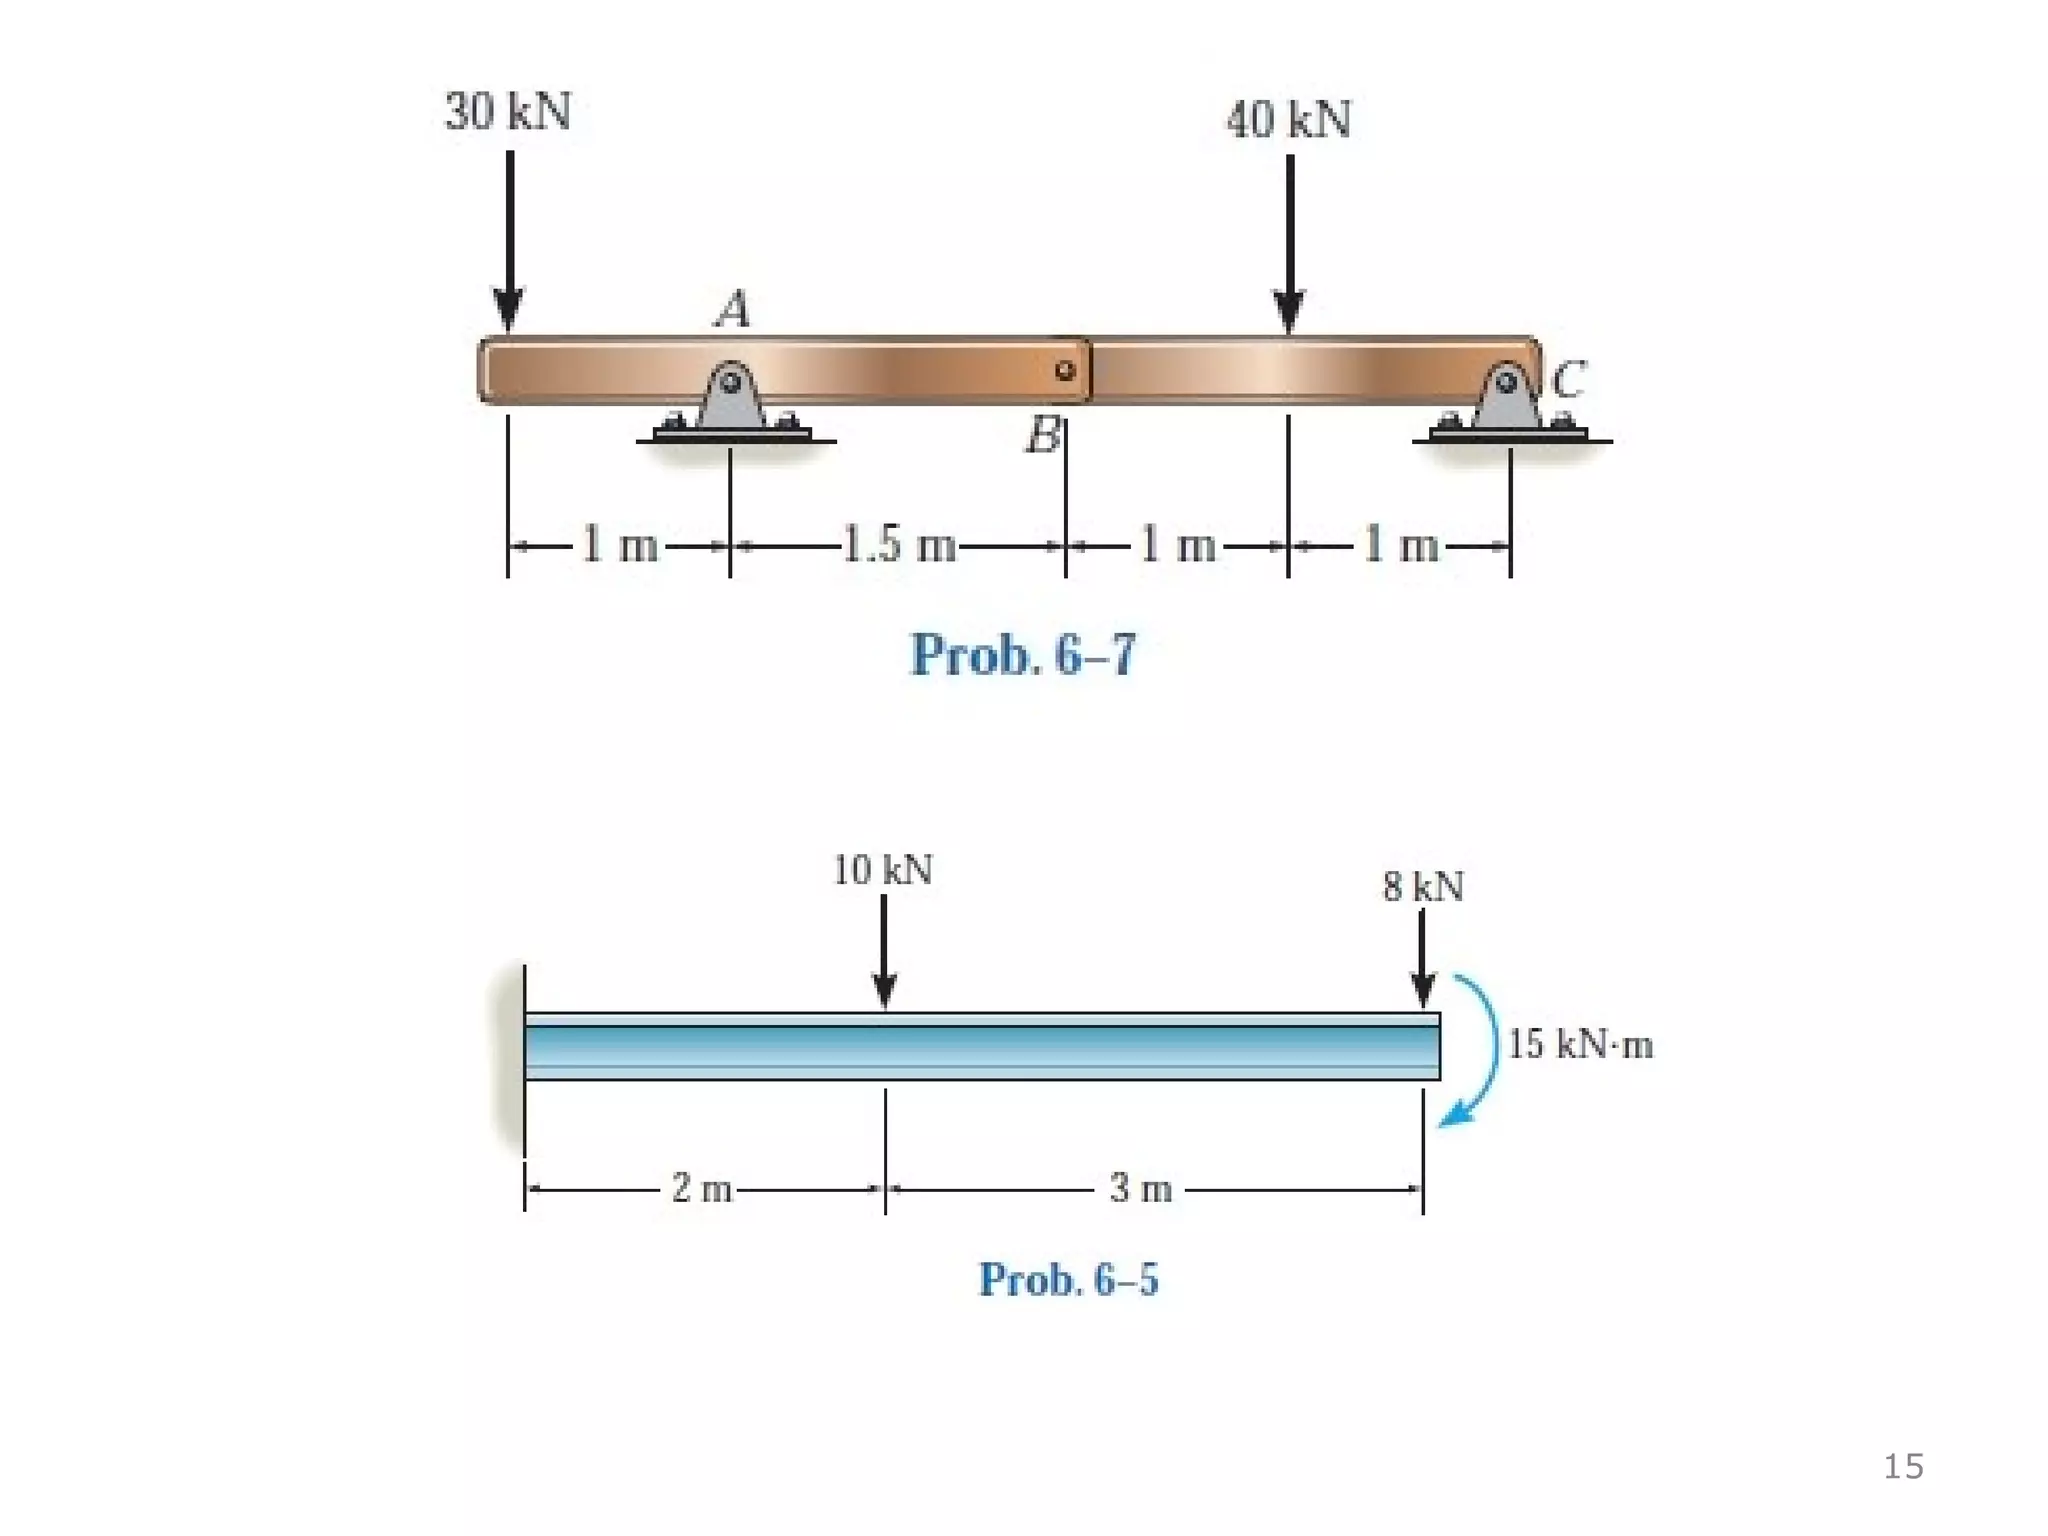
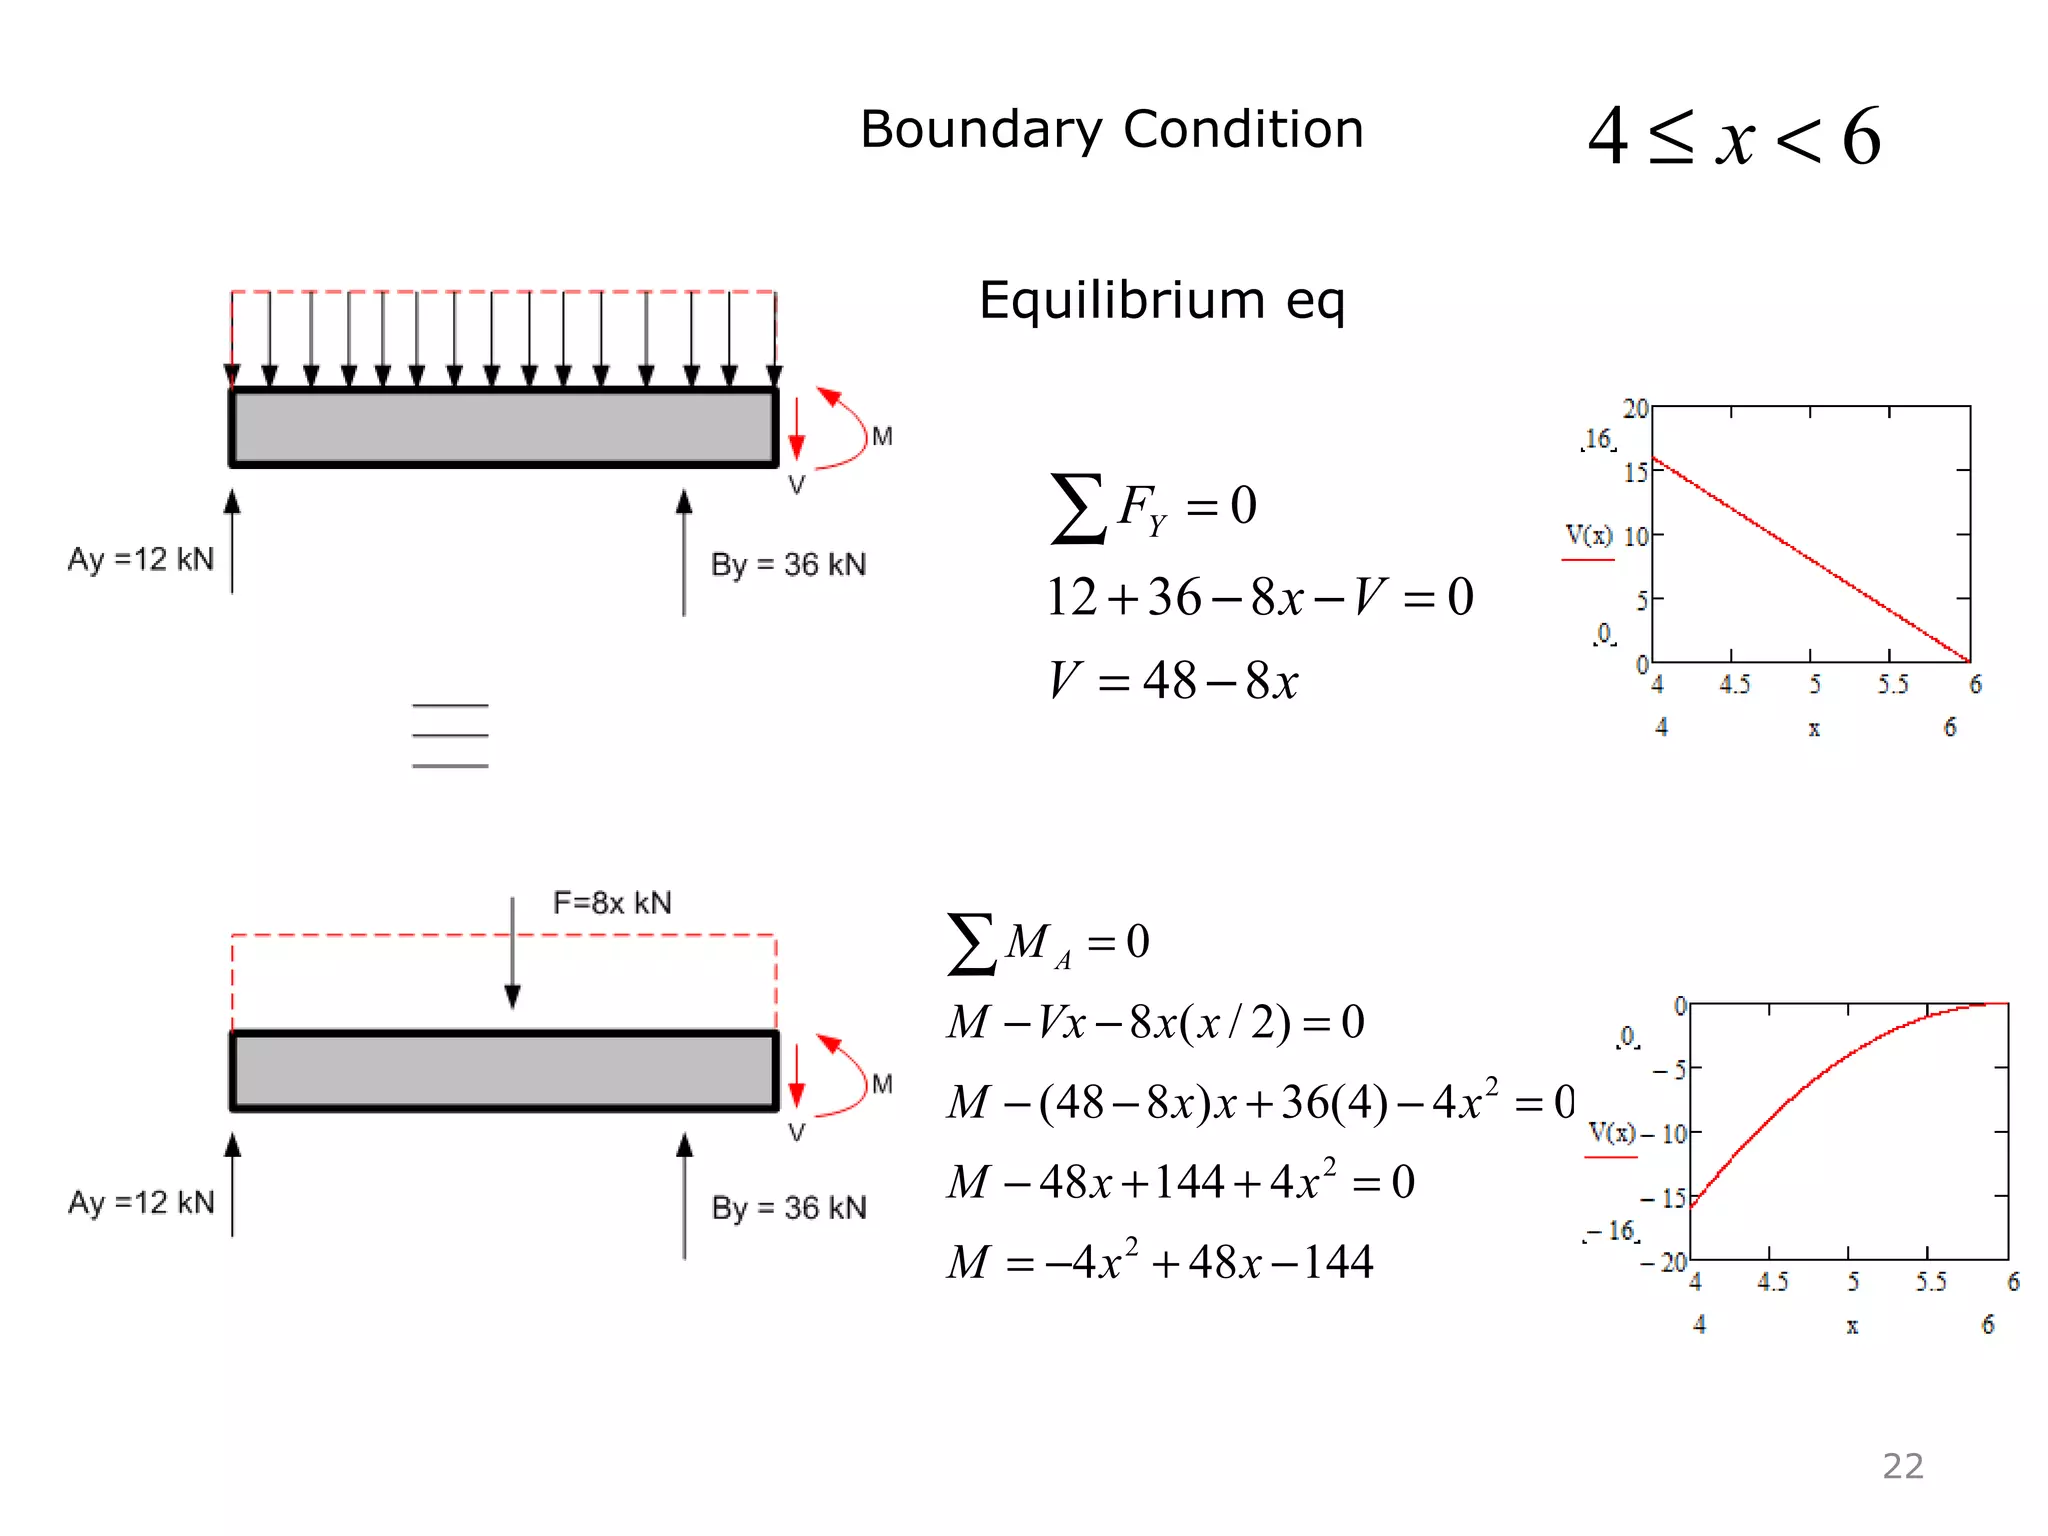
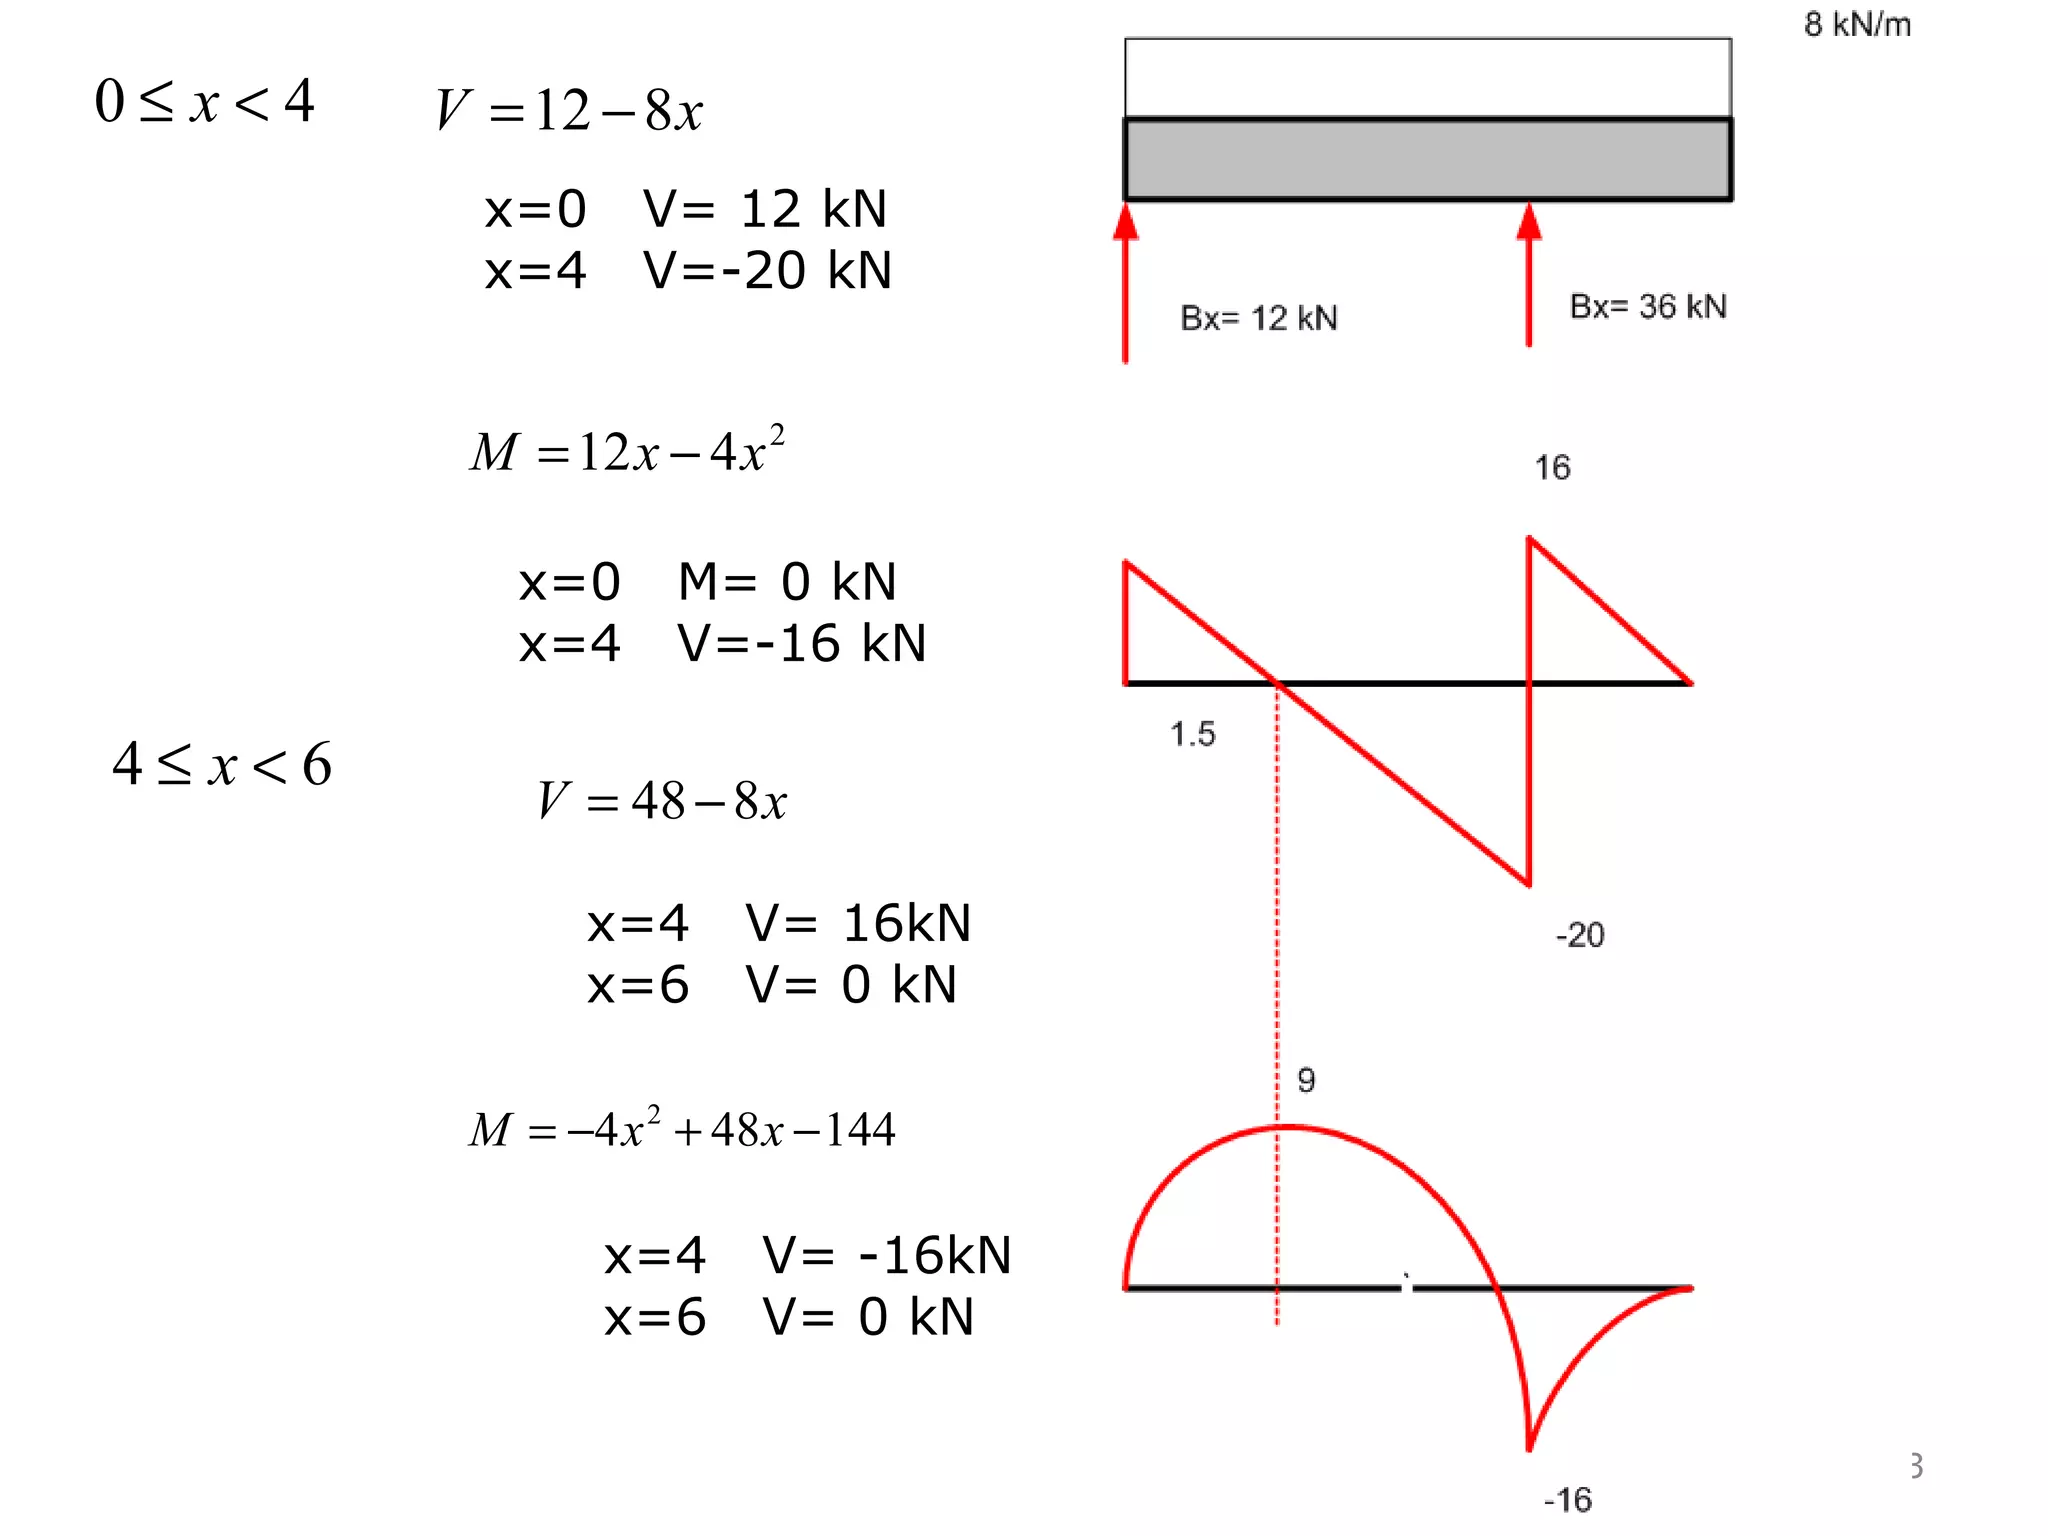
1) The document discusses shear and moment diagrams which graphically show the internal shear and moment forces acting on structural members. 2) It also discusses types of beams including simply supported, continuous, and cantilever beams. 3) Examples are provided for constructing shear and moment diagrams by taking the sum of moments and forces equal to zero and drawing the resulting diagrams based on the boundary conditions.


