SlideShare a Scribd company logo
1 of 6
Download to read offline
1TTT diagram
Time-Temperature-Transformation (TTT ) Diagram
T (Time) T(Temperature) T(Transformation) diagram is a plot of temperature versus the logarithm of time
for a steel alloy of definite composition. It is used to determine when transformations begin and end for an
isothermal (constant temperature) heat treatment of a previously austenitized alloy. When austenite is
cooled slowly to a temperature below LCT (Lower Critical Temperature), the structure that is formed is
Pearlite. As the cooling rate increases, the pearlite transformation temperature gets lower. The
microstructure of the material is significantly altered as the cooling rate increases. By heating and cooling
a series of samples, the history of the austenite transformation may be recorded. TTT diagram indicates
when a specific transformation starts and ends and it also shows what percentage of transformation of
austenite at a particular temperature is achieved.
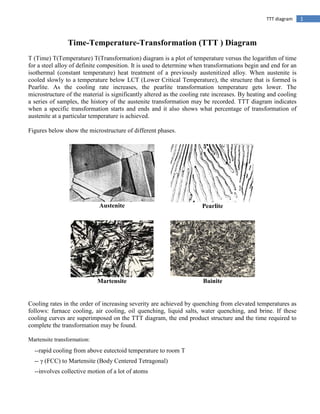
Figures below show the microstructure of different phases.
Austenite Pearlite
Martensite Bainite
Cooling rates in the order of increasing severity are achieved by quenching from elevated temperatures as
follows: furnace cooling, air cooling, oil quenching, liquid salts, water quenching, and brine. If these
cooling curves are superimposed on the TTT diagram, the end product structure and the time required to
complete the transformation may be found.
Martensite transformation:
--rapid cooling from above eutectoid temperature to room T
-- γ (FCC) to Martensite (Body Centered Tetragonal)
--involves collective motion of a lot of atoms
2TTT diagram
In Figure 1 the area on the left of the transformation curve represents the austenite region. Austenite is
stable at temperatures above LCT but unstable below LCT. Left curve indicates the start of a
transformation and right curve represents the finish of a transformation. The area between the two curves
indicates the transformation of austenite to different types of crystal structures. (Austenite to pearlite,
austenite to martensite, austenite to bainite transformation.) Isothermal Transform Diagram shows that γ to
transformation (a) is rapid! at speed of sound; (b) the percentage of transformation depends on Temperature
only:
Figure 1. TTT Diagram
Figure 2 represents the upper half of the TTT diagram. As indicated in Figure 2, when austenite is cooled
to temperatures below LCT, it transforms to other crystal structures due to its unstable nature. A specific
cooling rate may be chosen so that the transformation of austenite can be 50 %, 100 % etc. If the cooling
rate is very slow such as annealing process, the cooling curve passes through the entire transformation
area and the end product of this the cooling process becomes 100% Pearlite. In other words, when slow
cooling is applied, all the Austenite will transform to Pearlite. If the cooling curve passes through the
middle of the transformation area, the end product is 50 % Austenite and 50 % Pearlite, which means that
at certain cooling rates we can retain part of the Austenite, without transforming it into Pearlite.
3TTT diagram
Figure 2. Upper half of TTT Diagram(Austenite-Pearlite Transformation Area)
Figure 3 indicates the types of transformation that can be found at higher cooling rates. If a cooling rate is
very high, the cooling curve will remain on the left hand side of the Transformation Start curve. In this
case all Austenite will transform to Martensite. If there is no interruption in cooling the end product will
be martensite.
Figure 3. Lower half of TTT Diagram (Austenite-Martensite and Bainite Transformation Areas)
In Figure 4 the cooling rates A and B indicate two rapid cooling processes. In this case curve A will cause
a higher distortion and a higher internal stresses than the cooling rate B. The end product of both cooling
rates will be martensite. Cooling rate B is also known as the Critical Cooling Rate, which is represented
by a cooling curve that is tangent to the nose of the TTT diagram. Critical Cooling Rate is defined as the
lowest cooling rate which produces 100% Martensite while minimizing the internal stresses and
distortions.
4TTT diagram
Figure 4. Rapid Quench
In Figure 5, a rapid quenching process is interrupted (horizontal line represents the interruption) by
immersing the material in a molten salt bath and soaking at a constant temperature followed by another
cooling process that passes through Bainite region of TTT diagram. The end product is Bainite, which is
not as hard as Martensite. As a result of cooling rate D; more dimensional stability, less distortion and less
internal stresses are created.
Figure 5. Interrupted Quench
In Figure 6 cooling curve C represents a slow cooling process, such as furnace cooling. An example for
this type of cooling is annealing process where all the Austenite is allowed to transform to Pearlite as a
result of slow cooling.
5TTT diagram
Figure 6. Slow cooling process (Annealing)
Sometimes the cooling curve may pass through the middle of the Austenite-Pearlite transformation zone.
In Figure 7, cooling curve E indicates a cooling rate which is not high enough to produce 100%
martensite. This can be observed easily by looking at the TTT diagram. Since the cooling curve E is not
tangent to the nose of the transformation diagram, austenite is transformed to 50% Pearlite (curve E is
tangent to 50% curve). Since curve E leaves the transformation diagram at the Martensite zone, the
remaining 50 % of the Austenite will be transformed to Martensite.
Figure 7. Cooling rate that permits both pearlite and martensite formation.
6TTT diagram
Figure 8. TTT Diagram and microstructures obtained by different types of cooling rates
Figure 9. Dependence of mechanical properties on microstructures.

More Related Content

What's hot

Iron carbon phase diagram & basic definations
Iron carbon phase diagram & basic definationsIron carbon phase diagram & basic definations
Iron carbon phase diagram & basic definationsonlinemetallurgy.com
 
Lect-4 Iron Carbon Equilibrium Diagram
Lect-4 Iron Carbon Equilibrium DiagramLect-4 Iron Carbon Equilibrium Diagram
Lect-4 Iron Carbon Equilibrium Diagramrambansal37
 
CCt Curve (continuos cooling transformation)
CCt Curve (continuos cooling transformation)CCt Curve (continuos cooling transformation)
CCt Curve (continuos cooling transformation)Avinash Navin
 
2 ME casting & solidification
2 ME  casting & solidification 2 ME  casting & solidification
2 ME casting & solidification pavankumar chunduru
 
PPT on HEAT PIPES
PPT on HEAT PIPES PPT on HEAT PIPES
PPT on HEAT PIPES Sumit Singh
 
TTT diagram of eutectoid steel and martensitic transformation
TTT diagram of eutectoid steel and martensitic transformationTTT diagram of eutectoid steel and martensitic transformation
TTT diagram of eutectoid steel and martensitic transformationonlinemetallurgy.com
 
Heat treatment part 1
Heat treatment part 1Heat treatment part 1
Heat treatment part 1Naman Dave
 
Iron Carbon Phase Diagram
Iron Carbon Phase DiagramIron Carbon Phase Diagram
Iron Carbon Phase DiagramJose Surendran
 
Thermal conductivity presentation
Thermal conductivity presentationThermal conductivity presentation
Thermal conductivity presentationRoss Mayo
 
Iron Carbon Equilibrium Diagram
Iron Carbon Equilibrium DiagramIron Carbon Equilibrium Diagram
Iron Carbon Equilibrium DiagramAditi Rana
 
Chapter 9 phase diagrams 1
Chapter 9 phase diagrams 1Chapter 9 phase diagrams 1
Chapter 9 phase diagrams 1Meelu Qazi
 

What's hot (20)

Iron carbon phase diagram & basic definations
Iron carbon phase diagram & basic definationsIron carbon phase diagram & basic definations
Iron carbon phase diagram & basic definations
 
TMCT Introduction
TMCT IntroductionTMCT Introduction
TMCT Introduction
 
Solidification Mechanisms 1
Solidification Mechanisms 1Solidification Mechanisms 1
Solidification Mechanisms 1
 
Lect-4 Iron Carbon Equilibrium Diagram
Lect-4 Iron Carbon Equilibrium DiagramLect-4 Iron Carbon Equilibrium Diagram
Lect-4 Iron Carbon Equilibrium Diagram
 
CCt Curve (continuos cooling transformation)
CCt Curve (continuos cooling transformation)CCt Curve (continuos cooling transformation)
CCt Curve (continuos cooling transformation)
 
2 ME casting & solidification
2 ME  casting & solidification 2 ME  casting & solidification
2 ME casting & solidification
 
Heat treatment
Heat treatmentHeat treatment
Heat treatment
 
Chapter 7 Phase Equilibrium Diagram
Chapter 7 Phase Equilibrium DiagramChapter 7 Phase Equilibrium Diagram
Chapter 7 Phase Equilibrium Diagram
 
PPT on HEAT PIPES
PPT on HEAT PIPES PPT on HEAT PIPES
PPT on HEAT PIPES
 
TTT diagram of eutectoid steel and martensitic transformation
TTT diagram of eutectoid steel and martensitic transformationTTT diagram of eutectoid steel and martensitic transformation
TTT diagram of eutectoid steel and martensitic transformation
 
Surface hardening
Surface hardeningSurface hardening
Surface hardening
 
Heat treatment part 1
Heat treatment part 1Heat treatment part 1
Heat treatment part 1
 
TTT & CCT dia
TTT & CCT diaTTT & CCT dia
TTT & CCT dia
 
Chapter 3 phase diagram
Chapter 3 phase diagramChapter 3 phase diagram
Chapter 3 phase diagram
 
Iron Carbon Phase Diagram
Iron Carbon Phase DiagramIron Carbon Phase Diagram
Iron Carbon Phase Diagram
 
hardening
hardeninghardening
hardening
 
Iron carbon diagram presentation
Iron carbon diagram presentationIron carbon diagram presentation
Iron carbon diagram presentation
 
Thermal conductivity presentation
Thermal conductivity presentationThermal conductivity presentation
Thermal conductivity presentation
 
Iron Carbon Equilibrium Diagram
Iron Carbon Equilibrium DiagramIron Carbon Equilibrium Diagram
Iron Carbon Equilibrium Diagram
 
Chapter 9 phase diagrams 1
Chapter 9 phase diagrams 1Chapter 9 phase diagrams 1
Chapter 9 phase diagrams 1
 

Similar to Time-Temperature-Transformation Diagram (TTT Diagram)

TIME TEMPERATURE TRANSFORMATION DIAGRAM
TIME TEMPERATURE TRANSFORMATION DIAGRAMTIME TEMPERATURE TRANSFORMATION DIAGRAM
TIME TEMPERATURE TRANSFORMATION DIAGRAMChandra Kumar S
 
EM-Unit-IV- Ttt diagram
EM-Unit-IV- Ttt diagramEM-Unit-IV- Ttt diagram
EM-Unit-IV- Ttt diagramMohanumar S
 
time temperature transformation
time temperature transformationtime temperature transformation
time temperature transformationHamza Suharwardi
 
iso-thermal transformation of steel
iso-thermal transformation of steeliso-thermal transformation of steel
iso-thermal transformation of steelAbdul Rahman
 
Power piont ch2 phase-transformation-in-metals (1)
Power piont   ch2 phase-transformation-in-metals (1)Power piont   ch2 phase-transformation-in-metals (1)
Power piont ch2 phase-transformation-in-metals (1)temkin abdlkader
 
tttdiagram-131118222243-phpapp01.pptx
tttdiagram-131118222243-phpapp01.pptxtttdiagram-131118222243-phpapp01.pptx
tttdiagram-131118222243-phpapp01.pptxupender3
 
Phase transformation physical metallurgy
Phase transformation physical metallurgyPhase transformation physical metallurgy
Phase transformation physical metallurgyDeepak Patel
 
heat tratment & iron carbon diagram
heat tratment & iron carbon diagramheat tratment & iron carbon diagram
heat tratment & iron carbon diagrammukeshkumar2062
 
Time temperature transformation curves 2
Time temperature transformation curves 2Time temperature transformation curves 2
Time temperature transformation curves 2onlinemetallurgy.com
 
Heat treatment of materials
Heat treatment of materialsHeat treatment of materials
Heat treatment of materialsDivagar S
 

Similar to Time-Temperature-Transformation Diagram (TTT Diagram) (20)

Unit 3.pdf
Unit 3.pdfUnit 3.pdf
Unit 3.pdf
 
TTT DIAGRAM
TTT DIAGRAMTTT DIAGRAM
TTT DIAGRAM
 
TIME TEMPERATURE TRANSFORMATION DIAGRAM
TIME TEMPERATURE TRANSFORMATION DIAGRAMTIME TEMPERATURE TRANSFORMATION DIAGRAM
TIME TEMPERATURE TRANSFORMATION DIAGRAM
 
Ttt diagram
Ttt diagramTtt diagram
Ttt diagram
 
EM-Unit-IV- Ttt diagram
EM-Unit-IV- Ttt diagramEM-Unit-IV- Ttt diagram
EM-Unit-IV- Ttt diagram
 
time temperature transformation
time temperature transformationtime temperature transformation
time temperature transformation
 
Ttt cct
Ttt cctTtt cct
Ttt cct
 
iso-thermal transformation of steel
iso-thermal transformation of steeliso-thermal transformation of steel
iso-thermal transformation of steel
 
EMM lecture.ppt
EMM lecture.pptEMM lecture.ppt
EMM lecture.ppt
 
Power piont ch2 phase-transformation-in-metals (1)
Power piont   ch2 phase-transformation-in-metals (1)Power piont   ch2 phase-transformation-in-metals (1)
Power piont ch2 phase-transformation-in-metals (1)
 
tttdiagram-131118222243-phpapp01.pptx
tttdiagram-131118222243-phpapp01.pptxtttdiagram-131118222243-phpapp01.pptx
tttdiagram-131118222243-phpapp01.pptx
 
Phase transformation physical metallurgy
Phase transformation physical metallurgyPhase transformation physical metallurgy
Phase transformation physical metallurgy
 
heat tratment & iron carbon diagram
heat tratment & iron carbon diagramheat tratment & iron carbon diagram
heat tratment & iron carbon diagram
 
Time temperature transformation curves 2
Time temperature transformation curves 2Time temperature transformation curves 2
Time temperature transformation curves 2
 
CCT
CCTCCT
CCT
 
Two Component System:Binary Eutectic Phase Diagram
Two Component System:Binary Eutectic Phase DiagramTwo Component System:Binary Eutectic Phase Diagram
Two Component System:Binary Eutectic Phase Diagram
 
IRON CARBON EQUILIBRIUM DIAGRAM, TTT DIAGRAM AND HEAT TREATMENT
IRON CARBON EQUILIBRIUM DIAGRAM, TTT DIAGRAM AND HEAT TREATMENTIRON CARBON EQUILIBRIUM DIAGRAM, TTT DIAGRAM AND HEAT TREATMENT
IRON CARBON EQUILIBRIUM DIAGRAM, TTT DIAGRAM AND HEAT TREATMENT
 
Phase transformation
Phase transformationPhase transformation
Phase transformation
 
IRON-IRON CARBIDE Phase Diagram
IRON-IRON CARBIDE Phase DiagramIRON-IRON CARBIDE Phase Diagram
IRON-IRON CARBIDE Phase Diagram
 
Heat treatment of materials
Heat treatment of materialsHeat treatment of materials
Heat treatment of materials
 

Recently uploaded

IMPLICATIONS OF THE ABOVE HOLISTIC UNDERSTANDING OF HARMONY ON PROFESSIONAL E...
IMPLICATIONS OF THE ABOVE HOLISTIC UNDERSTANDING OF HARMONY ON PROFESSIONAL E...IMPLICATIONS OF THE ABOVE HOLISTIC UNDERSTANDING OF HARMONY ON PROFESSIONAL E...
IMPLICATIONS OF THE ABOVE HOLISTIC UNDERSTANDING OF HARMONY ON PROFESSIONAL E...RajaP95
 
VIP Call Girls Service Hitech City Hyderabad Call +91-8250192130
VIP Call Girls Service Hitech City Hyderabad Call +91-8250192130VIP Call Girls Service Hitech City Hyderabad Call +91-8250192130
VIP Call Girls Service Hitech City Hyderabad Call +91-8250192130Suhani Kapoor
 
UNIT-III FMM. DIMENSIONAL ANALYSIS
UNIT-III FMM.        DIMENSIONAL ANALYSISUNIT-III FMM.        DIMENSIONAL ANALYSIS
UNIT-III FMM. DIMENSIONAL ANALYSISrknatarajan
 
VIP Call Girls Service Kondapur Hyderabad Call +91-8250192130
VIP Call Girls Service Kondapur Hyderabad Call +91-8250192130VIP Call Girls Service Kondapur Hyderabad Call +91-8250192130
VIP Call Girls Service Kondapur Hyderabad Call +91-8250192130Suhani Kapoor
 
(MEERA) Dapodi Call Girls Just Call 7001035870 [ Cash on Delivery ] Pune Escorts
(MEERA) Dapodi Call Girls Just Call 7001035870 [ Cash on Delivery ] Pune Escorts(MEERA) Dapodi Call Girls Just Call 7001035870 [ Cash on Delivery ] Pune Escorts
(MEERA) Dapodi Call Girls Just Call 7001035870 [ Cash on Delivery ] Pune Escortsranjana rawat
 
(TARA) Talegaon Dabhade Call Girls Just Call 7001035870 [ Cash on Delivery ] ...
(TARA) Talegaon Dabhade Call Girls Just Call 7001035870 [ Cash on Delivery ] ...(TARA) Talegaon Dabhade Call Girls Just Call 7001035870 [ Cash on Delivery ] ...
(TARA) Talegaon Dabhade Call Girls Just Call 7001035870 [ Cash on Delivery ] ...ranjana rawat
 
OSVC_Meta-Data based Simulation Automation to overcome Verification Challenge...
OSVC_Meta-Data based Simulation Automation to overcome Verification Challenge...OSVC_Meta-Data based Simulation Automation to overcome Verification Challenge...
OSVC_Meta-Data based Simulation Automation to overcome Verification Challenge...Soham Mondal
 
Introduction to Multiple Access Protocol.pptx
Introduction to Multiple Access Protocol.pptxIntroduction to Multiple Access Protocol.pptx
Introduction to Multiple Access Protocol.pptxupamatechverse
 
APPLICATIONS-AC/DC DRIVES-OPERATING CHARACTERISTICS
APPLICATIONS-AC/DC DRIVES-OPERATING CHARACTERISTICSAPPLICATIONS-AC/DC DRIVES-OPERATING CHARACTERISTICS
APPLICATIONS-AC/DC DRIVES-OPERATING CHARACTERISTICSKurinjimalarL3
 
Call Girls in Nagpur Suman Call 7001035870 Meet With Nagpur Escorts
Call Girls in Nagpur Suman Call 7001035870 Meet With Nagpur EscortsCall Girls in Nagpur Suman Call 7001035870 Meet With Nagpur Escorts
Call Girls in Nagpur Suman Call 7001035870 Meet With Nagpur EscortsCall Girls in Nagpur High Profile
 
Decoding Kotlin - Your guide to solving the mysterious in Kotlin.pptx
Decoding Kotlin - Your guide to solving the mysterious in Kotlin.pptxDecoding Kotlin - Your guide to solving the mysterious in Kotlin.pptx
Decoding Kotlin - Your guide to solving the mysterious in Kotlin.pptxJoão Esperancinha
 
(PRIYA) Rajgurunagar Call Girls Just Call 7001035870 [ Cash on Delivery ] Pun...
(PRIYA) Rajgurunagar Call Girls Just Call 7001035870 [ Cash on Delivery ] Pun...(PRIYA) Rajgurunagar Call Girls Just Call 7001035870 [ Cash on Delivery ] Pun...
(PRIYA) Rajgurunagar Call Girls Just Call 7001035870 [ Cash on Delivery ] Pun...ranjana rawat
 
UNIT-V FMM.HYDRAULIC TURBINE - Construction and working
UNIT-V FMM.HYDRAULIC TURBINE - Construction and workingUNIT-V FMM.HYDRAULIC TURBINE - Construction and working
UNIT-V FMM.HYDRAULIC TURBINE - Construction and workingrknatarajan
 
High Profile Call Girls Nagpur Isha Call 7001035870 Meet With Nagpur Escorts
High Profile Call Girls Nagpur Isha Call 7001035870 Meet With Nagpur EscortsHigh Profile Call Girls Nagpur Isha Call 7001035870 Meet With Nagpur Escorts
High Profile Call Girls Nagpur Isha Call 7001035870 Meet With Nagpur Escortsranjana rawat
 
Coefficient of Thermal Expansion and their Importance.pptx
Coefficient of Thermal Expansion and their Importance.pptxCoefficient of Thermal Expansion and their Importance.pptx
Coefficient of Thermal Expansion and their Importance.pptxAsutosh Ranjan
 
the ladakh protest in leh ladakh 2024 sonam wangchuk.pptx
the ladakh protest in leh ladakh 2024 sonam wangchuk.pptxthe ladakh protest in leh ladakh 2024 sonam wangchuk.pptx
the ladakh protest in leh ladakh 2024 sonam wangchuk.pptxhumanexperienceaaa
 
Processing & Properties of Floor and Wall Tiles.pptx
Processing & Properties of Floor and Wall Tiles.pptxProcessing & Properties of Floor and Wall Tiles.pptx
Processing & Properties of Floor and Wall Tiles.pptxpranjaldaimarysona
 
HARMONY IN THE NATURE AND EXISTENCE - Unit-IV
HARMONY IN THE NATURE AND EXISTENCE - Unit-IVHARMONY IN THE NATURE AND EXISTENCE - Unit-IV
HARMONY IN THE NATURE AND EXISTENCE - Unit-IVRajaP95
 
Sheet Pile Wall Design and Construction: A Practical Guide for Civil Engineer...
Sheet Pile Wall Design and Construction: A Practical Guide for Civil Engineer...Sheet Pile Wall Design and Construction: A Practical Guide for Civil Engineer...
Sheet Pile Wall Design and Construction: A Practical Guide for Civil Engineer...Dr.Costas Sachpazis
 
Structural Analysis and Design of Foundations: A Comprehensive Handbook for S...
Structural Analysis and Design of Foundations: A Comprehensive Handbook for S...Structural Analysis and Design of Foundations: A Comprehensive Handbook for S...
Structural Analysis and Design of Foundations: A Comprehensive Handbook for S...Dr.Costas Sachpazis
 

Recently uploaded (20)

IMPLICATIONS OF THE ABOVE HOLISTIC UNDERSTANDING OF HARMONY ON PROFESSIONAL E...
IMPLICATIONS OF THE ABOVE HOLISTIC UNDERSTANDING OF HARMONY ON PROFESSIONAL E...IMPLICATIONS OF THE ABOVE HOLISTIC UNDERSTANDING OF HARMONY ON PROFESSIONAL E...
IMPLICATIONS OF THE ABOVE HOLISTIC UNDERSTANDING OF HARMONY ON PROFESSIONAL E...
 
VIP Call Girls Service Hitech City Hyderabad Call +91-8250192130
VIP Call Girls Service Hitech City Hyderabad Call +91-8250192130VIP Call Girls Service Hitech City Hyderabad Call +91-8250192130
VIP Call Girls Service Hitech City Hyderabad Call +91-8250192130
 
UNIT-III FMM. DIMENSIONAL ANALYSIS
UNIT-III FMM.        DIMENSIONAL ANALYSISUNIT-III FMM.        DIMENSIONAL ANALYSIS
UNIT-III FMM. DIMENSIONAL ANALYSIS
 
VIP Call Girls Service Kondapur Hyderabad Call +91-8250192130
VIP Call Girls Service Kondapur Hyderabad Call +91-8250192130VIP Call Girls Service Kondapur Hyderabad Call +91-8250192130
VIP Call Girls Service Kondapur Hyderabad Call +91-8250192130
 
(MEERA) Dapodi Call Girls Just Call 7001035870 [ Cash on Delivery ] Pune Escorts
(MEERA) Dapodi Call Girls Just Call 7001035870 [ Cash on Delivery ] Pune Escorts(MEERA) Dapodi Call Girls Just Call 7001035870 [ Cash on Delivery ] Pune Escorts
(MEERA) Dapodi Call Girls Just Call 7001035870 [ Cash on Delivery ] Pune Escorts
 
(TARA) Talegaon Dabhade Call Girls Just Call 7001035870 [ Cash on Delivery ] ...
(TARA) Talegaon Dabhade Call Girls Just Call 7001035870 [ Cash on Delivery ] ...(TARA) Talegaon Dabhade Call Girls Just Call 7001035870 [ Cash on Delivery ] ...
(TARA) Talegaon Dabhade Call Girls Just Call 7001035870 [ Cash on Delivery ] ...
 
OSVC_Meta-Data based Simulation Automation to overcome Verification Challenge...
OSVC_Meta-Data based Simulation Automation to overcome Verification Challenge...OSVC_Meta-Data based Simulation Automation to overcome Verification Challenge...
OSVC_Meta-Data based Simulation Automation to overcome Verification Challenge...
 
Introduction to Multiple Access Protocol.pptx
Introduction to Multiple Access Protocol.pptxIntroduction to Multiple Access Protocol.pptx
Introduction to Multiple Access Protocol.pptx
 
APPLICATIONS-AC/DC DRIVES-OPERATING CHARACTERISTICS
APPLICATIONS-AC/DC DRIVES-OPERATING CHARACTERISTICSAPPLICATIONS-AC/DC DRIVES-OPERATING CHARACTERISTICS
APPLICATIONS-AC/DC DRIVES-OPERATING CHARACTERISTICS
 
Call Girls in Nagpur Suman Call 7001035870 Meet With Nagpur Escorts
Call Girls in Nagpur Suman Call 7001035870 Meet With Nagpur EscortsCall Girls in Nagpur Suman Call 7001035870 Meet With Nagpur Escorts
Call Girls in Nagpur Suman Call 7001035870 Meet With Nagpur Escorts
 
Decoding Kotlin - Your guide to solving the mysterious in Kotlin.pptx
Decoding Kotlin - Your guide to solving the mysterious in Kotlin.pptxDecoding Kotlin - Your guide to solving the mysterious in Kotlin.pptx
Decoding Kotlin - Your guide to solving the mysterious in Kotlin.pptx
 
(PRIYA) Rajgurunagar Call Girls Just Call 7001035870 [ Cash on Delivery ] Pun...
(PRIYA) Rajgurunagar Call Girls Just Call 7001035870 [ Cash on Delivery ] Pun...(PRIYA) Rajgurunagar Call Girls Just Call 7001035870 [ Cash on Delivery ] Pun...
(PRIYA) Rajgurunagar Call Girls Just Call 7001035870 [ Cash on Delivery ] Pun...
 
UNIT-V FMM.HYDRAULIC TURBINE - Construction and working
UNIT-V FMM.HYDRAULIC TURBINE - Construction and workingUNIT-V FMM.HYDRAULIC TURBINE - Construction and working
UNIT-V FMM.HYDRAULIC TURBINE - Construction and working
 
High Profile Call Girls Nagpur Isha Call 7001035870 Meet With Nagpur Escorts
High Profile Call Girls Nagpur Isha Call 7001035870 Meet With Nagpur EscortsHigh Profile Call Girls Nagpur Isha Call 7001035870 Meet With Nagpur Escorts
High Profile Call Girls Nagpur Isha Call 7001035870 Meet With Nagpur Escorts
 
Coefficient of Thermal Expansion and their Importance.pptx
Coefficient of Thermal Expansion and their Importance.pptxCoefficient of Thermal Expansion and their Importance.pptx
Coefficient of Thermal Expansion and their Importance.pptx
 
the ladakh protest in leh ladakh 2024 sonam wangchuk.pptx
the ladakh protest in leh ladakh 2024 sonam wangchuk.pptxthe ladakh protest in leh ladakh 2024 sonam wangchuk.pptx
the ladakh protest in leh ladakh 2024 sonam wangchuk.pptx
 
Processing & Properties of Floor and Wall Tiles.pptx
Processing & Properties of Floor and Wall Tiles.pptxProcessing & Properties of Floor and Wall Tiles.pptx
Processing & Properties of Floor and Wall Tiles.pptx
 
HARMONY IN THE NATURE AND EXISTENCE - Unit-IV
HARMONY IN THE NATURE AND EXISTENCE - Unit-IVHARMONY IN THE NATURE AND EXISTENCE - Unit-IV
HARMONY IN THE NATURE AND EXISTENCE - Unit-IV
 
Sheet Pile Wall Design and Construction: A Practical Guide for Civil Engineer...
Sheet Pile Wall Design and Construction: A Practical Guide for Civil Engineer...Sheet Pile Wall Design and Construction: A Practical Guide for Civil Engineer...
Sheet Pile Wall Design and Construction: A Practical Guide for Civil Engineer...
 
Structural Analysis and Design of Foundations: A Comprehensive Handbook for S...
Structural Analysis and Design of Foundations: A Comprehensive Handbook for S...Structural Analysis and Design of Foundations: A Comprehensive Handbook for S...
Structural Analysis and Design of Foundations: A Comprehensive Handbook for S...
 

Time-Temperature-Transformation Diagram (TTT Diagram)

  • 1. 1TTT diagram Time-Temperature-Transformation (TTT ) Diagram T (Time) T(Temperature) T(Transformation) diagram is a plot of temperature versus the logarithm of time for a steel alloy of definite composition. It is used to determine when transformations begin and end for an isothermal (constant temperature) heat treatment of a previously austenitized alloy. When austenite is cooled slowly to a temperature below LCT (Lower Critical Temperature), the structure that is formed is Pearlite. As the cooling rate increases, the pearlite transformation temperature gets lower. The microstructure of the material is significantly altered as the cooling rate increases. By heating and cooling a series of samples, the history of the austenite transformation may be recorded. TTT diagram indicates when a specific transformation starts and ends and it also shows what percentage of transformation of austenite at a particular temperature is achieved. Figures below show the microstructure of different phases. Austenite Pearlite Martensite Bainite Cooling rates in the order of increasing severity are achieved by quenching from elevated temperatures as follows: furnace cooling, air cooling, oil quenching, liquid salts, water quenching, and brine. If these cooling curves are superimposed on the TTT diagram, the end product structure and the time required to complete the transformation may be found. Martensite transformation: --rapid cooling from above eutectoid temperature to room T -- γ (FCC) to Martensite (Body Centered Tetragonal) --involves collective motion of a lot of atoms
  • 2. 2TTT diagram In Figure 1 the area on the left of the transformation curve represents the austenite region. Austenite is stable at temperatures above LCT but unstable below LCT. Left curve indicates the start of a transformation and right curve represents the finish of a transformation. The area between the two curves indicates the transformation of austenite to different types of crystal structures. (Austenite to pearlite, austenite to martensite, austenite to bainite transformation.) Isothermal Transform Diagram shows that γ to transformation (a) is rapid! at speed of sound; (b) the percentage of transformation depends on Temperature only: Figure 1. TTT Diagram Figure 2 represents the upper half of the TTT diagram. As indicated in Figure 2, when austenite is cooled to temperatures below LCT, it transforms to other crystal structures due to its unstable nature. A specific cooling rate may be chosen so that the transformation of austenite can be 50 %, 100 % etc. If the cooling rate is very slow such as annealing process, the cooling curve passes through the entire transformation area and the end product of this the cooling process becomes 100% Pearlite. In other words, when slow cooling is applied, all the Austenite will transform to Pearlite. If the cooling curve passes through the middle of the transformation area, the end product is 50 % Austenite and 50 % Pearlite, which means that at certain cooling rates we can retain part of the Austenite, without transforming it into Pearlite.
  • 3. 3TTT diagram Figure 2. Upper half of TTT Diagram(Austenite-Pearlite Transformation Area) Figure 3 indicates the types of transformation that can be found at higher cooling rates. If a cooling rate is very high, the cooling curve will remain on the left hand side of the Transformation Start curve. In this case all Austenite will transform to Martensite. If there is no interruption in cooling the end product will be martensite. Figure 3. Lower half of TTT Diagram (Austenite-Martensite and Bainite Transformation Areas) In Figure 4 the cooling rates A and B indicate two rapid cooling processes. In this case curve A will cause a higher distortion and a higher internal stresses than the cooling rate B. The end product of both cooling rates will be martensite. Cooling rate B is also known as the Critical Cooling Rate, which is represented by a cooling curve that is tangent to the nose of the TTT diagram. Critical Cooling Rate is defined as the lowest cooling rate which produces 100% Martensite while minimizing the internal stresses and distortions.
  • 4. 4TTT diagram Figure 4. Rapid Quench In Figure 5, a rapid quenching process is interrupted (horizontal line represents the interruption) by immersing the material in a molten salt bath and soaking at a constant temperature followed by another cooling process that passes through Bainite region of TTT diagram. The end product is Bainite, which is not as hard as Martensite. As a result of cooling rate D; more dimensional stability, less distortion and less internal stresses are created. Figure 5. Interrupted Quench In Figure 6 cooling curve C represents a slow cooling process, such as furnace cooling. An example for this type of cooling is annealing process where all the Austenite is allowed to transform to Pearlite as a result of slow cooling.
  • 5. 5TTT diagram Figure 6. Slow cooling process (Annealing) Sometimes the cooling curve may pass through the middle of the Austenite-Pearlite transformation zone. In Figure 7, cooling curve E indicates a cooling rate which is not high enough to produce 100% martensite. This can be observed easily by looking at the TTT diagram. Since the cooling curve E is not tangent to the nose of the transformation diagram, austenite is transformed to 50% Pearlite (curve E is tangent to 50% curve). Since curve E leaves the transformation diagram at the Martensite zone, the remaining 50 % of the Austenite will be transformed to Martensite. Figure 7. Cooling rate that permits both pearlite and martensite formation.
  • 6. 6TTT diagram Figure 8. TTT Diagram and microstructures obtained by different types of cooling rates Figure 9. Dependence of mechanical properties on microstructures.