TRAFFIC ENGINEERING
TRAFFIC ENGINEERING
STUDIES
STUDIES
Dr.K. Krishnamurthy
Dr. K. Krishnamurthy
Associate Professor
Associate Professor
Department of Civil Engineering
Department of Civil Engineering
National Institute of Technology Calicut
National Institute of Technology Calicut
2.
INTRODUCTION
INTRODUCTION
►
► In
In planning,
planning,design,
design, operation
operation and
and management
management of
of
a
a highway
highway system
system need
need field
field data
data.
.
a
a highway
highway system
system need
need field
field data
data.
.
►
► Difficult
Difficult to
to assume
assume and
and generalize
generalize
►
► Difficult
Difficult to
to conduct
conduct in
in laboratories
laboratories
►
► Expensive
Expensive and
and time
time consuming
consuming
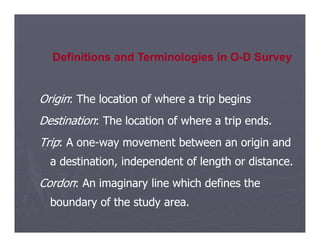
Origin
Origin: The locationof where a trip begins
: The location of where a trip begins
Destination
Destination: The location of where a trip ends.
: The location of where a trip ends.
Definitions and Terminologies in O-D Survey
Destination
Destination: The location of where a trip ends.
: The location of where a trip ends.
Trip
Trip: A one
: A one-
-way movement between an origin and
way movement between an origin and
a destination, independent of length or distance.
a destination, independent of length or distance.
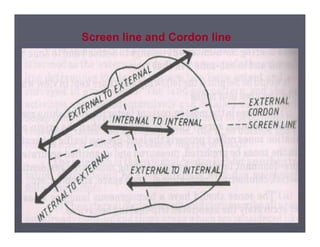
Cordon
Cordon: An imaginary line which defines the
: An imaginary line which defines the
boundary of the study area.
boundary of the study area.
6.
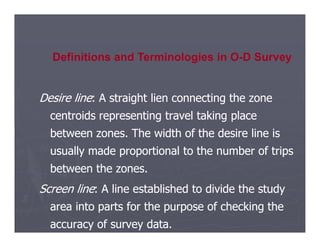
Desire line
Desire line:A straight lien connecting the zone
: A straight lien connecting the zone
centroids representing travel taking place
centroids representing travel taking place
Definitions and Terminologies in O-D Survey
between zones. The width of the desire line is
between zones. The width of the desire line is
usually made proportional to the number of trips
usually made proportional to the number of trips
between the zones.
between the zones.
Screen line
Screen line: A line established to divide the study
: A line established to divide the study
area into parts for the purpose of checking the
area into parts for the purpose of checking the
accuracy of survey data.
accuracy of survey data.
7.
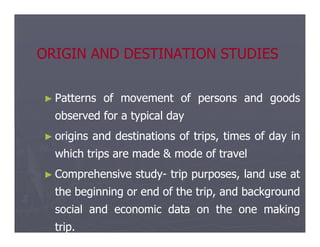
ORIGIN AND DESTINATIONSTUDIES
ORIGIN AND DESTINATION STUDIES
►
► Patterns
Patterns of
of movement
movement of
of persons
persons and
and goods
goods
observed
observed for
for a
a typical
typical day
day
►
► origins
origins and
and destinations
destinations of
of trips,
trips, times
times of
of day
day in
in
which
which trips
trips are
are made
made &
& mode
mode of
of travel
travel
►
► Comprehensive
Comprehensive study
study-
- trip
trip purposes,
purposes, land
land use
use at
at
the
the beginning
beginning or
or end
end of
of the
the trip,
trip, and
and background
background
social
social and
and economic
economic data
data on
on the
the one
one making
making
trip
trip.
.
8.
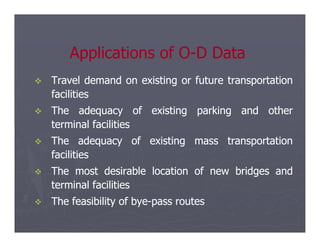
Travel
Travel demand
demandon
on existing
existing or
or future
future transportation
transportation
facilities
facilities
The
The adequacy
adequacy of
of existing
existing parking
parking and
and other
other
terminal
terminal facilities
facilities
Applications of O
Applications of O-
-D Data
D Data
terminal
terminal facilities
facilities
The
The adequacy
adequacy of
of existing
existing mass
mass transportation
transportation
facilities
facilities
The
The most
most desirable
desirable location
location of
of new
new bridges
bridges and
and
terminal
terminal facilities
facilities
The
The feasibility
feasibility of
of bye
bye-
-pass
pass routes
routes
9.
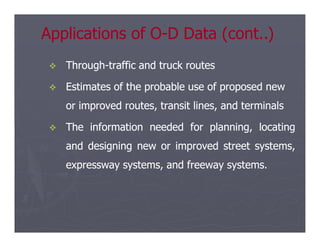
Through
Through-
-traffic andtruck routes
traffic and truck routes
Estimates of the probable use of proposed new
Estimates of the probable use of proposed new
or improved routes, transit lines, and terminals
or improved routes, transit lines, and terminals
The
The information
information needed
needed for
for planning,
planning, locating
locating
Applications of O
Applications of O-
-D Data (cont..)
D Data (cont..)
The
The information
information needed
needed for
for planning,
planning, locating
locating
and
and designing
designing new
new or
or improved
improved street
street systems,
systems,
expressway
expressway systems,
systems, and
and freeway
freeway systems
systems.
.
10.
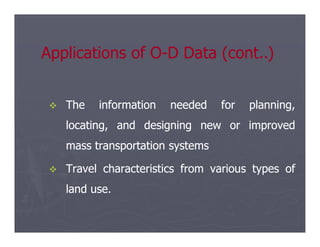
The
The information
informationneeded
needed for
for planning,
planning,
locating,
locating, and
and designing
designing new
new or
or improved
improved
Applications of O
Applications of O-
-D Data (cont..)
D Data (cont..)
locating,
locating, and
and designing
designing new
new or
or improved
improved
mass
mass transportation
transportation systems
systems
Travel
Travel characteristics
characteristics from
from various
various types
types of
of
land
land use
use.
.
11.
The
The means
meansfor
for estimating
estimating future
future travel
travel
patterns
patterns and
and requirements
requirements for
for transportation
transportation
Applications of O
Applications of O-
-D Data (cont..)
D Data (cont..)
patterns
patterns and
and requirements
requirements for
for transportation
transportation
facilities
facilities.
.
Construction
Construction priorities
priorities and
and economical
economical
solutions
solutions for
for improvement
improvement programmes
programmes.
.
12.
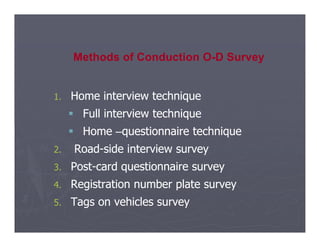
1.
1. Home interviewtechnique
Home interview technique
Full
Full interview
interview technique
technique
Methods of Conduction O-D Survey
Home
Home –
–questionnaire
questionnaire technique
technique
2.
2. Road
Road-
-side
side interview
interview survey
survey
3.
3. Post
Post-
-card
card questionnaire
questionnaire survey
survey
4.
4. Registration
Registration number
number plate
plate survey
survey
5.
5. Tags
Tags on
on vehicles
vehicles survey
survey
13.
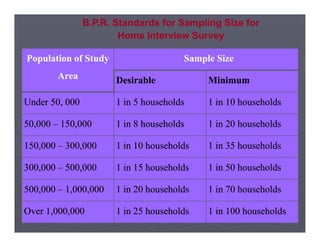
Population of Study
Populationof Study
Area
Area
Sample
Sample Size
Size
Desirable
Desirable Minimum
Minimum
Under
Under 50
50,
, 000
000 1
1 in
in 5
5 households
households 1
1 in
in 10
10 households
households
50
50,
,000
000 –
– 150
150,
,000
000 1
1 in
in 8
8 households
households 1
1 in
in 20
20 households
households
B.P.R. Standards for Sampling Size for
Home Interview Survey
50
50,
,000
000 –
– 150
150,
,000
000 1
1 in
in 8
8 households
households 1
1 in
in 20
20 households
households
150
150,
,000
000 –
– 300
300,
,000
000 1
1 in
in 10
10 households
households 1
1 in
in 35
35 households
households
300
300,
,000
000 –
– 500
500,
,000
000 1
1 in
in 15
15 households
households 1
1 in
in 50
50 households
households
500
500,
,000
000 –
– 1
1,
,000
000,
,000
000 1
1 in
in 20
20 households
households 1
1 in
in 70
70 households
households
Over
Over 1
1,
,000
000,
,000
000 1
1 in
in 25
25 households
households 1
1 in
in 100
100 households
households
14.
Use of ScreenLine Comparison
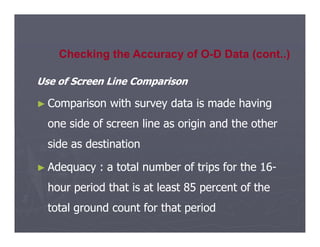
Use of Screen Line Comparison
Checking the Accuracy of O-D Data
►
► Screen lines are established in internal study
Screen lines are established in internal study
area
area
►
► Classified hourly volume counts are made at
Classified hourly volume counts are made at
each crossing of the screen line
each crossing of the screen line
Use of ScreenLine Comparison
Use of Screen Line Comparison
►
► Comparison with survey data is made having
Comparison with survey data is made having
one side of screen line as origin and the other
one side of screen line as origin and the other
Checking the Accuracy of O-D Data (cont..)
one side of screen line as origin and the other
one side of screen line as origin and the other
side as destination
side as destination
►
► Adequacy : a total number of trips for the 16
Adequacy : a total number of trips for the 16-
-
hour period that is at least 85 percent of the
hour period that is at least 85 percent of the
total ground count for that period
total ground count for that period
17.
Use of CordonLine Comparison
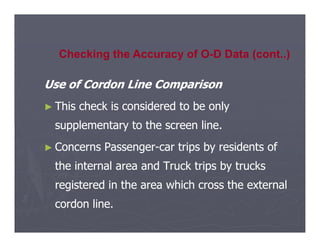
Use of Cordon Line Comparison
►
► This check is considered to be only
This check is considered to be only
supplementary to the screen line.
supplementary to the screen line.
Checking the Accuracy of O-D Data (cont..)
supplementary to the screen line.
supplementary to the screen line.
►
► Concerns Passenger
Concerns Passenger-
-car trips by residents of
car trips by residents of
the internal area and Truck trips by trucks
the internal area and Truck trips by trucks
registered in the area which cross the external
registered in the area which cross the external
cordon line.
cordon line.
18.
Use of CordonLine Comparison
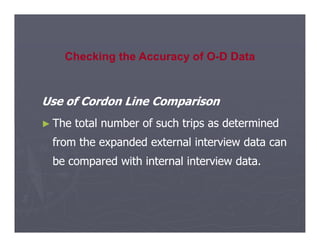
Use of Cordon Line Comparison
►
► The total number of such trips as determined
The total number of such trips as determined
Checking the Accuracy of O-D Data
►
► The total number of such trips as determined
The total number of such trips as determined
from the expanded external interview data can
from the expanded external interview data can
be compared with internal interview data.
be compared with internal interview data.
19.
O
O-
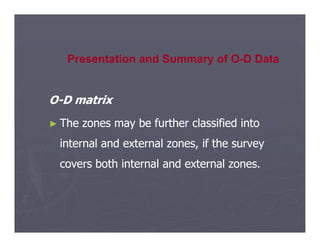
-D matrix
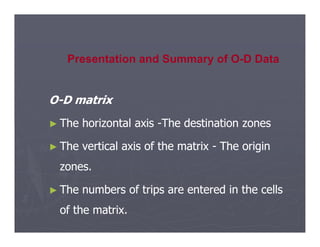
D matrix
►
►The horizontal axis
The horizontal axis -
-The destination zones
The destination zones
Presentation and Summary of O-D Data
►
► The horizontal axis
The horizontal axis -
-The destination zones
The destination zones
►
► The vertical axis of the matrix
The vertical axis of the matrix -
- The origin
The origin
zones.
zones.
►
► The numbers of trips are entered in the cells
The numbers of trips are entered in the cells
of the matrix.
of the matrix.
20.
O
O-
-D matrix
D matrix
►
►The zones may be further classified into
The zones may be further classified into
Presentation and Summary of O-D Data
►
► The zones may be further classified into
The zones may be further classified into
internal and external zones, if the survey
internal and external zones, if the survey
covers both internal and external zones.
covers both internal and external zones.
21.
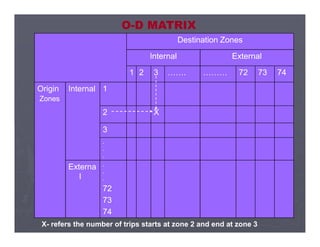
O-D MATRIX
Destination Zones
DestinationZones
Internal
Internal External
External
1
1 2
2 3
3 ……
…….
. ………
……… 72
72 73
73 74
74
Origin
Origin
Zones
Zones
Internal
Internal 1
1
2
2 X
X
3
3
.
.
.
.
.
.
Externa
Externa
l
l
.
.
.
.
.
.
72
72
73
73
74
74
X- refers the number of trips starts at zone 2 and end at zone 3
22.
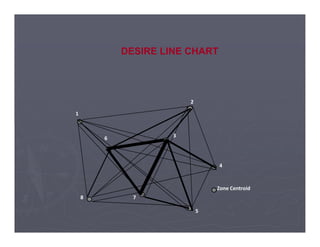
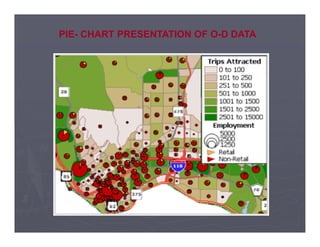
Desire
Desire line
line chart
chart
The
Thetrips
trips between
between any
any pair
pair of
of zones
zones are
are
Presentation of O-D Data (cont..)
►
► The
The trips
trips between
between any
any pair
pair of
of zones
zones are
are
represented
represented by
by a
a straight
straight line
line connecting
connecting the
the
centroids
centroids of
of the
the two
two zones
zones
►
► Band
Band width
width represent
represent the
the actual
actual volume
volume of
of
trips
trips


![Origin-Destn Survey [Compatibility Mode].pdf](https://image.slidesharecdn.com/o-dsurveycompatibilitymode-250423053753-1b143592/85/Origin-Destn-Survey-Compatibility-Mode-pdf-28-320.jpg)


![Rotary_Roundabout_Sams_03.12.14 [Compatibility Mode].pdf](https://cdn.slidesharecdn.com/ss_thumbnails/rotaryroundaboutsams03-250423055821-6dd85e6b-thumbnail.jpg?width=640&height=640&fit=bounds)


