
Downloaded 1,101 times
![Principles of Seismic Data Interpretation
M.M.Badawy
Page22
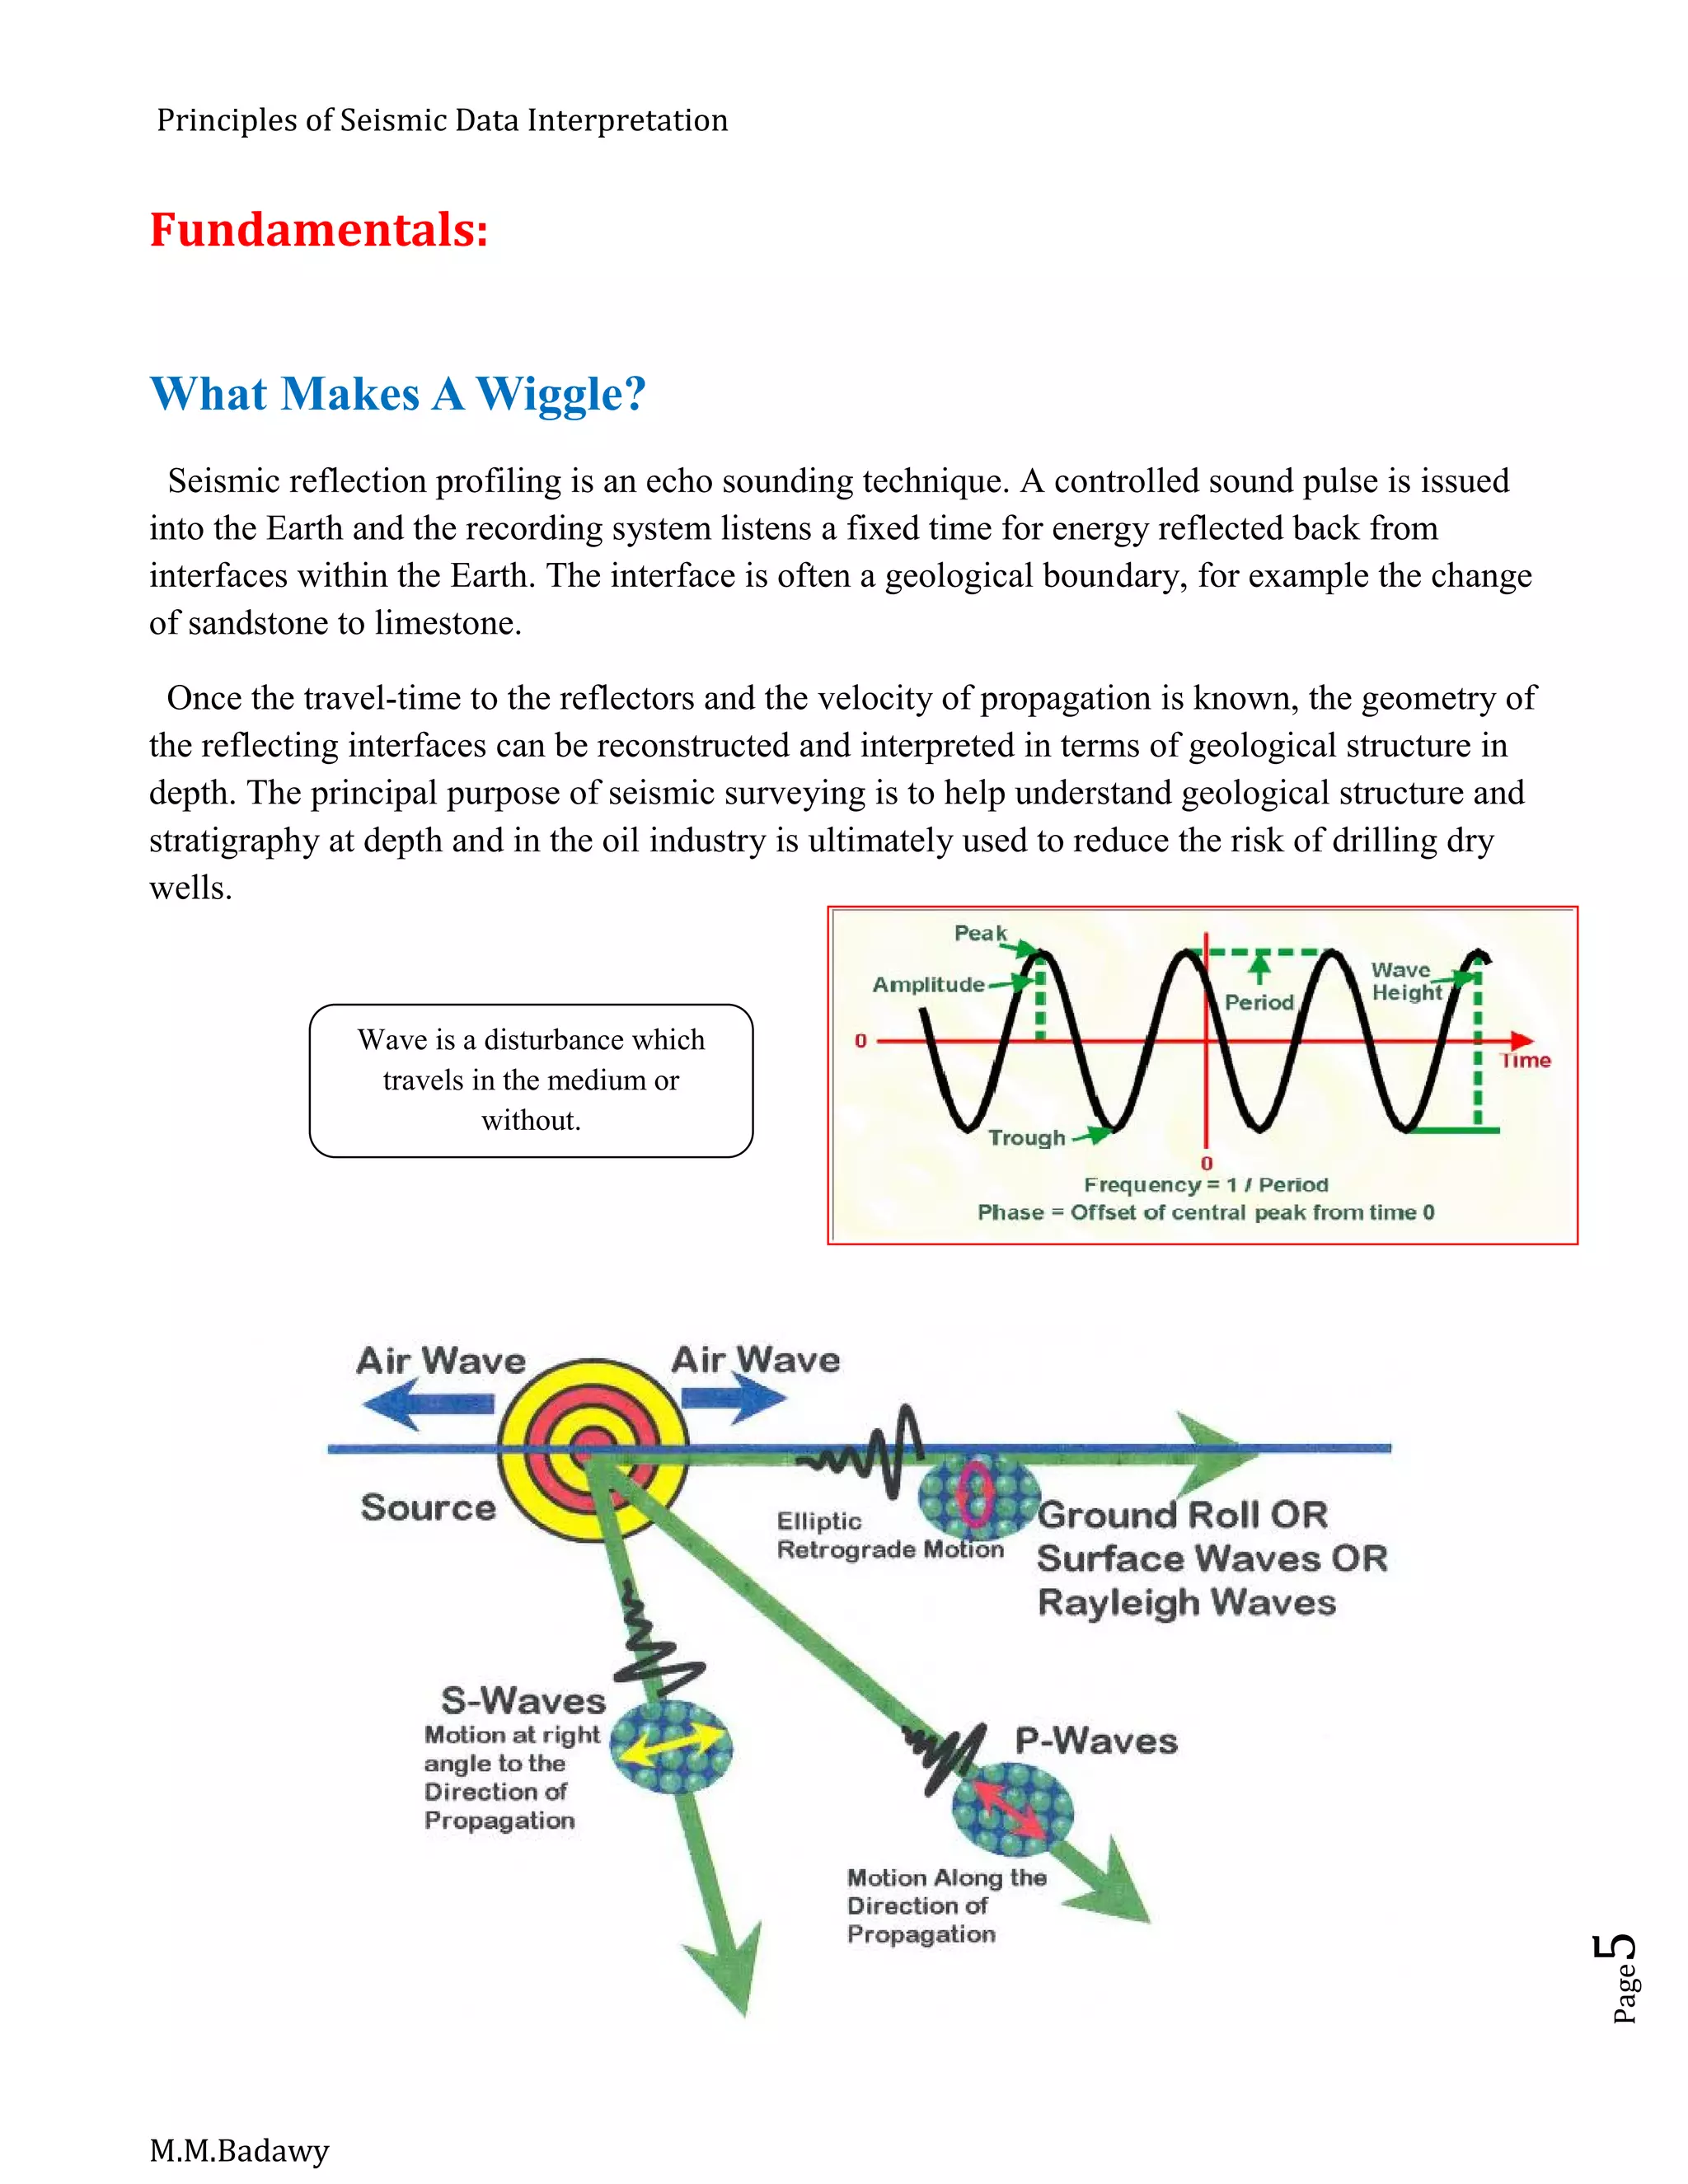
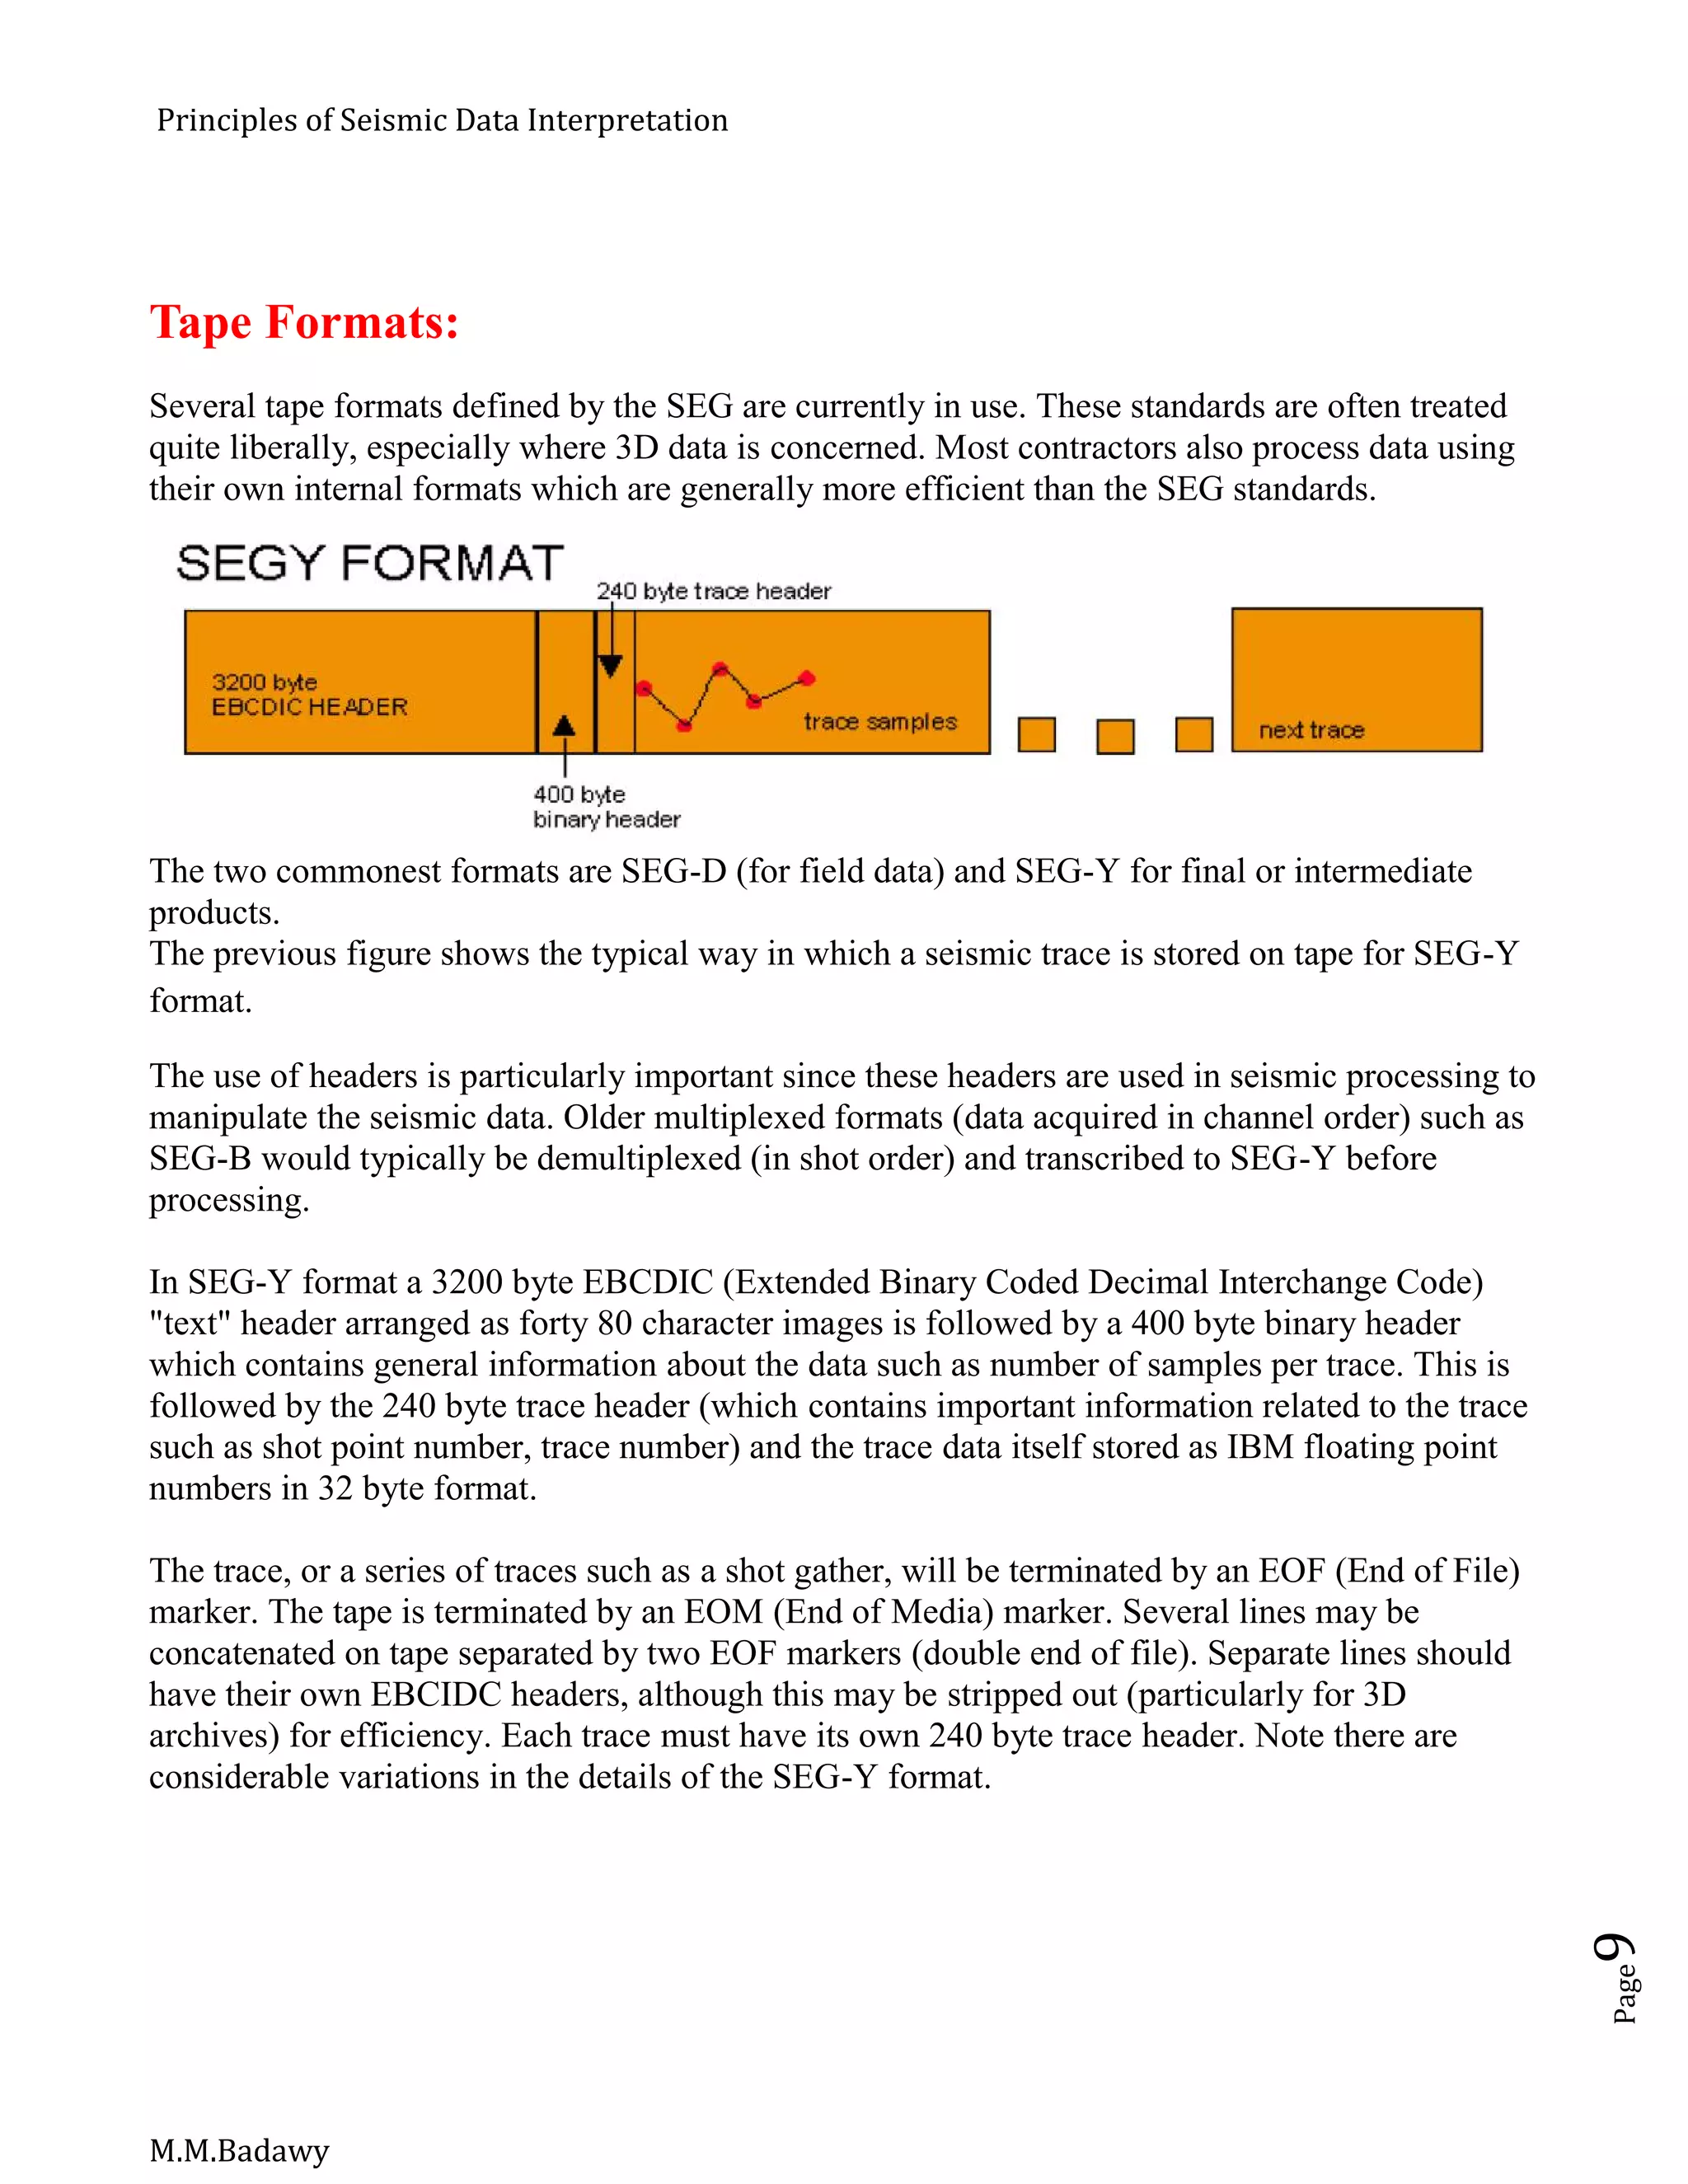
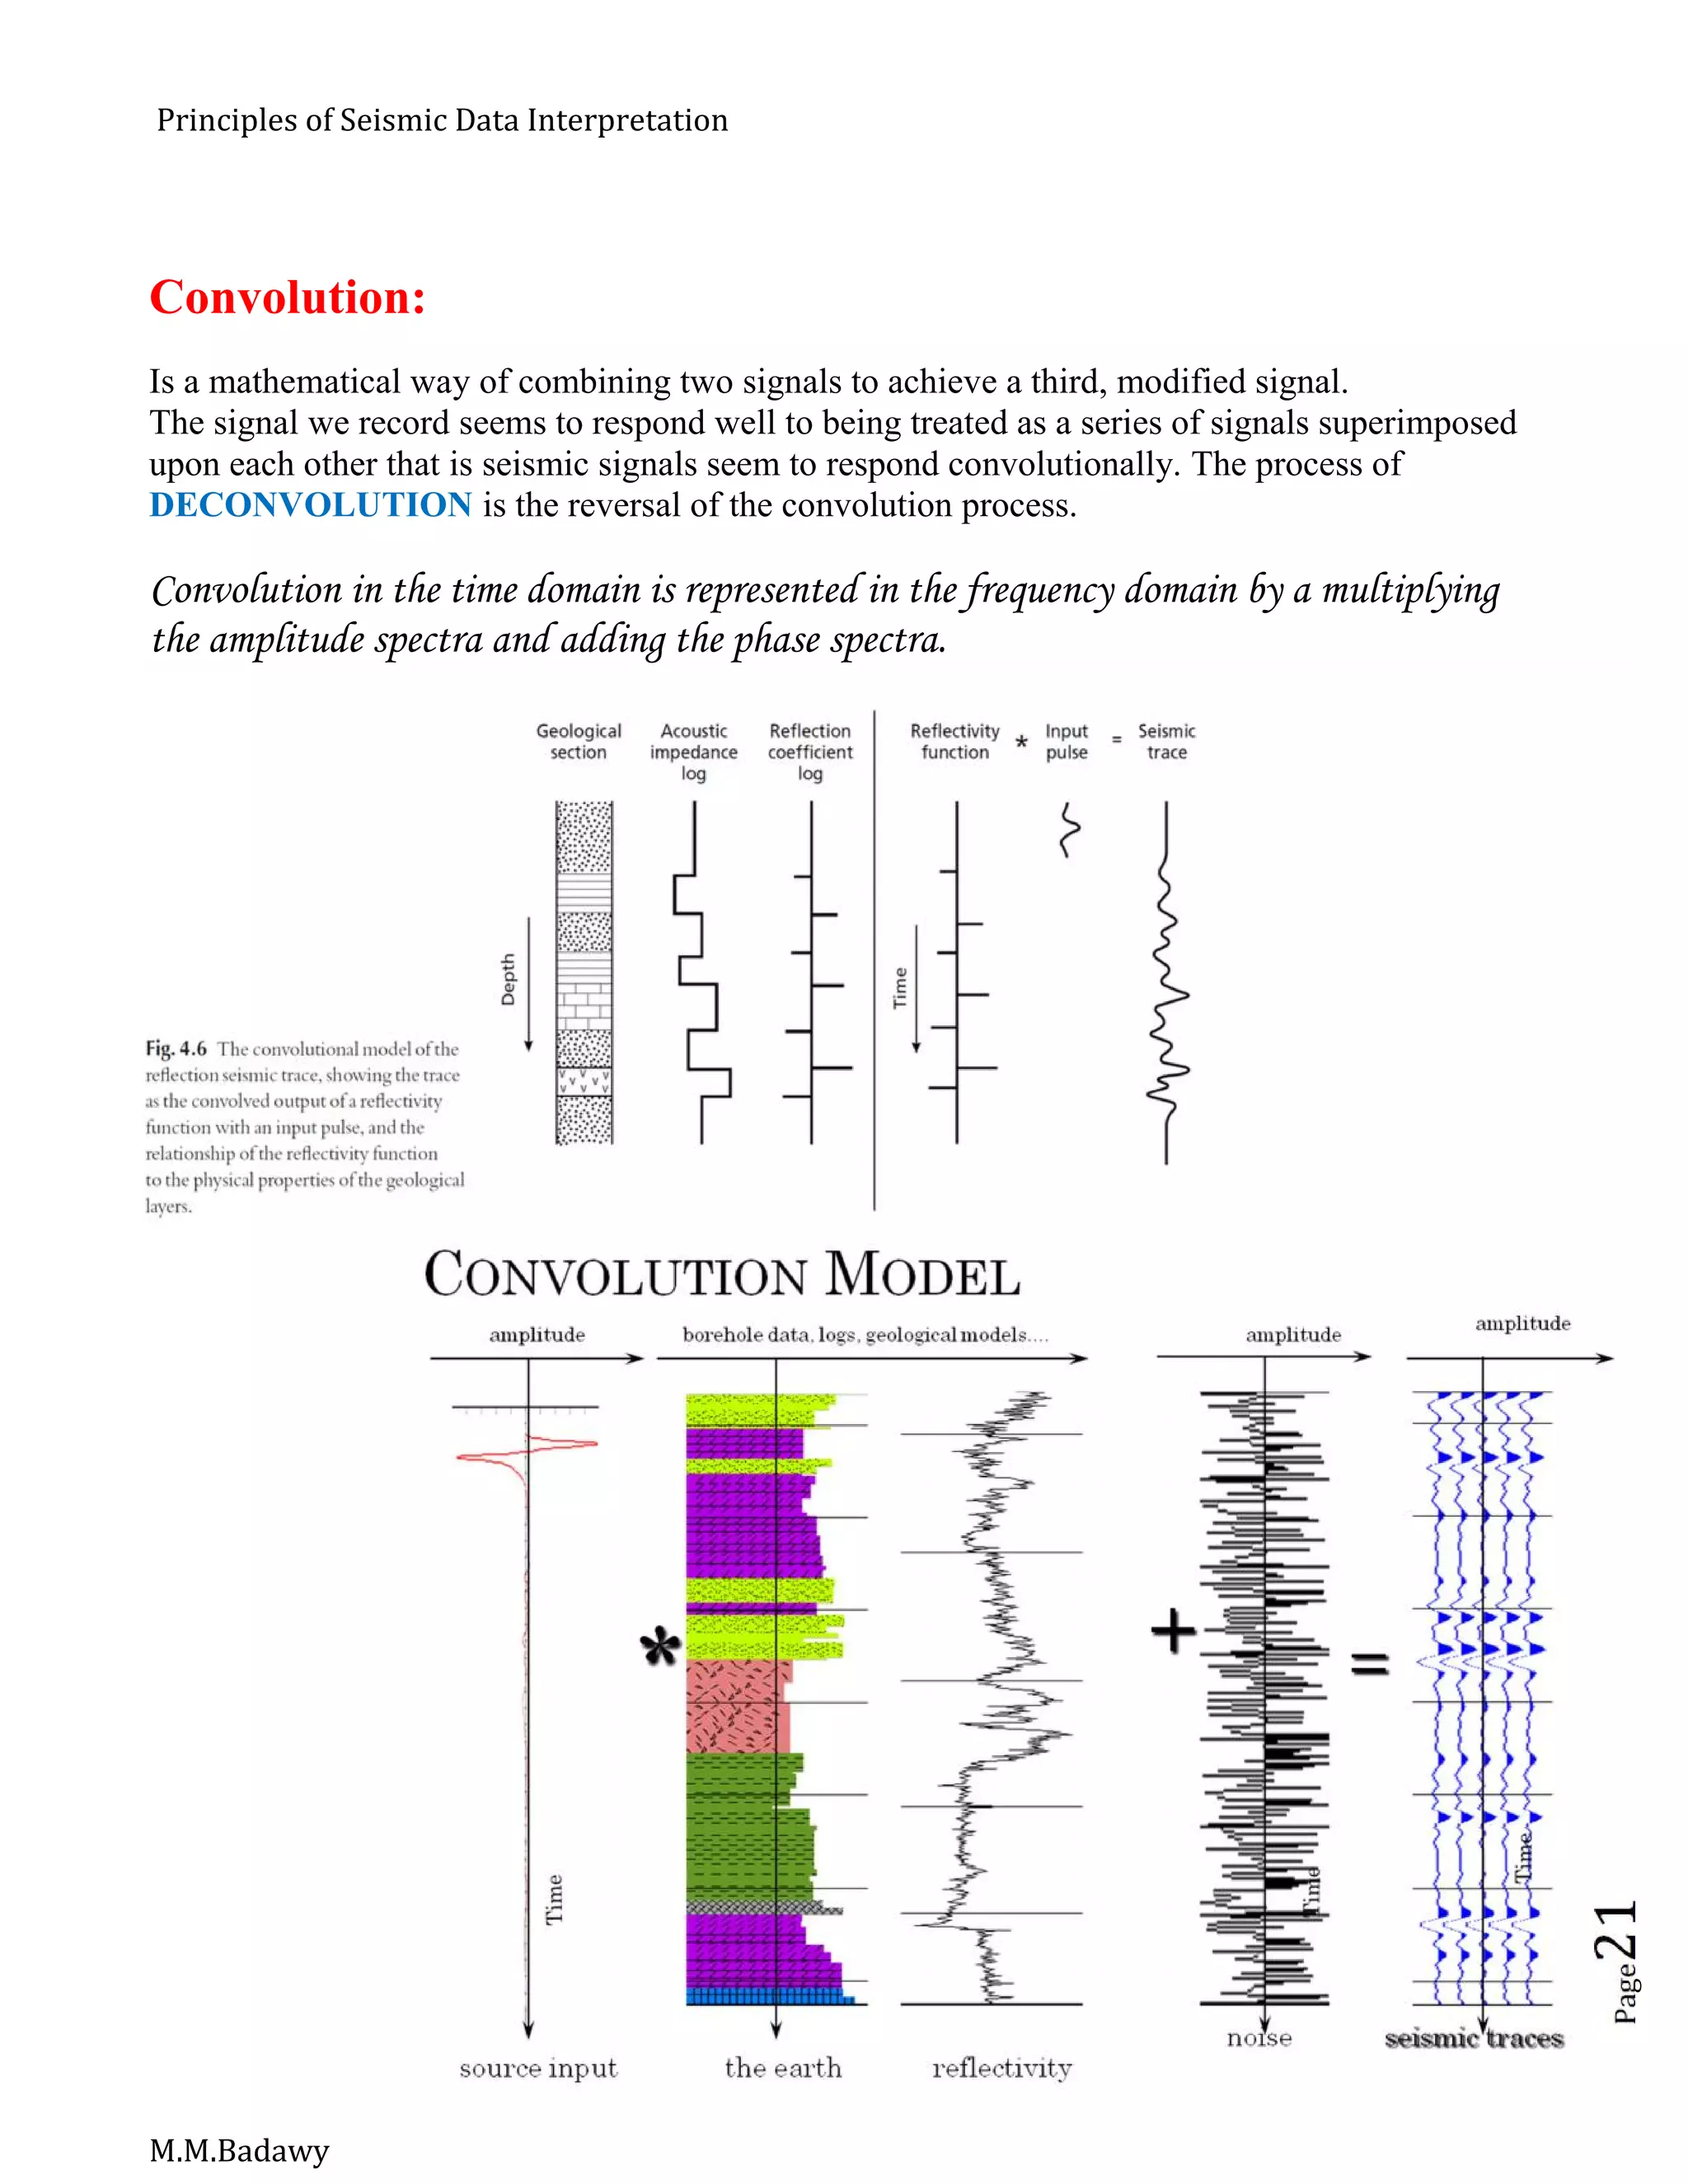
The Power of Stack:
Relies on signal being in phase and noise being out of phase i.e. primary signal is ‘flat’
on the cmp gather after NMO corrections
A spatial or K- filtering process
Data reduction - usually to [almost] ‘zero-offset’ trace
Attenuates coherent noise in the input record (to varying degrees)
Attenuates random noise relative to signal by up to N; where N = number of traces
stacked (i.e. fold of stack)
K filter - filtering of spatial frequencies by summing/mixing
K-filter - Apply an ‘all-ones’ filter and output the central sample.
To apply a spatial K-filter to a record we must first collect the series of samples having
the same time values from each data trace - ie. form a common-time trace.
This is the input data which must be convolved with our chosen filter to produce the
filtered output. The process is applied to each common-time trace in turn (0 msec, 4
msec, 8 msec, etc.).
The summing filter is a high-cut spatial filter. It passes energy close to K=0, ie.
effectively dips close to 0ms per trace. Therefore, if signal has been aligned to zero dip
(as in NMO corrected data), signal will be passed.
Organized noise contained in steeper dips will be suppressed - except at low temporal
frequencies or if the noise aliases and wraps-around through K=0.
If we increase the number of filter points - ie. increase the fold - then the filter becomes
more effective at passing only energy close to K=0, or dips closer to zero.](https://image.slidesharecdn.com/principlesofseismicdatainterpretation-m-161215153922/75/Principles-of-seismic-data-interpretation-m-m-badawy-22-2048.jpg)
![Principles of Seismic Data Interpretation
M.M.Badawy
Page32
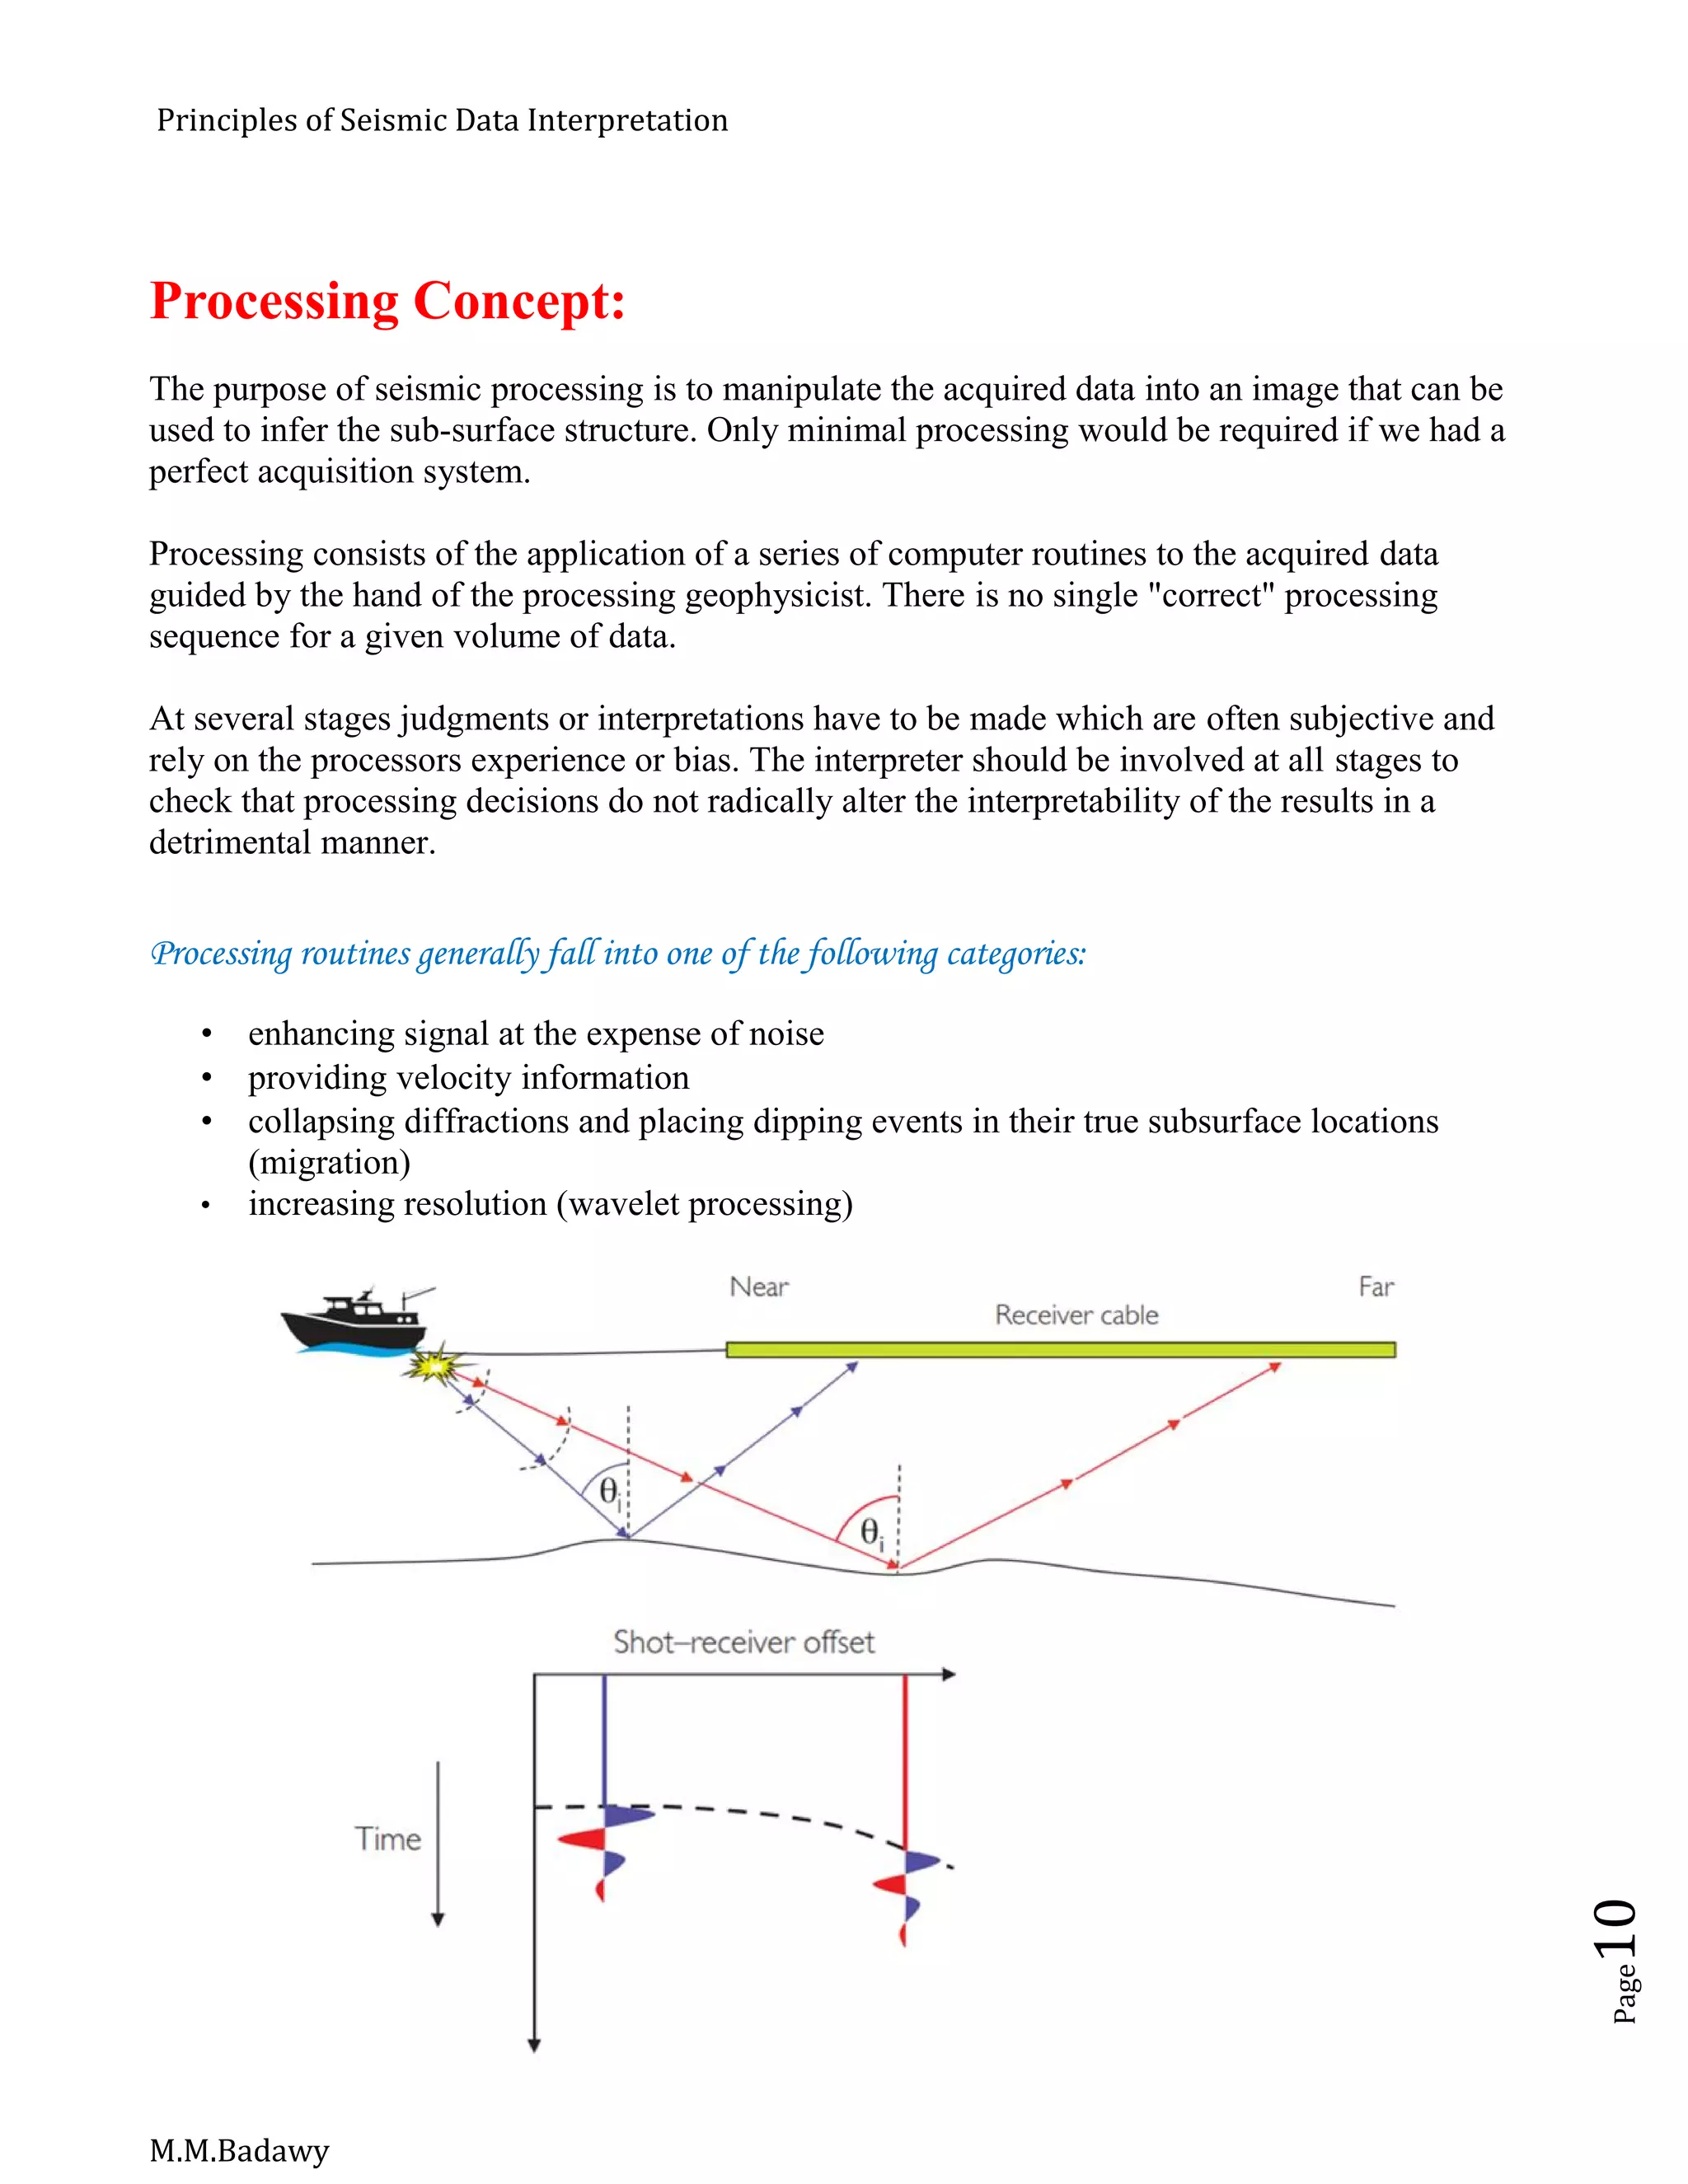
General Principles, [Seismic Facies Parameters]:
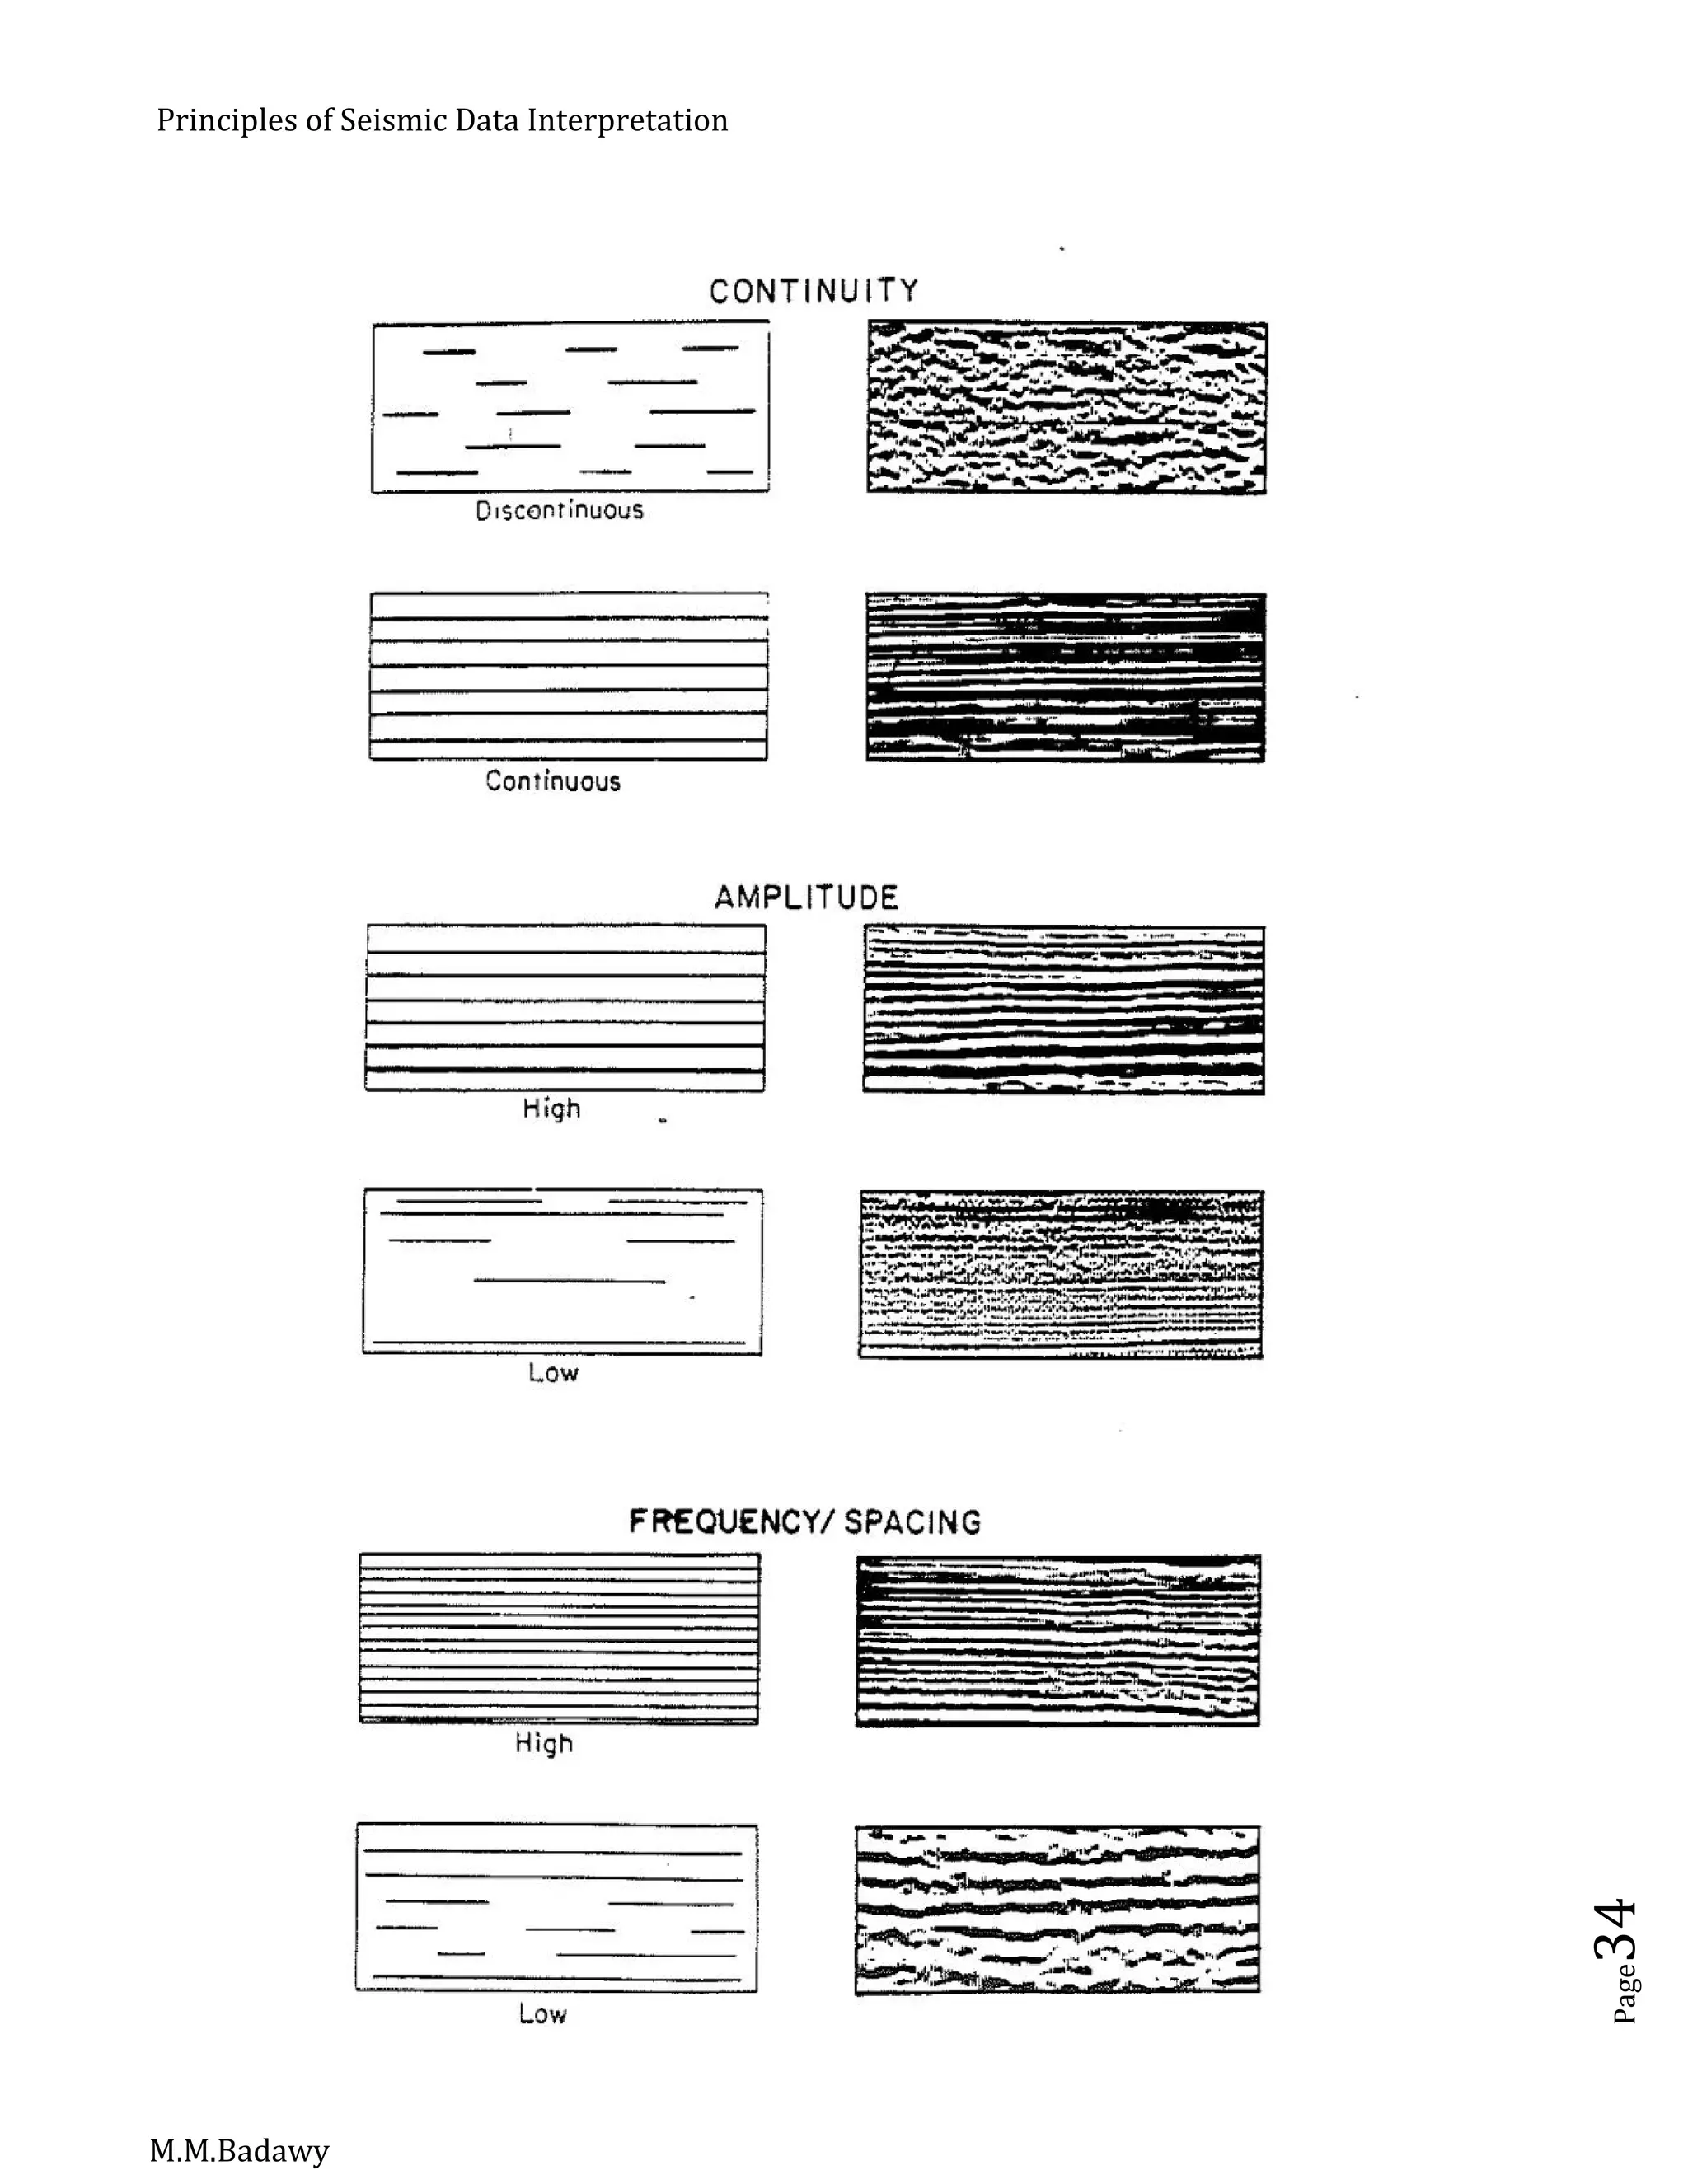
Continuity:
It is the criteria observed on seismic section of the waveform, which is the seismic arrival
of a reflection, and can be recognized on successive traces, perhaps with small changes in
arrival time from trace to trace.
These repeated pulses create an alignment, and this alignment has continuity which can be
followed. The length of continuity represent, an “island of confidence”, from which one can
work in both directions.
The visual impression is dominated by the alignment not by individual pulses Seismic
continuity of a reflection is not an expression of the continuity of a geologic unit. It is an
expression of the continuity of two geological units one following immediately on top of
the other, at their contact is the interface at which the reflection is produced
Correlation:
It is pattern recognition. The pattern may be a single pulse distinguished by its length ,
amplitude or shape , also characteristics of individual reflections, the spacing between
them It is used primarily to relate one area of confidence to another.
Correlation is:
Shape of individual pulses
Sequence of reflections and their spaces
The sequence of reflections is a very reliable basis for correlation. The spacing of
reflections is less reliable. Thickening and thinning change in seismic velocities
unconformities and other features tend to change the spacing of reflections.](https://image.slidesharecdn.com/principlesofseismicdatainterpretation-m-161215153922/75/Principles-of-seismic-data-interpretation-m-m-badawy-32-2048.jpg)
![Principles of Seismic Data Interpretation
M.M.Badawy
Page43
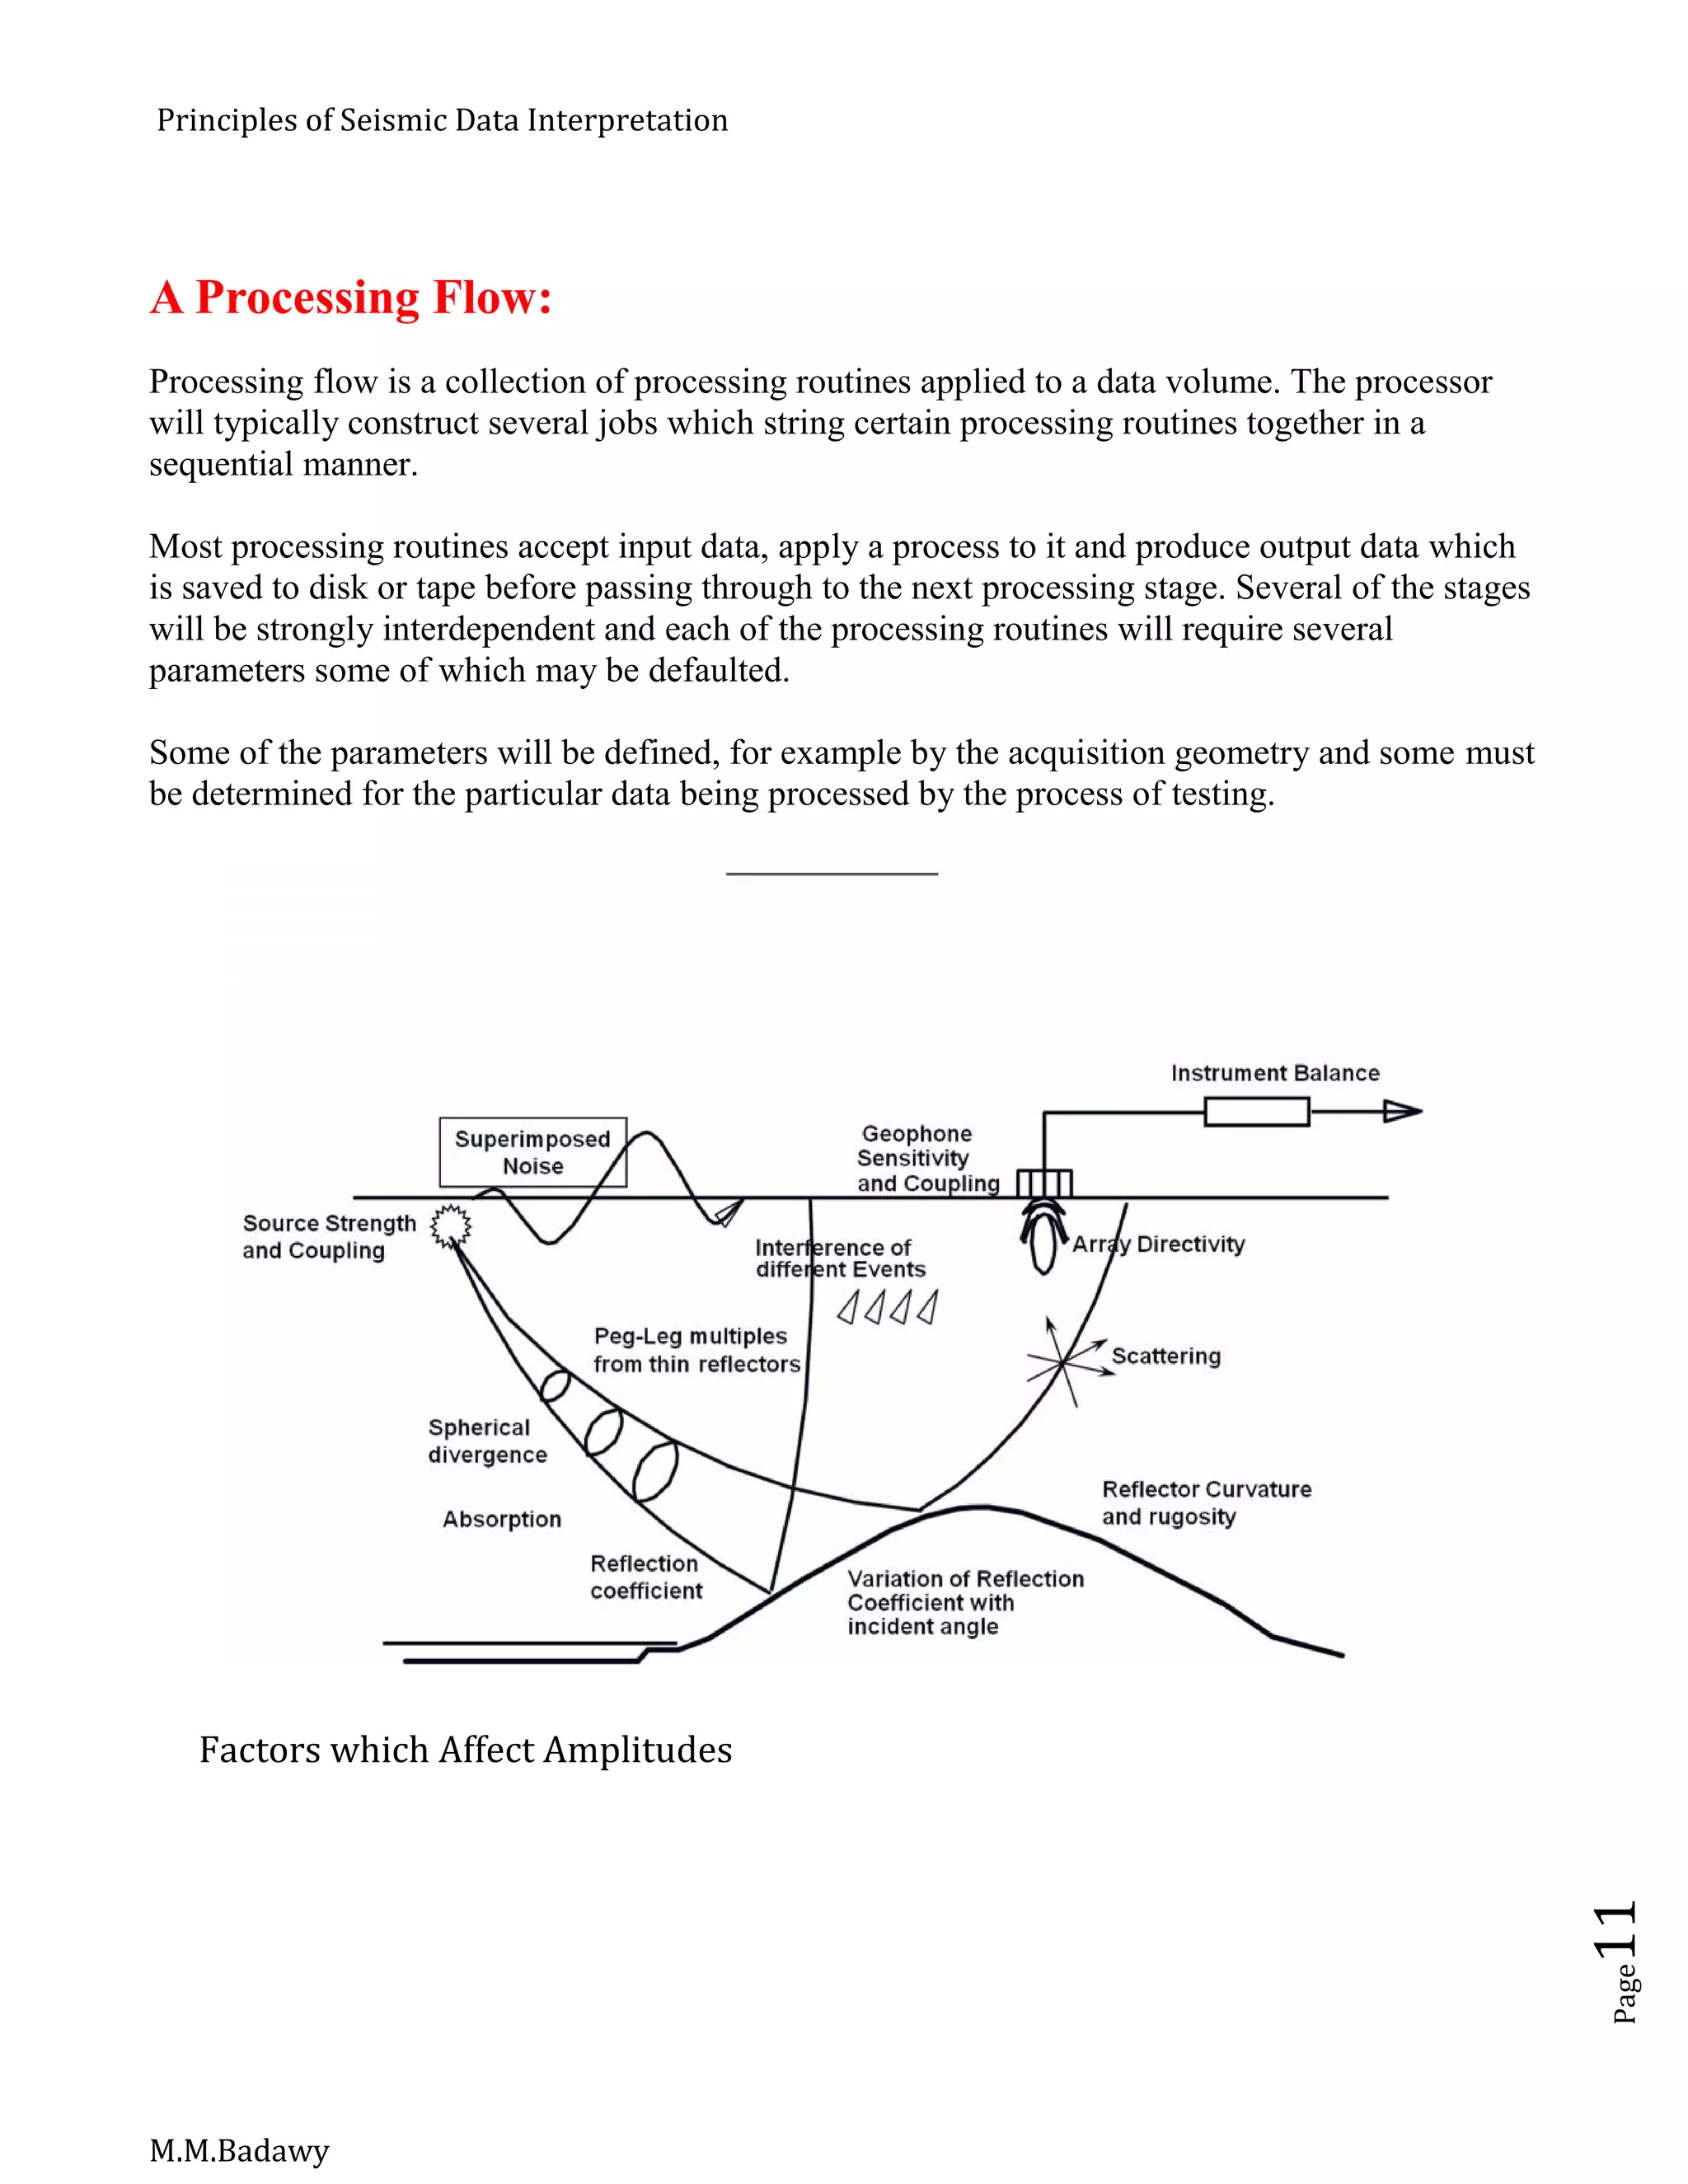
Criteria of inversion:
Less dip of growth fault.
Normal – Null.
Normal – Reverse.
Reverse – Null.
Kink fold.
Short steep limp, long gentle limp.
Horst – Graben.
Half Grabens.
[The Main Benefits of Inversion Is To Know (Basin Shift)]](https://image.slidesharecdn.com/principlesofseismicdatainterpretation-m-161215153922/75/Principles-of-seismic-data-interpretation-m-m-badawy-43-2048.jpg)
![Principles of Seismic Data Interpretation
M.M.Badawy
Page44
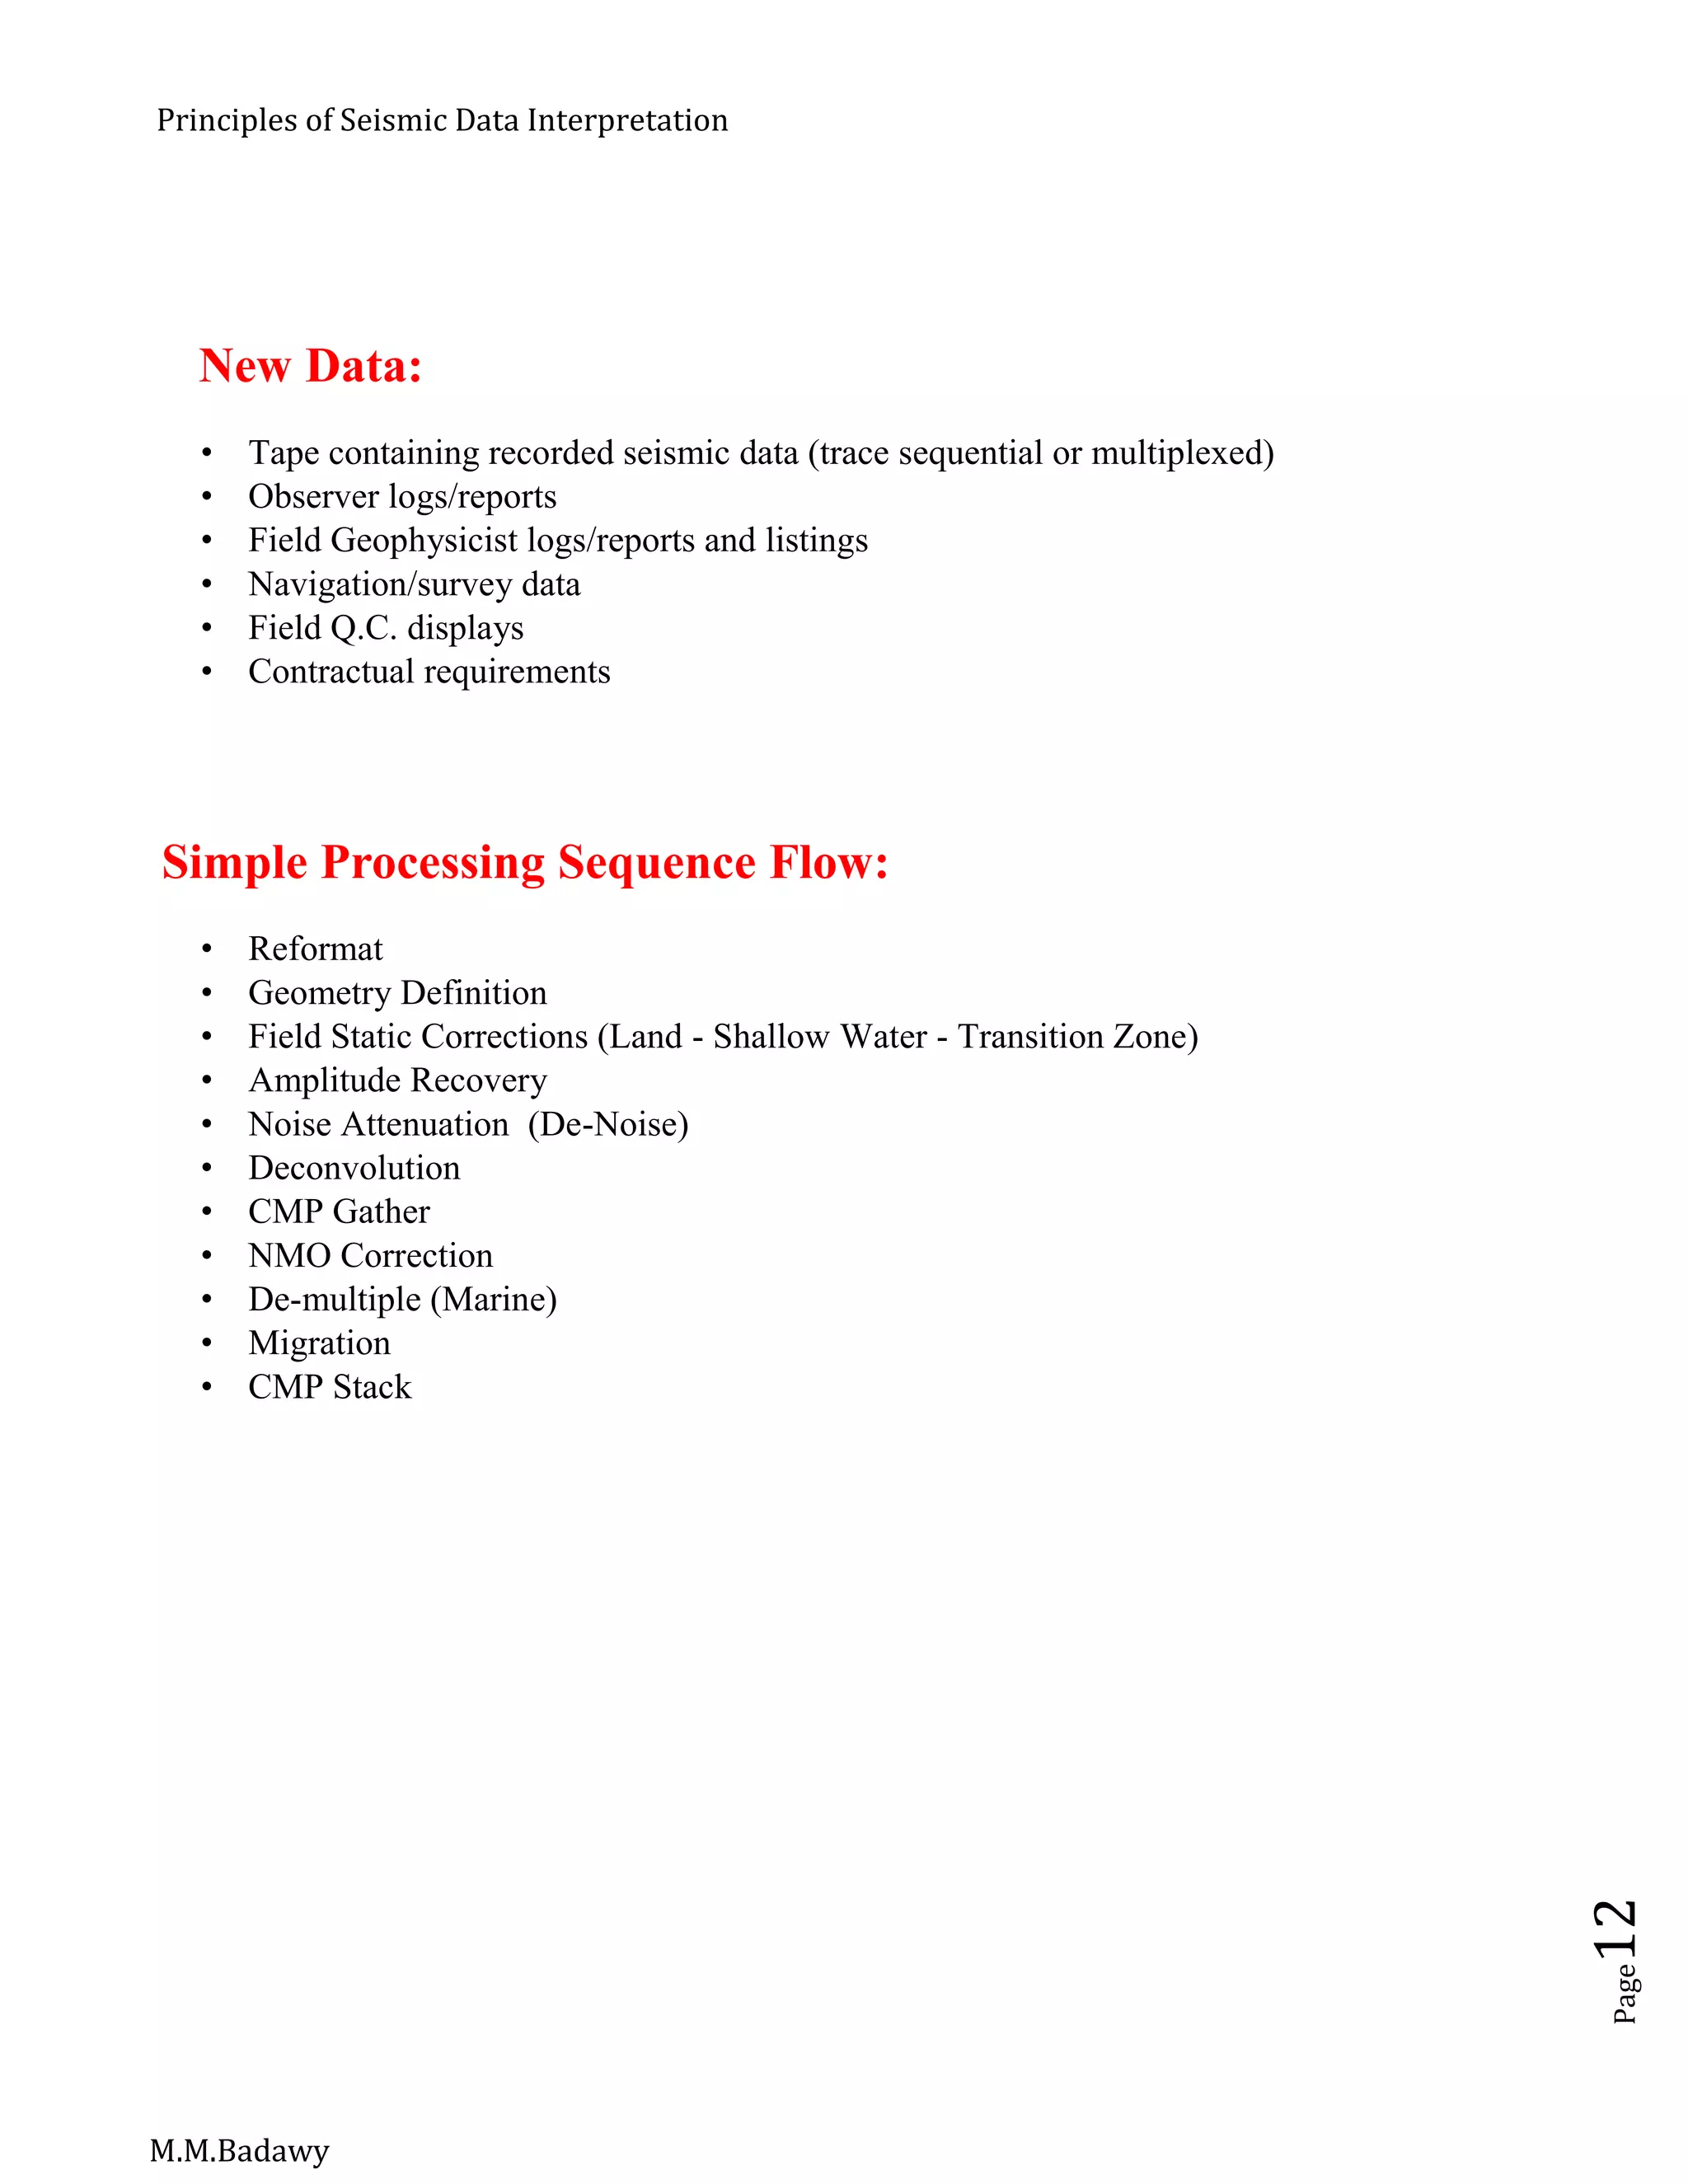
Interpreting Seismic Amplitude:
In areas with favorable rock properties it is possible to detect hydrocarbon directly
by using standard 3-D seismic data.
Amplitude interpretation is then very effective in reducing risk when selecting
exploration and production drilling location.
Not all areas have such favorable rock physics, but it is always useful to understand
what seismic amplitudes may be telling us about hydrocarbon presence or reservoir
quality.
As well as amplitudes on migrated stacked data, it is often useful to look at pre-stack
data and the way that amplitude varies with source-receiver offset (AVO).
The first step is to use well log data to predict how seismic response will change
with different reservoir fluid fill (gas or oil or brine), with changing reservoir
porosity, and with changing reservoir thickness.
AVO [Amplitude versus Offset]:
AVO stands for amplitude variation with offset, or amplitude versus offset.
The AVO techniques use the amplitude variations of pre-stack seismic reflections to
predict reservoir fluid effect.
The AVO response is depending on the properties of P-wave velocity, S-wave
velocity and density in the porous reservoir rock.
The calibration of amplitude to reflectivity is possible from a well tie, but the
calibration is valid only over a limited interval vertically.
In any case, it is a good idea to inspect the entire section from surface to the target
event and below, if amplitude anomalies at target level are seen to be correlated
with overlying or underlying changes [high or low amplitudes due to lithology or
gas effect, or over burden faulting, as an example].
Following the amplitude anomaly through the seismic processing sequence from the
raw gathers may be helpful; this may reveal an artifact being introduced in a
particular processing step.](https://image.slidesharecdn.com/principlesofseismicdatainterpretation-m-161215153922/75/Principles-of-seismic-data-interpretation-m-m-badawy-44-2048.jpg)
![Principles of Seismic Data Interpretation
M.M.Badawy
Page45
DHI [Direct Hydrocarbon Indicators]:
AGC {Automatic Gain Control} cause a low opportunity for studying amplitude [e.g
Bright Spot].
Important considerations in seismic data processing for DHI are:
Polarity, Phase, Amplitude and Spatial extent.
Frequency, Velocity, Amplitude/Offset and Shear wave information help in the
positive identification of DHI.
Flat spot is a fluid contact reflection.
Bright spot reflects gas accumulations.
Termination of flat and bright spot at the same point increases the confidence of
hydrocarbon presence.](https://image.slidesharecdn.com/principlesofseismicdatainterpretation-m-161215153922/75/Principles-of-seismic-data-interpretation-m-m-badawy-45-2048.jpg)
The document provides an overview of principles of seismic data interpretation. It discusses fundamentals of seismic acquisition and processing such as seismic response, phase, polarity, reflections, and resolution. It also covers topics like structural interpretation pitfalls, seismic interpretation workflows involving building databases and time-depth relationships, and structural styles. The document includes sections on depth conversion, subsurface mapping techniques, and different types of velocities.


