Downloaded 196 times


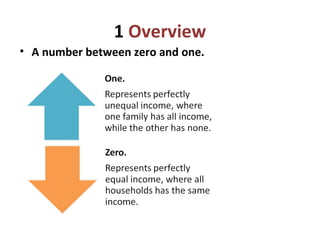
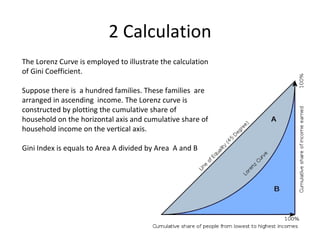
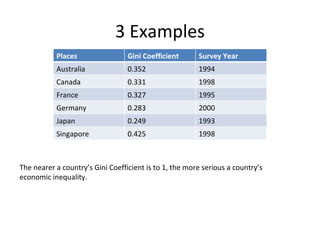
The Gini coefficient is a measure of economic inequality, ranging from 0 to 1, calculated using the Lorenz curve. The document provides examples of Gini coefficients for several countries, indicating that a coefficient closer to 1 signifies higher inequality. For instance, Singapore has a Gini coefficient of 0.425, highlighting significant economic disparity.