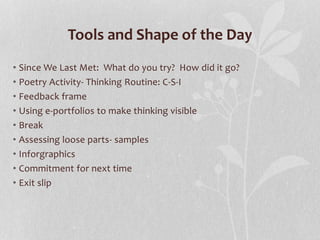
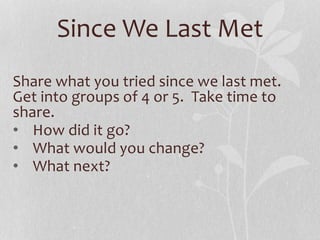
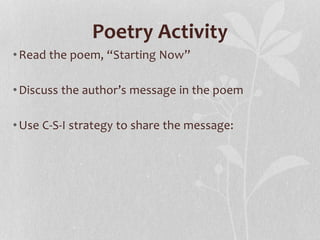
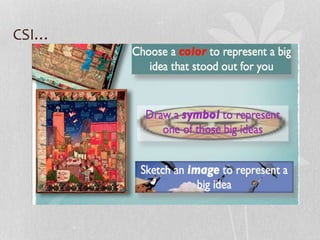
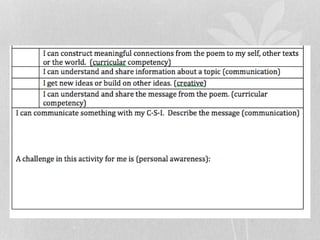
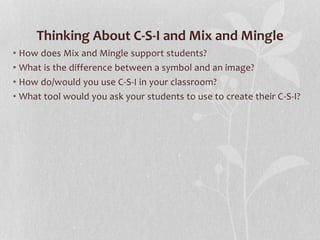
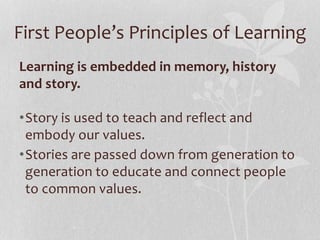
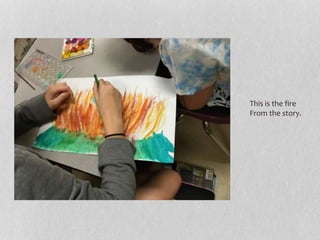
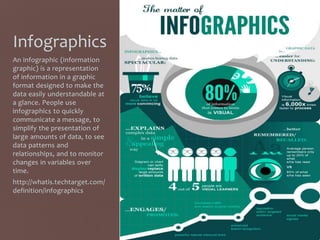
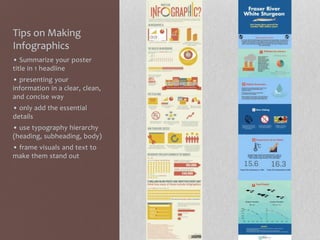
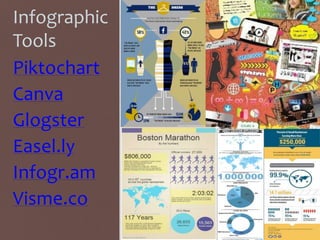
1. January 24, 2017 Session 1
Chris Loat & Lisa Schwartz
TOOLS FOR MAKING
THINKING VISIBLE
2. Tools and Shape of the Day
• Since We Last Met: What do you try? How did it go?
• Poetry Activity- Thinking Routine: C-S-I
• Feedback frame
• Using e-portfolios to make thinking visible
• Break
• Assessing loose parts- samples
• Inforgraphics
• Commitment for next time
• Exit slip
3. Since We Last Met
Share what you tried since we last met.
Get into groups of 4 or 5. Take time to
share.
• How did it go?
• What would you change?
• What next?
4. Poetry Activity
•Read the poem, “Starting Now”
•Discuss the author’s message in the poem
•Use C-S-I strategy to share the message:
8. Thinking About C-S-I and Mix and Mingle
• How does Mix and Mingle support students?
• What is the difference between a symbol and an image?
• How do/would you use C-S-I in your classroom?
• What tool would you ask your students to use to create their C-S-I?
13. First People’s Principles of Learning
Learning is embedded in memory, history
and story.
•Story is used to teach and reflect and
embody our values.
•Stories are passed down from generation to
generation to educate and connect people
to common values.
14. Teaching Targets
• Make meaningful connections from the story to yourself, other
texts or the world.
• Understand and share the big idea or message that you take away
from the story.
• Share your understanding and connections with others through
talking, loose parts and writing.
15. “This is the little hummingbird taking
drops of water in her beak. She is doing
all that she can.”
16. I made Rudoph because he
never gave up like the little
Hummingbird who never
gave up.
17. The salmon desperately swim up
the river despite its raging current.
They know they have to make it up to
breed so they just do it with all of
their strength
19. Infographics
An infographic (information
graphic) is a representation
of information in a graphic
format designed to make the
data easily understandable at
a glance. People use
infographics to quickly
communicate a message, to
simplify the presentation of
large amounts of data, to see
data patterns and
relationships, and to monitor
changes in variables over
time.
http://whatis.techtarget.com/
definition/infographics
20. Tips on Making
Infographics
• Summarize your poster
title in 1 headline
• presenting your
information in a clear, clean,
and concise way
• only add the essential
details
• use typography hierarchy
(heading, subheading, body)
• frame visuals and text to
make them stand out
22. What’s your takeaway?
What will you try?
Make a commitment for next time.
Go to http://bit.do/321mtv
NEXT SESSION:
APRIL 26, 2017
8:30-11:30
Editor's Notes
Communication competency
Critical thinking competency
The salmon desperately swim up the river despite its raging current. They know they have to make it up to breed so they just do it with all of their strength
This is the fire from the story. Why did you make that? I have no idea.