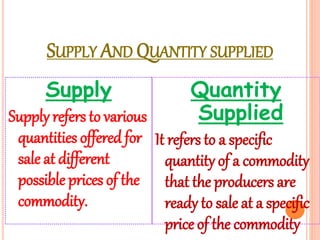
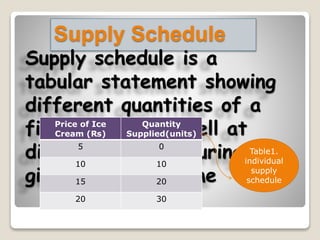
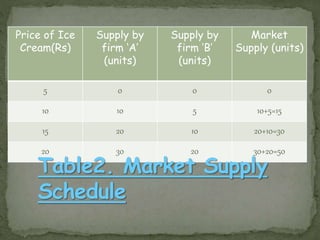
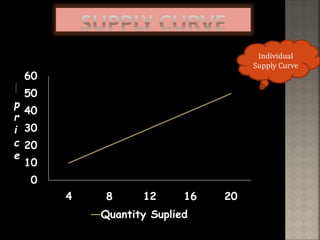
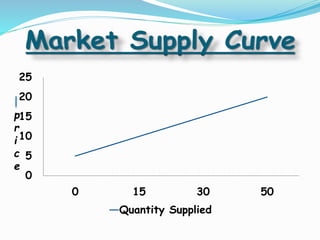
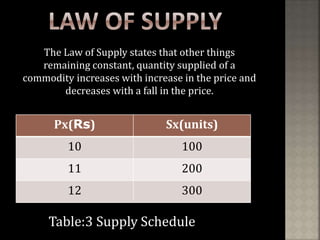
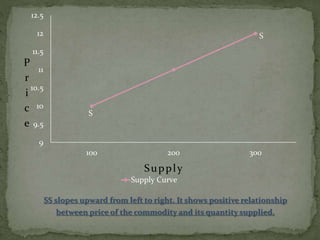
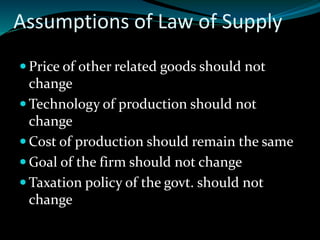
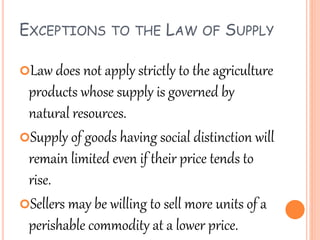
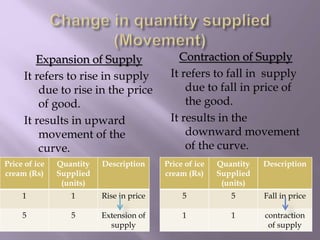
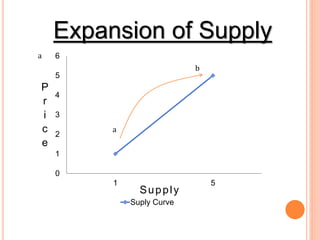
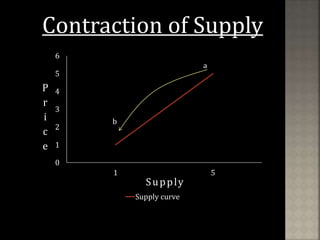
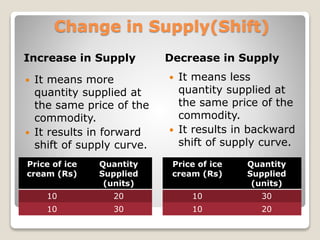
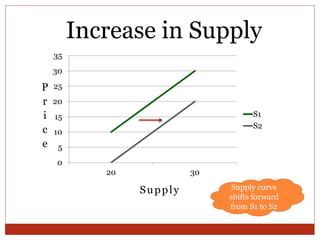
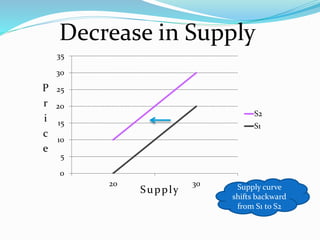
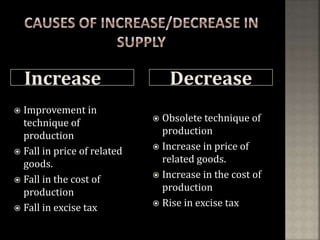
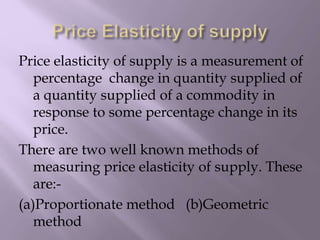
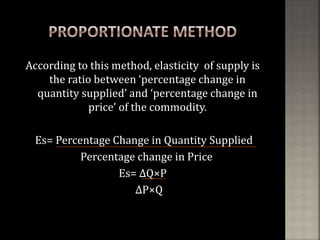
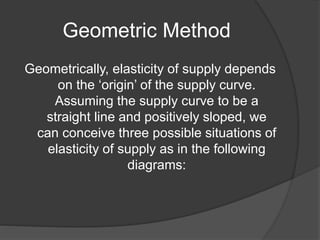
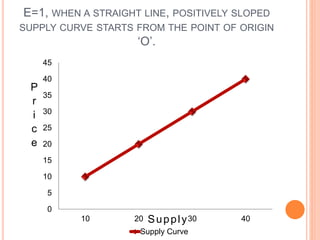
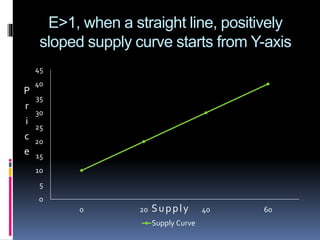
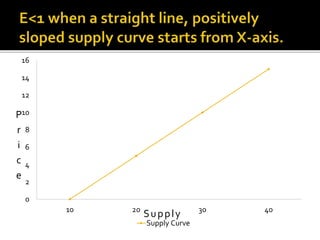
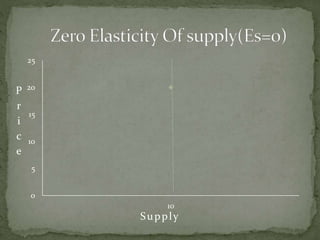
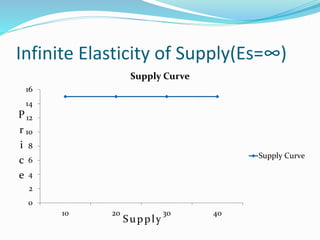
This document discusses the concepts of supply, quantity supplied, market supply, individual supply, supply schedules, supply curves, determinants of supply, the law of supply, exceptions to the law of supply, and elasticity of supply. It defines key terms and uses graphs and tables to illustrate the relationships between price, quantity supplied, and the supply curve. It explains that according to the law of supply, the quantity supplied increases with price and decreases with a fall in price, assuming other factors remain constant.
It shows the relationship between consumer demand for goods and services and their prices. Demand theory forms the basis for the demand curve, which relates consumer desire to the amount of goods available.
The main objectives of this presentation are to study about Production theory, to study about Production efficiency, to study about cost theory, To relate the cost with production, to study to achieve maximum profit for the organization and to study to take decision which will result maximum benefit for the organization. This report shows what a can a good manager do maximize production efficiency as well as economic efficiency. Not only this one of the most important matter that should be kept in consideration is that, the duration for continuing the production for a product in a competitive market situation. The main objective of an organization is to maximize it profit. Some simultaneous process are related to run an organization and to achieve its goal such as production, creating the demand of the product, selling the product with a profitable cost. That is why a manager should know about the total cost for the production and for the operation. Total cost per product can be reduced by increasing production efficiency. An organization should take this decision how will the increase their production efficiency and at the same time they have to decide how will they use their resources to get maximum output.
Starting, Growing, and Running a BusinessJohn Cousins
Entrepreneurship Is the pursuit of opportunities with disregard for assets currently controlled. There a many different skill sets that need to be understood in order to effectively grow a business.
This presentation is used in my lecture on market equilibrium analysis(Managerial Economics-MBA). Your feedback is important for me. Thx
My other work can be seen at www.educationpyramid.com
Price elasticity of demand (PED) shows the relationship between price and quantity demanded and provides a precise calculation of the effect of a change in price on quantity demanded.
Supply content slideshow. Designed for the Economic A level qualification. Can be used in revision and in class.
Subtopics:
Intro to Supply
The Supply Curve
Why is the Supply Curve Upward Sloping?
Determinants of Supply
Joint Supply
How to Make a Field invisible in Odoo 17Celine George
It is possible to hide or invisible some fields in odoo. Commonly using “invisible” attribute in the field definition to invisible the fields. This slide will show how to make a field invisible in odoo 17.
Synthetic Fiber Construction in lab .pptxPavel ( NSTU)
Synthetic fiber production is a fascinating and complex field that blends chemistry, engineering, and environmental science. By understanding these aspects, students can gain a comprehensive view of synthetic fiber production, its impact on society and the environment, and the potential for future innovations. Synthetic fibers play a crucial role in modern society, impacting various aspects of daily life, industry, and the environment. ynthetic fibers are integral to modern life, offering a range of benefits from cost-effectiveness and versatility to innovative applications and performance characteristics. While they pose environmental challenges, ongoing research and development aim to create more sustainable and eco-friendly alternatives. Understanding the importance of synthetic fibers helps in appreciating their role in the economy, industry, and daily life, while also emphasizing the need for sustainable practices and innovation.
Biological screening of herbal drugs: Introduction and Need for
Phyto-Pharmacological Screening, New Strategies for evaluating
Natural Products, In vitro evaluation techniques for Antioxidants, Antimicrobial and Anticancer drugs. In vivo evaluation techniques
for Anti-inflammatory, Antiulcer, Anticancer, Wound healing, Antidiabetic, Hepatoprotective, Cardio protective, Diuretics and
Antifertility, Toxicity studies as per OECD guidelines
Embracing GenAI - A Strategic ImperativePeter Windle
Artificial Intelligence (AI) technologies such as Generative AI, Image Generators and Large Language Models have had a dramatic impact on teaching, learning and assessment over the past 18 months. The most immediate threat AI posed was to Academic Integrity with Higher Education Institutes (HEIs) focusing their efforts on combating the use of GenAI in assessment. Guidelines were developed for staff and students, policies put in place too. Innovative educators have forged paths in the use of Generative AI for teaching, learning and assessments leading to pockets of transformation springing up across HEIs, often with little or no top-down guidance, support or direction.
This Gasta posits a strategic approach to integrating AI into HEIs to prepare staff, students and the curriculum for an evolving world and workplace. We will highlight the advantages of working with these technologies beyond the realm of teaching, learning and assessment by considering prompt engineering skills, industry impact, curriculum changes, and the need for staff upskilling. In contrast, not engaging strategically with Generative AI poses risks, including falling behind peers, missed opportunities and failing to ensure our graduates remain employable. The rapid evolution of AI technologies necessitates a proactive and strategic approach if we are to remain relevant.
Honest Reviews of Tim Han LMA Course Program.pptxtimhan337
Personal development courses are widely available today, with each one promising life-changing outcomes. Tim Han’s Life Mastery Achievers (LMA) Course has drawn a lot of interest. In addition to offering my frank assessment of Success Insider’s LMA Course, this piece examines the course’s effects via a variety of Tim Han LMA course reviews and Success Insider comments.
2024.06.01 Introducing a competency framework for languag learning materials ...Sandy Millin
http://sandymillin.wordpress.com/iateflwebinar2024
Published classroom materials form the basis of syllabuses, drive teacher professional development, and have a potentially huge influence on learners, teachers and education systems. All teachers also create their own materials, whether a few sentences on a blackboard, a highly-structured fully-realised online course, or anything in between. Despite this, the knowledge and skills needed to create effective language learning materials are rarely part of teacher training, and are mostly learnt by trial and error.
Knowledge and skills frameworks, generally called competency frameworks, for ELT teachers, trainers and managers have existed for a few years now. However, until I created one for my MA dissertation, there wasn’t one drawing together what we need to know and do to be able to effectively produce language learning materials.
This webinar will introduce you to my framework, highlighting the key competencies I identified from my research. It will also show how anybody involved in language teaching (any language, not just English!), teacher training, managing schools or developing language learning materials can benefit from using the framework.
Acetabularia Information For Class 9 .docxvaibhavrinwa19
Acetabularia acetabulum is a single-celled green alga that in its vegetative state is morphologically differentiated into a basal rhizoid and an axially elongated stalk, which bears whorls of branching hairs. The single diploid nucleus resides in the rhizoid.
BÀI TẬP BỔ TRỢ TIẾNG ANH GLOBAL SUCCESS LỚP 3 - CẢ NĂM (CÓ FILE NGHE VÀ ĐÁP Á...
Theory of supply
1.
2. Supply is the Quantity of a
commodity which is offered
for sale at a givenPRICE
during some particular
TIME
3. SUPPLY AND QUANTITY SUPPLIED
Supply
Supply refers to various
quantities offered for
sale at different
possible prices of the
commodity.
Quantity
Supplied
It refers to a specific
quantity of a commodity
that the producers are
ready to sale at a specific
price of the commodity
4. Market Supplyrefers
to the sum total of
various quantities
offeredfor sale by all the
individual firms at
different prices
Individual supply refers
to different quantities
offered for sale by an
individual firm at different
prices
5. Supply Schedule
Supply schedule is a
tabular statement showing
different quantities of a
firm is ready to sell at
different prices during a
given period of time
Price of Ice
Cream (₨)
Quantity
Supplied(units)
5 0
10 10
15 20
20 30
Table1.
individual
supply
schedule
9. Supply Function
It is a functional relationship between
quantity supplied of a commodity and
factors affecting it.
Supply of commodity by a firm depends on
price of the commodity itself(Pn), prices of
other commodities(Pr), state of
technology(T), cost of factors of
production(F), objectives of the firm(O)
etc.
This can be mathematically as shown
below:
10. Price of the commodity:- At a higher price,
producer offers more quantity of the commodity
for sale and at a lower price, less quantity of the
commodity is offered for sale. There is a direct
relationship between price and quantity supplied is
illustrated in the next section on “Law of Supply”.
Price of related Goods:- Supply of a commodity
depends upon the prices of its related goods,
specially substitute goods. If the price of a
commodity remains constant and the price of its
substitute good Z increases, the producers would
prefer to produce substitute good Z. As a result, the
supply commodity x will decrease and of good Z
will increase.
11. State of Technology:- A change in technology of production
which lessens cost of production increases supply of the
commodity. As against this, the supply of those goods which
are being produced with old and inferior technique causing
increase in cost of production will fall.
Cost of factor of Production:- A change in the cost of production, i.e., prices of
factors of production also affects the supplyof a commodity. If wages of labour or
price of raw material increase,then cost of production will rise. As a result,
supplyof the good willfall because producerswouldprefer to produce some
other goods that can be producedat a lower cost.Objectives of Firm:- Sometimes, a
firm may be induced to increase
supply of a good not because it is
more profitable but because its
supply is a source of status and
prestige in the market. Likewise,
supply is also affected by the
priority given to different
12. The Law of Supply states that other things
remaining constant, quantity supplied of a
commodity increases with increase in the price and
decreases with a fall in the price.
Px(Rs) Sx(units)
10 100
11 200
12 300
Table:3 Supply Schedule
13. 9
9.5
10
10.5
11
11.5
12
12.5
100 200 300
Supply Curve
P
r
i
c
e
Supply
S
SS slopes upward from left to right. It shows positive relationship
between price of the commodity and its quantity supplied.
S
14. Assumptions of Law of Supply
Price of other related goods should not
change
Technology of production should not
change
Cost of production should remain the same
Goal of the firm should not change
Taxation policy of the govt. should not
change
15. EXCEPTIONS TO THE LAW OF SUPPLY
Law does not apply strictly to the agriculture
products whose supply is governed by
natural resources.
Supply of goods having social distinction will
remain limited even if their price tends to
rise.
Sellers may be willing to sell more units of a
perishable commodity at a lower price.
16. Expansion of Supply
It refers to rise in supply
due to rise in the price
of good.
It results in upward
movement of the
curve.
Contraction of Supply
It refers to fall in supply
due to fall in price of
the good.
It results in the
downward movement
of the curve.
Price of ice
cream (Rs)
Quantity
Supplied
(units)
Description
1 1 Rise in price
5 5 Extension of
supply
Price of ice
cream (Rs)
Quantity
Supplied
(units)
Description
5 5 Fall in price
1 1 contraction
of supply
19. Change in Supply(Shift)
Increase in Supply
It means more
quantity supplied at
the same price of the
commodity.
It results in forward
shift of supply curve.
Decrease in Supply
It means less
quantity supplied at
the same price of the
commodity.
It results in backward
shift of supply curve.
Price of ice
cream (Rs)
Quantity
Supplied
(units)
10 20
10 30
Price of ice
cream (Rs)
Quantity
Supplied
(units)
10 30
10 20
22. Increase Decrease
Improvement in
technique of
production
Fall in price of related
goods.
Fall in the cost of
production
Fall in excise tax
Obsolete technique of
production
Increase in price of
related goods.
Increase in the cost of
production
Rise in excise tax
23. Price elasticity of supply is a measurement of
percentage change in quantity supplied of
a quantity supplied of a commodity in
response to some percentage change in its
price.
There are two well known methods of
measuring price elasticity of supply. These
are:-
(a)Proportionate method (b)Geometric
method
24. According to this method, elasticity of supply is
the ratio between ‘percentage change in
quantity supplied’ and ‘percentage change in
price’ of the commodity.
Es= Percentage Change in Quantity Supplied
Percentage change in Price
Es= ∆Q×P
∆P×Q
25. Geometric Method
Geometrically, elasticity of supply depends
on the ‘origin’ of the supply curve.
Assuming the supply curve to be a
straight line and positively sloped, we
can conceive three possible situations of
elasticity of supply as in the following
diagrams:
26. E=1, WHEN A STRAIGHT LINE, POSITIVELY SLOPED
SUPPLY CURVE STARTS FROM THE POINT OF ORIGIN
‘O’.
0
5
10
15
20
25
30
35
40
45
10 20 30 40
Supply Curve
P
r
i
c
e
Supply
27. E>1, when a straight line, positively
sloped supply curve starts from Y-axis
0
5
10
15
20
25
30
35
40
45
0 20 40 60
Supply Curve
P
r
i
c
e
Supply