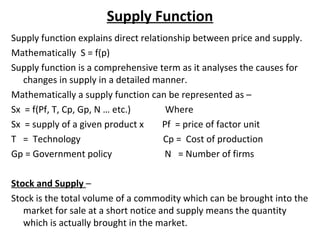
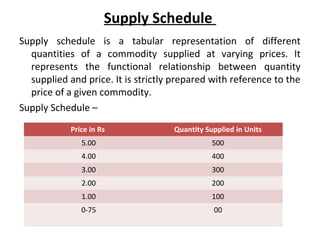
The document discusses the concept of supply in economics. It defines supply as the quantity of a commodity producers are willing and able to sell at a given price over a specific time period. The supply of a product is determined by several factors including its price, production costs, technology, government policies, and more. The supply schedule shows the relationship between price and quantity supplied, while the supply curve illustrates this graphically as an upward-sloping curve. Market equilibrium occurs at the price where quantity supplied equals quantity demanded. A change in the supply curve results from changes in its determinants and causes the equilibrium price and quantity to also change.
Elasticity of Supply
The elasticity of supply can be defined as “the degree (measure) of responsiveness in quantity supplied to a change in price”.
It is also defined as the percentage change in quantity supplied divided by percentage change in price.
It represents the rate of change in quantity supplied due to a change in its own price.
Elasticity of supply can be defined as “the degree (measure) of responsiveness in quantity supplied to a change in price”.
It is also defined as the percentage change in quantity supplied divided by percentage change in price.
It represents the rate of change in quantity supplied due to a change in it’s own price.
Price elasticity of supply measures the responsiveness to the supply of a good or service after a change in its market price. According to basic economic theory, the supply of a good will increase when its price rises. Conversely, the supply of a good will decrease when its price decreases.
Price Elasticity of Demand, Degrees of Elasticity, Factors determining Elasticity of Demand, Measurement of Price Elasticity, Importance of Elasticity of Demand
The cross-price elasticity of demand is the degree of responsiveness of quantity demanded of a commodity due to the change in price of another commodity.
Supply and Demand GuideTo solve the homework problems do the f.docxpicklesvalery
Supply and Demand Guide
To solve the homework problems do the following:
1. Identify the determinant change
2. Shift the appropriate curve in the correct direction
3. Change price appropriately
4. Move along the other curve (the one that did not shift) in response to the price change.
The following information will tell you the determinants and how the change, as well as definitions of the key terms.
Demand
Demand: The amount that consumers are willing and able to purchase at various prices.
Law of Demand: Price and Quantity Demanded vary inversely.
Quantity Demanded: The amount that consumers are willing and able to buy at a particular price.
Change in Quantity Demanded: Changes in price change the quantity demanded. This is a Movement Along a Demand Curve in Response to a Price Change.
Change in Demand: This is a shift in the position of the demand curve, either upward or downward. If the curve shifts upward, consumers are saying they will pay more for all quantities of the good or service. If it shifts downward, consumers are saying they will pay less for all quantities of the good or service.
Determinants of Demand: The Demand Curve will shift only when one (or more) of the Determinants of Demand changes. These determinants are:
1. Size of Market: the number of consumers in the market for the good or service. If this factor increases, the curve shifts upward (increase in demand). If this decreases, the curve shifts downward (decrease in demand).
2. Consumer Tastes and Preferences: if these shift in favor of a product, the demand curve shifts upward (demand increases); if these shift against a product, the demand curve shifts downward (demand decreases).
3. Consumer Income: as the income of consumers increase, consumers purchase more of all normal goods (assume all the goods in the homework are normal goods), this shifts the demand curve upward (demand increases); if income decreases, then consumers buy less of all normal goods, this shifts the demand curve downward (demand decreases).
4. Prices of Related Goods:
a. Complimentary Goods: These are goods that are used to together like peanut butter and jelly. If the price of peanut butter goes up, the Quantity Demanded of peanut butter will decrease (a movement along a demand curve in response to a price change). However, the Demand for jelly will decline (decrease in demand) as fewer people buy it to go with the peanut butter, since they are buying less peanut butter.
b. Substitute Goods: These are goods that are used in place of each other. If the price of Coke Cola goes up, the Quantity Demanded of Coke does down (a movement along the demand curve). But the Demand for Pepsi – the substitute good – goes up as people substitute the lower priced Pepsi for the higher priced Coke (the Pepsi demand curve shifts upward).
5. Expectations about the Future: If people have a positive view of the future they will consumer more and save less. This shifts th ...
Here I describe supply. The law of supply.Supply curve and supply schedule with their Example.Shifty in the supply curve.Market Demand and many Things.
Model Attribute Check Company Auto PropertyCeline George
In Odoo, the multi-company feature allows you to manage multiple companies within a single Odoo database instance. Each company can have its own configurations while still sharing common resources such as products, customers, and suppliers.
The French Revolution, which began in 1789, was a period of radical social and political upheaval in France. It marked the decline of absolute monarchies, the rise of secular and democratic republics, and the eventual rise of Napoleon Bonaparte. This revolutionary period is crucial in understanding the transition from feudalism to modernity in Europe.
For more information, visit-www.vavaclasses.com
Biological screening of herbal drugs: Introduction and Need for
Phyto-Pharmacological Screening, New Strategies for evaluating
Natural Products, In vitro evaluation techniques for Antioxidants, Antimicrobial and Anticancer drugs. In vivo evaluation techniques
for Anti-inflammatory, Antiulcer, Anticancer, Wound healing, Antidiabetic, Hepatoprotective, Cardio protective, Diuretics and
Antifertility, Toxicity studies as per OECD guidelines
Operation “Blue Star” is the only event in the history of Independent India where the state went into war with its own people. Even after about 40 years it is not clear if it was culmination of states anger over people of the region, a political game of power or start of dictatorial chapter in the democratic setup.
The people of Punjab felt alienated from main stream due to denial of their just demands during a long democratic struggle since independence. As it happen all over the word, it led to militant struggle with great loss of lives of military, police and civilian personnel. Killing of Indira Gandhi and massacre of innocent Sikhs in Delhi and other India cities was also associated with this movement.
A Strategic Approach: GenAI in EducationPeter Windle
Artificial Intelligence (AI) technologies such as Generative AI, Image Generators and Large Language Models have had a dramatic impact on teaching, learning and assessment over the past 18 months. The most immediate threat AI posed was to Academic Integrity with Higher Education Institutes (HEIs) focusing their efforts on combating the use of GenAI in assessment. Guidelines were developed for staff and students, policies put in place too. Innovative educators have forged paths in the use of Generative AI for teaching, learning and assessments leading to pockets of transformation springing up across HEIs, often with little or no top-down guidance, support or direction.
This Gasta posits a strategic approach to integrating AI into HEIs to prepare staff, students and the curriculum for an evolving world and workplace. We will highlight the advantages of working with these technologies beyond the realm of teaching, learning and assessment by considering prompt engineering skills, industry impact, curriculum changes, and the need for staff upskilling. In contrast, not engaging strategically with Generative AI poses risks, including falling behind peers, missed opportunities and failing to ensure our graduates remain employable. The rapid evolution of AI technologies necessitates a proactive and strategic approach if we are to remain relevant.
Acetabularia Information For Class 9 .docxvaibhavrinwa19
Acetabularia acetabulum is a single-celled green alga that in its vegetative state is morphologically differentiated into a basal rhizoid and an axially elongated stalk, which bears whorls of branching hairs. The single diploid nucleus resides in the rhizoid.
Francesca Gottschalk - How can education support child empowerment.pptxEduSkills OECD
Francesca Gottschalk from the OECD’s Centre for Educational Research and Innovation presents at the Ask an Expert Webinar: How can education support child empowerment?
Synthetic Fiber Construction in lab .pptxPavel ( NSTU)
Synthetic fiber production is a fascinating and complex field that blends chemistry, engineering, and environmental science. By understanding these aspects, students can gain a comprehensive view of synthetic fiber production, its impact on society and the environment, and the potential for future innovations. Synthetic fibers play a crucial role in modern society, impacting various aspects of daily life, industry, and the environment. ynthetic fibers are integral to modern life, offering a range of benefits from cost-effectiveness and versatility to innovative applications and performance characteristics. While they pose environmental challenges, ongoing research and development aim to create more sustainable and eco-friendly alternatives. Understanding the importance of synthetic fibers helps in appreciating their role in the economy, industry, and daily life, while also emphasizing the need for sustainable practices and innovation.
June 3, 2024 Anti-Semitism Letter Sent to MIT President Kornbluth and MIT Cor...Levi Shapiro
Letter from the Congress of the United States regarding Anti-Semitism sent June 3rd to MIT President Sally Kornbluth, MIT Corp Chair, Mark Gorenberg
Dear Dr. Kornbluth and Mr. Gorenberg,
The US House of Representatives is deeply concerned by ongoing and pervasive acts of antisemitic
harassment and intimidation at the Massachusetts Institute of Technology (MIT). Failing to act decisively to ensure a safe learning environment for all students would be a grave dereliction of your responsibilities as President of MIT and Chair of the MIT Corporation.
This Congress will not stand idly by and allow an environment hostile to Jewish students to persist. The House believes that your institution is in violation of Title VI of the Civil Rights Act, and the inability or
unwillingness to rectify this violation through action requires accountability.
Postsecondary education is a unique opportunity for students to learn and have their ideas and beliefs challenged. However, universities receiving hundreds of millions of federal funds annually have denied
students that opportunity and have been hijacked to become venues for the promotion of terrorism, antisemitic harassment and intimidation, unlawful encampments, and in some cases, assaults and riots.
The House of Representatives will not countenance the use of federal funds to indoctrinate students into hateful, antisemitic, anti-American supporters of terrorism. Investigations into campus antisemitism by the Committee on Education and the Workforce and the Committee on Ways and Means have been expanded into a Congress-wide probe across all relevant jurisdictions to address this national crisis. The undersigned Committees will conduct oversight into the use of federal funds at MIT and its learning environment under authorities granted to each Committee.
• The Committee on Education and the Workforce has been investigating your institution since December 7, 2023. The Committee has broad jurisdiction over postsecondary education, including its compliance with Title VI of the Civil Rights Act, campus safety concerns over disruptions to the learning environment, and the awarding of federal student aid under the Higher Education Act.
• The Committee on Oversight and Accountability is investigating the sources of funding and other support flowing to groups espousing pro-Hamas propaganda and engaged in antisemitic harassment and intimidation of students. The Committee on Oversight and Accountability is the principal oversight committee of the US House of Representatives and has broad authority to investigate “any matter” at “any time” under House Rule X.
• The Committee on Ways and Means has been investigating several universities since November 15, 2023, when the Committee held a hearing entitled From Ivory Towers to Dark Corners: Investigating the Nexus Between Antisemitism, Tax-Exempt Universities, and Terror Financing. The Committee followed the hearing with letters to those institutions on January 10, 202
1. 4. Supply Function
Supply is one of the two forces that determine the price of a
commodity in the market. Supply means the amount offered for
sale at a given price.
According to Thomas “The supply of goods is the quantity
offered for sale in a given market at a given time at various
prices”.
According to Prof. Macconnel “supply may be defined as a
schedule which shows the various amounts of a product which a
producer is willing to and able to produce and make available for
sale in the market at each specific price in a set of possible prices
during some given period”.
Thus, supply of a product refers to the various amounts which
are offered for sale at a particular price during a given period of
time.
2. Supply Function
Supply function explains direct relationship between price and supply.
Mathematically S = f(p)
Supply function is a comprehensive term as it analyses the causes for
changes in supply in a detailed manner.
Mathematically a supply function can be represented as –
Sx = f(Pf, T, Cp, Gp, N … etc.) Where
Sx = supply of a given product x Pf = price of factor unit
T = Technology Cp = Cost of production
Gp = Government policy N = Number of firms
Stock and Supply –
Stock is the total volume of a commodity which can be brought into the
market for sale at a short notice and supply means the quantity
which is actually brought in the market.
3. Determinants of Supply
1. Natural factors
2. Change in techniques of production
3. Cost of production
4. Government policy
5. Monopoly power
6. Number of sellers or firms
7. Complementary goods
8. Discovery of new source of inputs
9. Improvements in transport and communication
10.Future rise in prices
4. Supply Schedule
Supply schedule is a tabular representation of different
quantities of a commodity supplied at varying prices. It
represents the functional relationship between quantity
supplied and price. It is strictly prepared with reference to the
price of a given commodity.
Supply Schedule –
Price in Rs Quantity Supplied in Units
5.00 500
4.00 400
3.00 300
2.00 200
1.00 100
0-75 00
5. Market Supply Schedule
The total quantity of commodity supplied at
different prices in a market by the whole body
of sellers is called market supply schedule. It
refers to the aggregate behaviour of the
market rather than mere totaling of all
individual supply schedules. It is the horizontal
summation of the individual supply schedule.
6. Price Rs Quantity Supplied in Units Total
(A+B+C)A B C
5.00 500 600 700 1800
4.00 400 500 600 1500
3.00 300 400 500 1200
2.00 200 300 400 900
1.00 100 200 300 600
7. Supply Curve and The Law of Supply
Supply Curve –
The supply curve is a geometrical representation of the supply
schedule. The upward sloping curve clearly indicates that as
price rises, quantity supplied expands and vice –versa.
The Law of Supply –
The law of supply states that “other things remaining constant,
the quantity supplied varies directly with the price i.e. when the
price falls, supply will contract and when price rises, supply will
extend”.
According to S. E. Thomas, “a rise in price tends to increase supply
and a fall in price tends to reduce it. There is functional
relationship between supply and price. Mathematically S = F(P).
8. Assumptions for the Law of Supply
The other things which should remain constant for the law to
operate are –
1. Number of firms, the scale of production and the speed of
production.
2. Availability of other inputs
3. Techniques of production
4. Cost of production
5. Market prices of other related goods
6. Climate and weather conditions.
9. Exceptions to the Law of Supply
Generally supply expands with the rise in price and contracts with
fall in price, but under certain exceptional circumstances, in spite
of rise in price, supply may not expand or at a lower rate more
quantity may be sold. In this case the supply curve slopes
backward.
Exceptions to the Law of Supply –
1. If the seller is badly in need of money, he will sell more even at
lower prices.
2. If the seller wants to get rid of his products, then also he will sell
more at reduced rates.
3. When further heavy fall in price is anticipated the seller may
become panicky and sell more at current lower price.
4. In case of auction, the auctioneer is not interested in maximizing
profits by selling more units at a higher price, at the price is
determined by bidders.
10. Changes or Shift in Supply
Changes in Supply -
When supply of a product changes only due to a change in the price
of that product alone, it is called as either expansion or
contraction in supply. Expansion in supply means more quantity
is supplied at a higher price and contraction in supply means,
less quantity is supplied at a lower price.
Increase in Supply -
It implies more supply at the same price or same quantity of supply
at a lower price.
Decrease in Supply –
It implies that less quantity is supplied at the same price or same
quantity is supplied at a higher price.
11. Managerial Uses of the Law of Supply
Helps a producer to take decisions with respect to –
1. What product he has to produce and sell
2. Helps him to maintain a balance between stock and supply
3. Helps him in preparing the sales budget policy
4. Helps in estimating the present and future expected revenue and
profit levels
5. Helps to analyze the effects of taxed on total sales in the market
6. Helps to analyze the impact of various govt. policies on the supply
of a product
7. Helps in identifying the factors which affect supply of a product.
12. Elasticity of Supply
Elasticity of supply refers to the sensitiveness or responsiveness of
supply to a given change in price. It measures the degree of
adjustability of supply to a given change in price of a product.
ES = % change in supply / % change in price = 8%/2% = 4
It implies that at the present level with every change in price one
time, there will be a change in supply four times directly.
Usually elasticity of supply is positive.
Types of Elasticity of Supply -
Like demand, elasticity of supply is also equal to infinity, zero,
greater than one, lower than one and equal to one.
1. Perfectly elastic supply –
Supply is said to be perfectly elastic when a slight change in price
leads to immeasurable changes in supply. Hence, supply curve
would be a horizontal or parallel line to OX axis.
13. 2. Perfectly Inelastic Supply -
When supply of a commodity remains constant and does not change
whatever may be the change in price, it is said to be absolutely or
perfectly inelastic supply and the supply curve tends to be a
vertical straight line. ES = 0 (Zero).
3. Relatively Elastic Supply -
If change in the supply is more than proportionate to the change in
price, elasticity of supply is greater than one. In that case, the
supply curve is flatter and is more inclined to x axis.
4. Relatively Inelastic Supply -
If the change in supply is less than proportionate to a given change in
price, then, elasticity of supply is said to be less than one. Hence,
supply curve will go up sharply.
5. Unitary Elastic Supply -
If proportionate change in supply is exactly equal and proportionate
to the change in price, then elasticity of supply is equal to one.
14. Factors Determining Elasticity of Supply (Determinants)
1. Time period
2. Availability and mobility of factors of production
3. Technological improvements
4. Cost of Production
5. Kinds and nature of markets
6. Political conditions
7. Number of sellers
8. Prices of related goods
9. Goals of the firm
15. Practical Importance
1. The concept of elasticity of supply is of great importance to
the finance minister while formulating the taxation policy of
the country. If the supply is inelastic, the imposition of tax
may not bring about any change in the supply. If supply is
elastic, reasonable taxes are to be levied.
2. The price of a commodity depends upon the degree of
elasticity of demand and supply.
3. It is used in the theory of incidence of taxation. The money
burden of taxation is shared by the tax payers and the
sellers in the ratio of elasticity of supply and demand.
16. Market Equilibrium
Equilibrium –
Equilibrium is a state of even balance in which opposing forces or
tendencies neutralize each other. It is a position of rest
Characterized by absence of change. It is a state where there is
complete agreement of the economic plans of the various market
participants so that no one has a tendency to revise or alter his
decision.
Market Equilibrium –
There are two approaches to market equilibrium, viz. Partial
equilibrium approach and the general equilibrium approach.
The partial equilibrium approach to pricing explains price
determination of a single commodity keeping the prices of other
commodities constant. On the other hand, the general equilibrium
approach explains the mutual and simultaneous determination of
the prices of all goods and factors. This way it explains multi-market
equilibrium position.
17. Equilibrium between demand and supply price
Equilibrium between demand and supply price is obtained by the
interaction of these two forces. Price is an independent variable.
Demand and supply are dependent variables. They depend on
price. Demand varies inversely with price, a rise in price causes a
fall in demand and a fall in price causes a rise in demand. Thus a
demand curve will have a downward slope indicating the
expansion of demand with a fall in price and contraction of
demand with a rise in price.
On the other hand supply varies directly with the changes in price,
a rise in price causes a rise in supply and fall in price causes a full
in supply. Thus the supply curve will have an upward slope.
At a point where these two curves intersect with each other, the
equilibrium price is established. At this point quantity
demanded equals the quantity supplied.
18. Equilibrium between demand and supply –
y D S
P2
P1
S D
0 x
Price in Rs Demand in Units Supply in Units
30 5 25
25 10 20
20 15 15
10 20 10
5 30 5
19. Changes in Market Equilibrium
The changes in equilibrium price will occur when there will be shift
either in demand curve or in supply curve or both.
Effects of Shift in Demand – Demand changes when there is a
change in the determinants or demand like the income, tastes,
prices of substitutes and complements, size of the population
etc. If demand raises due to a change in any one these
conditions the demand curve shifts upward to the right. If on
the other hand demand falls, the demand curve shifts
downward to the left. Such rise and fall in demand are referred
to as increase and decrease in demand. Y D
D1 S
P1 D2
E1
P E D1
P2 E2 D
S
0 Q1 Q Q1 D2 X
20. Effects of Change in Both Demand and Supply –
Changes can occur in both demand and supply conditions. The
effects of such changes on the market equilibrium depend on
the rate of change in the two variables. If the rate of change in
demand is matched with the rate of change in supply, there will
be no change in the market equilibrium, the new equilibrium
shows expanded market with increased quantity of both supply
and demand at the same price. When decrease in demand is greater
than decrease in supply on market
Y
Y D D1 S D S1 S
S1 Price
D1
P E E1 P E1
P1 E
D
S S1 D1 S1 D1
0 D X S