Download as PDF, PPTX
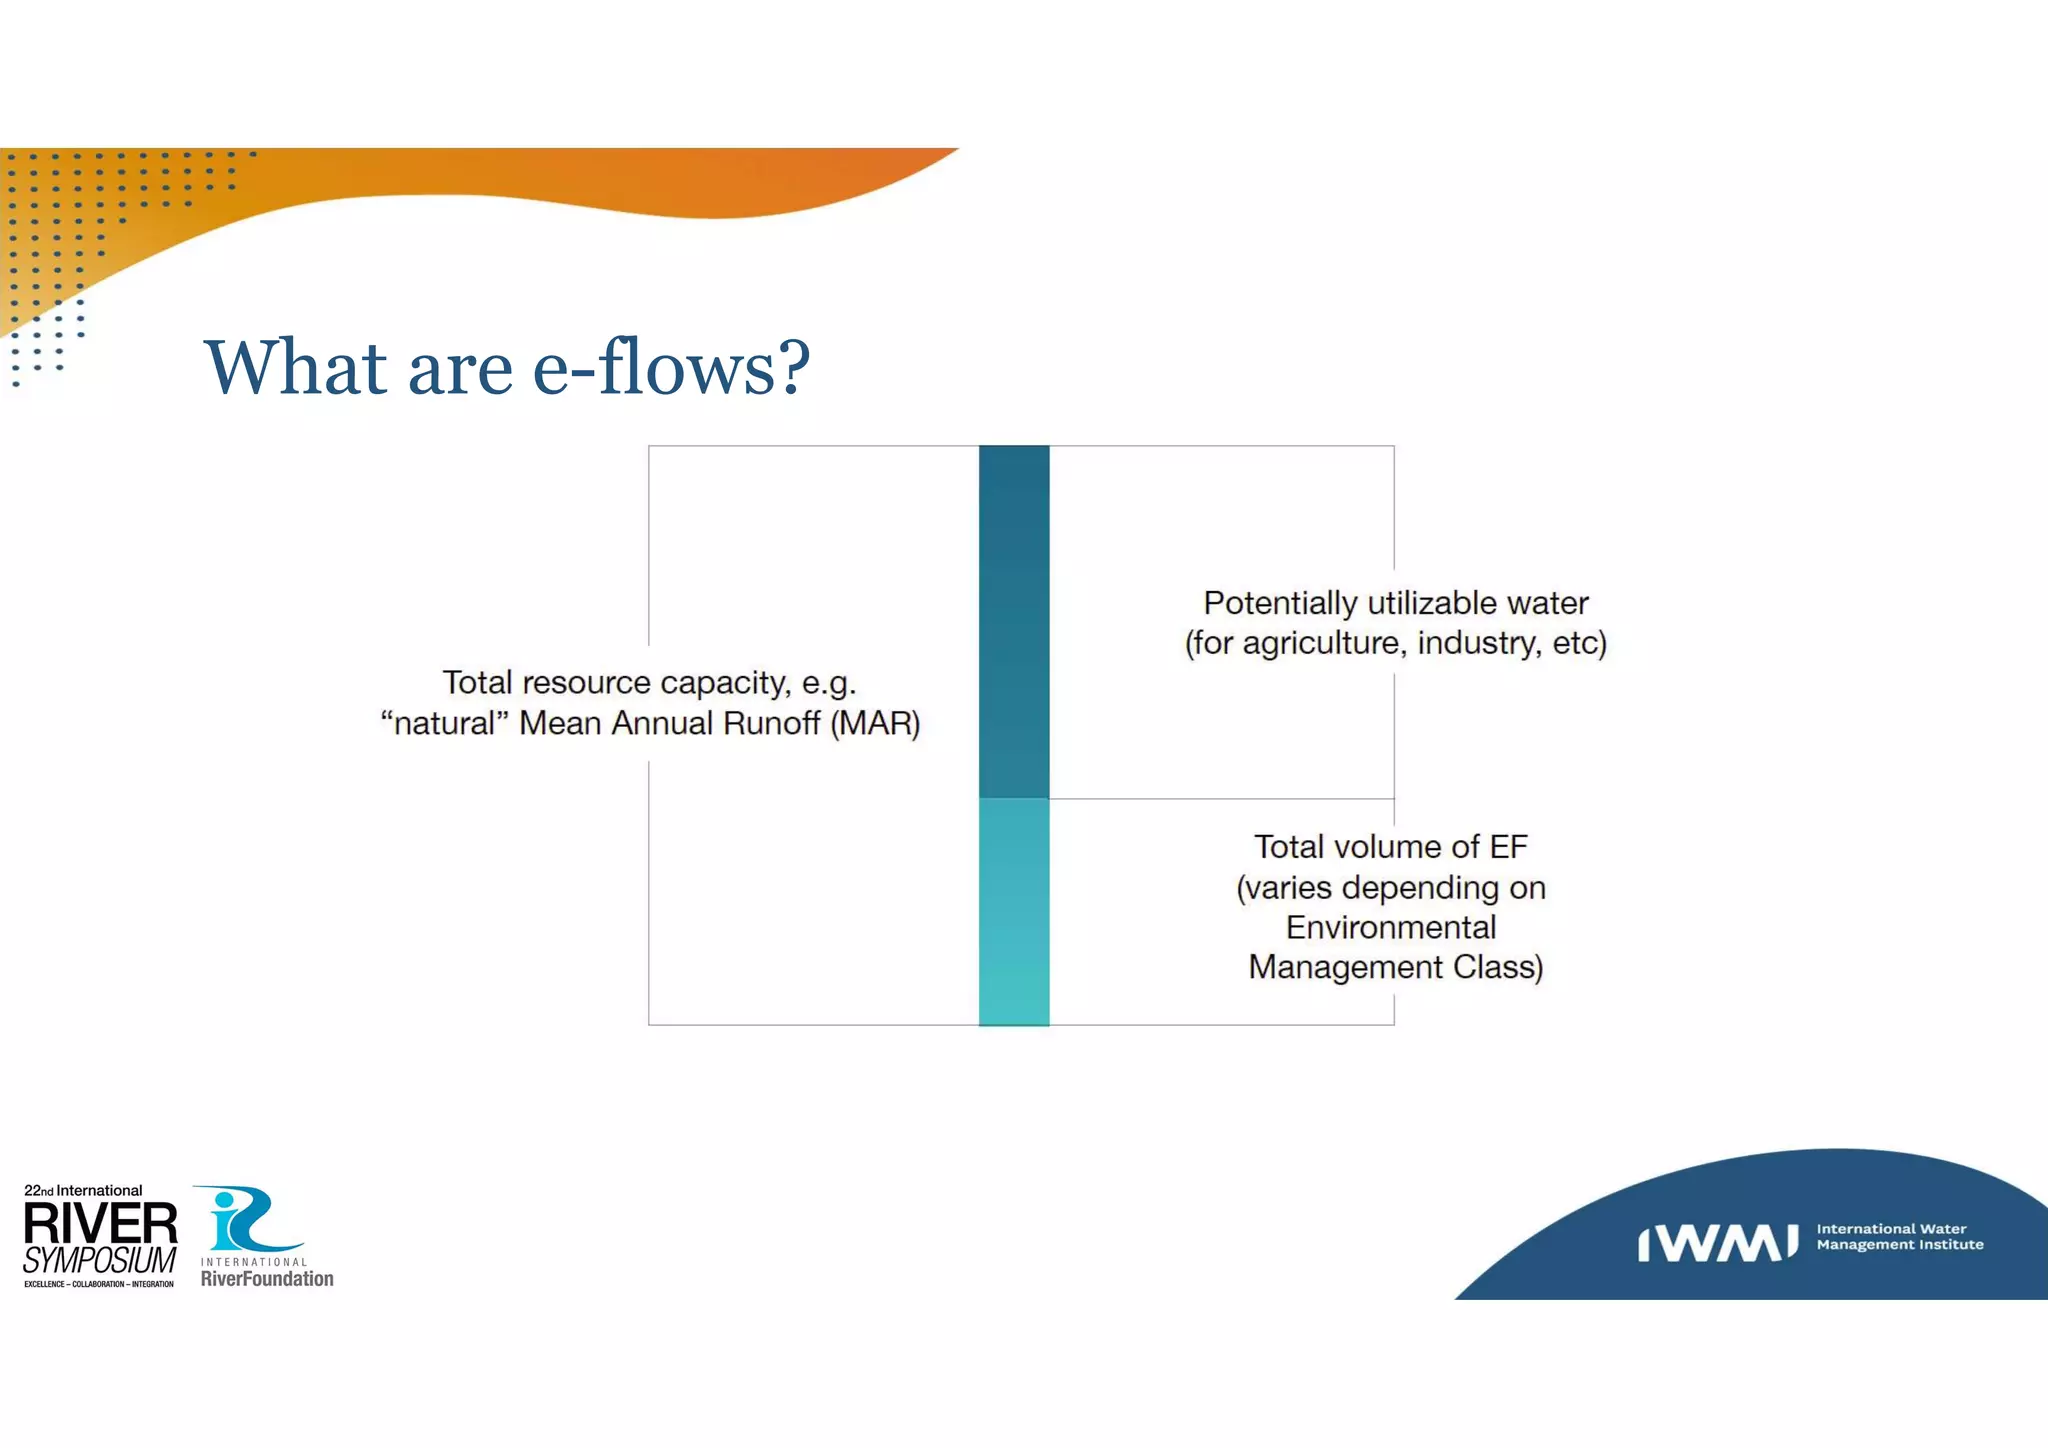


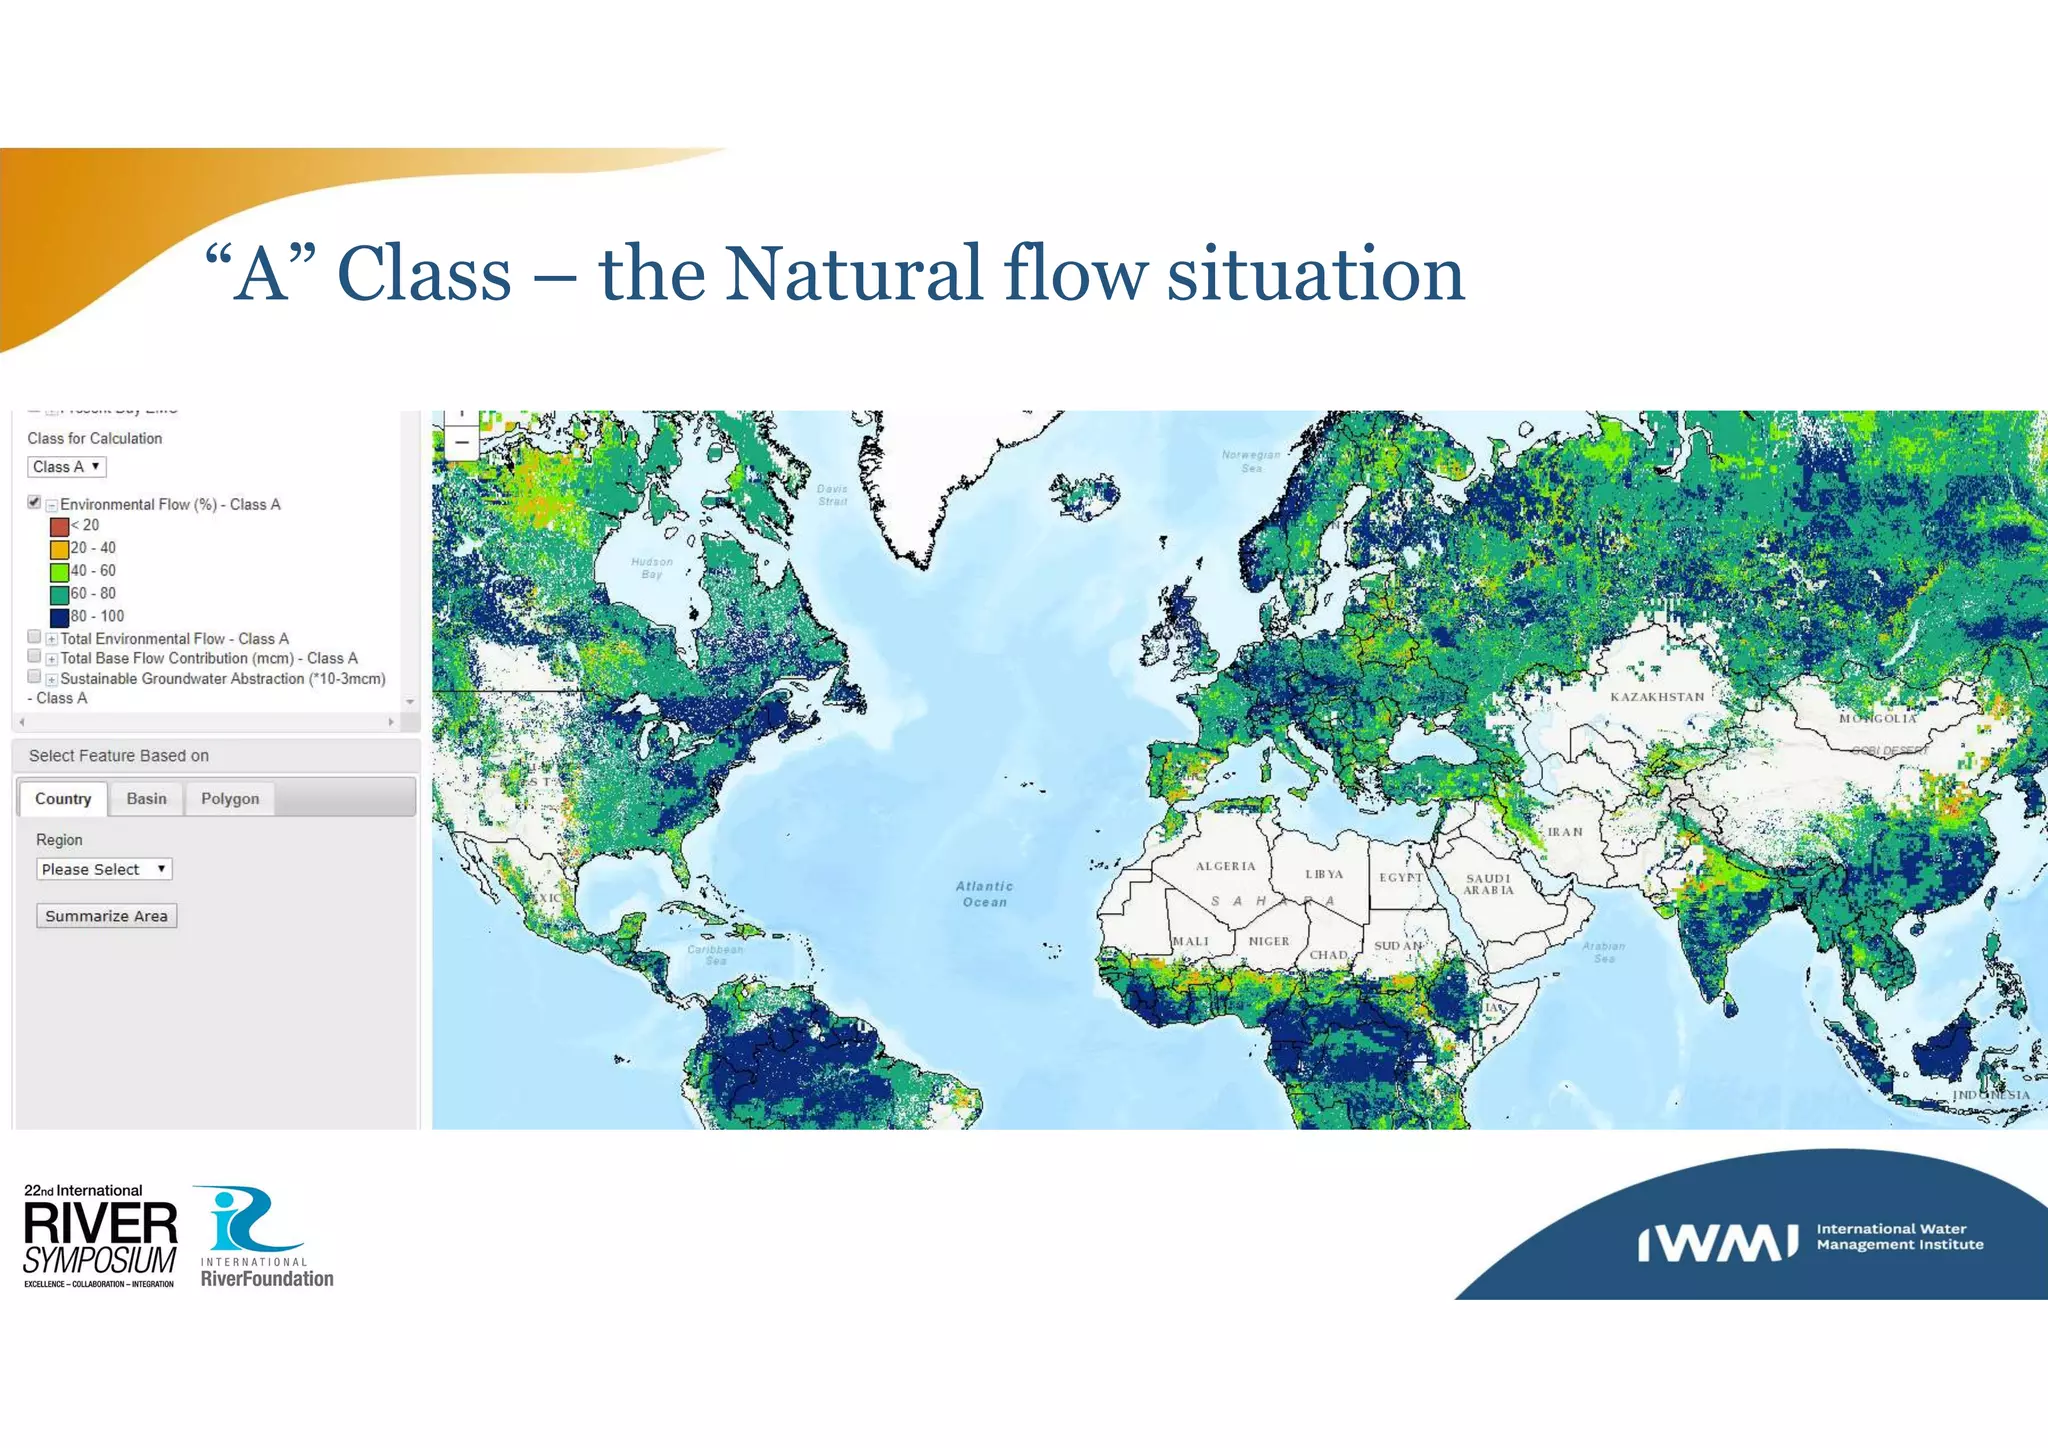
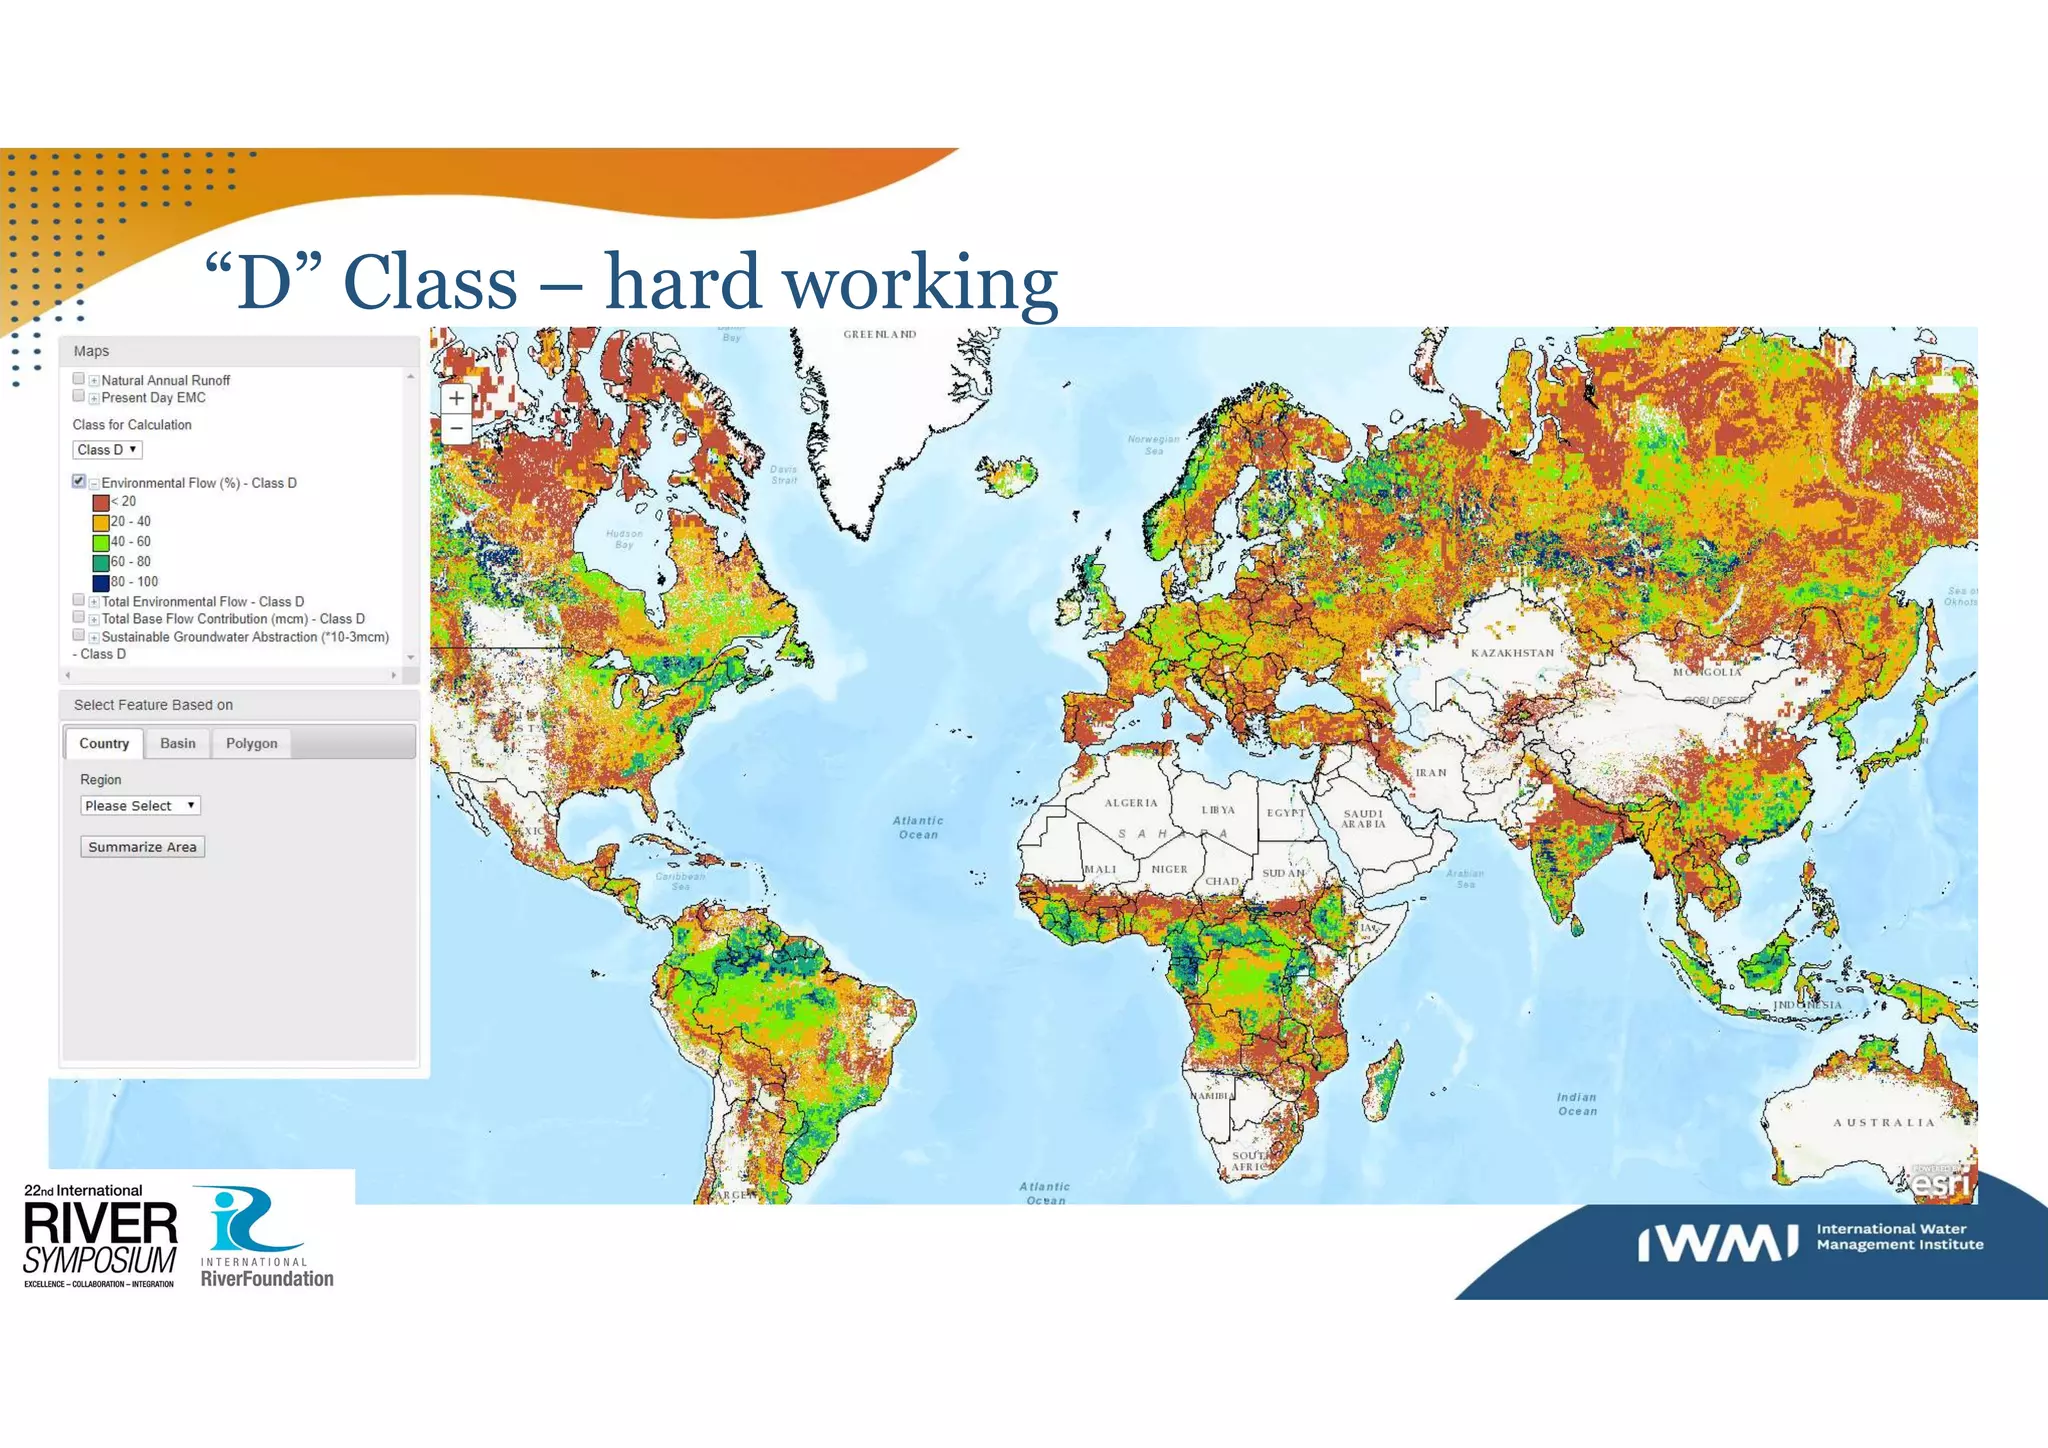
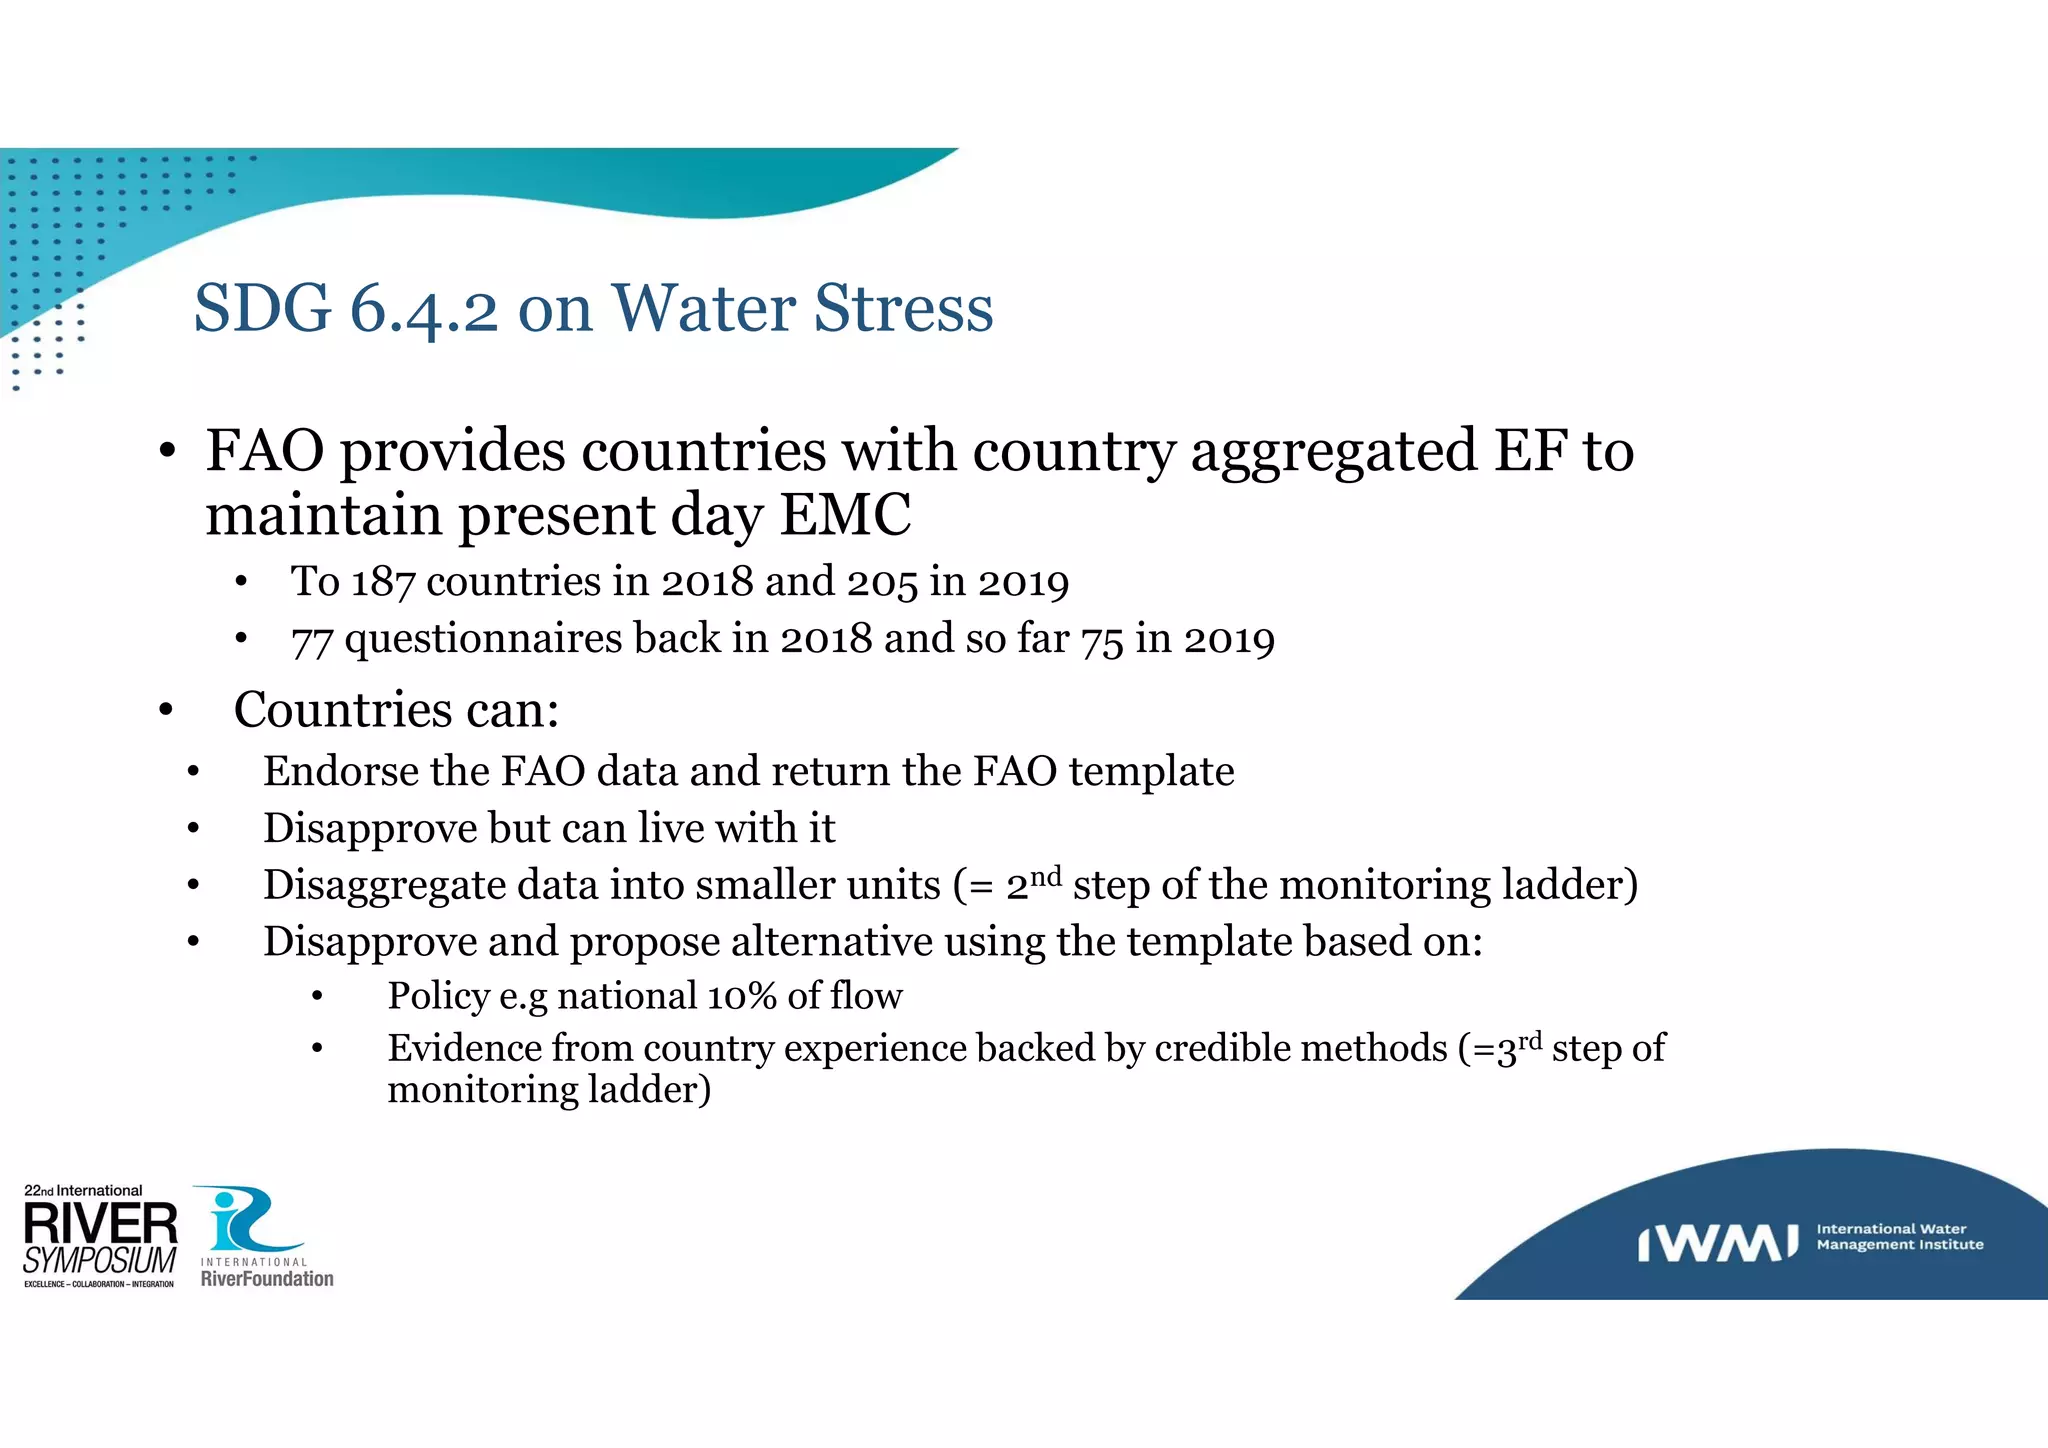


The document discusses environmental flows (e-flows) in relation to Sustainable Development Goal (SDG) 6.4.2, focusing on water stress and the management of freshwater resources. It highlights the role of the FAO in providing countries with aggregated e-flow data and outlines the process for countries to validate or propose adjustments to this data. Additionally, it emphasizes the importance of ecological management classes in setting targets to maintain ecological balance within water resources.