Downloaded 257 times

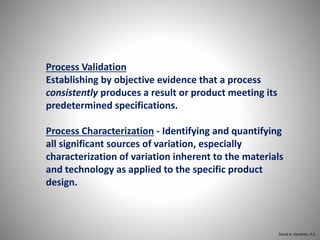
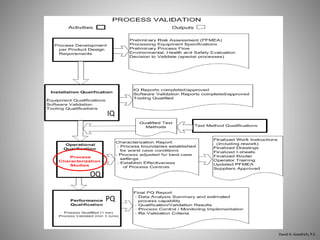
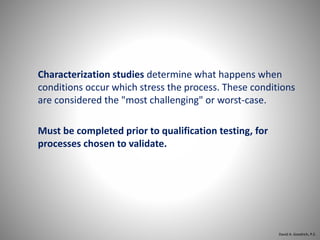
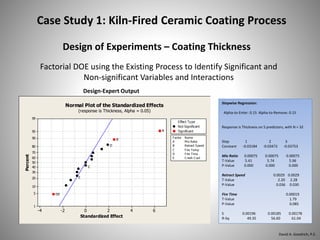
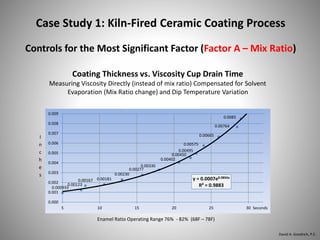
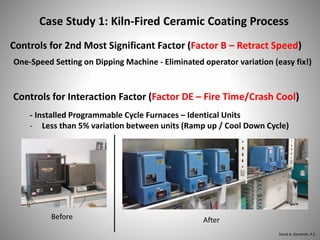
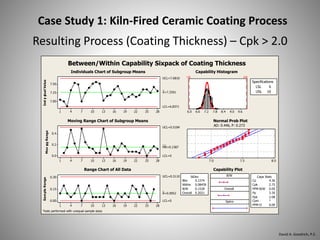
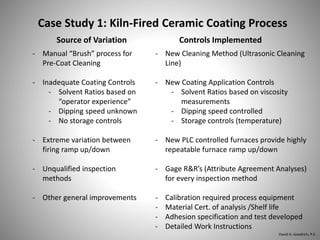
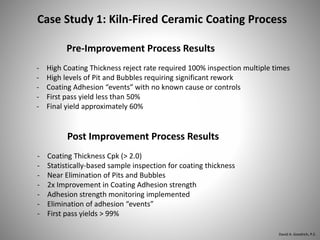
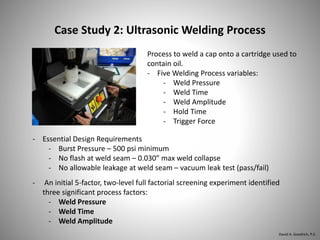
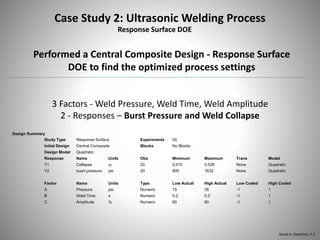
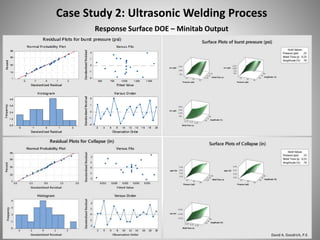
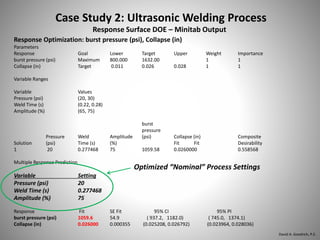
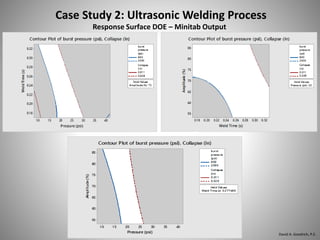
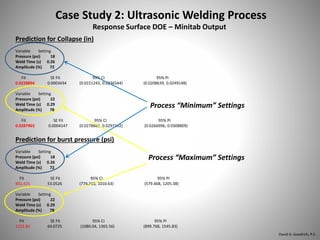
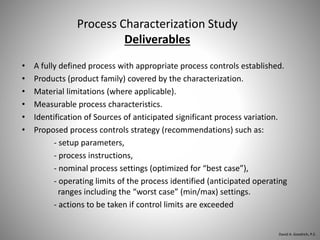
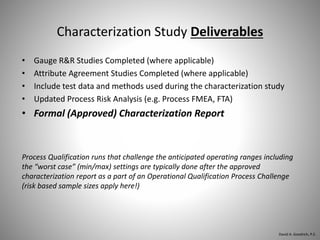
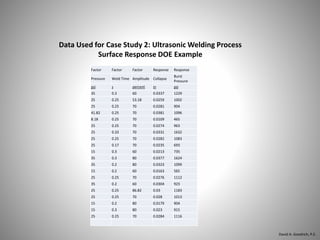

The document discusses the role of process characterization in process validation. It begins by defining process validation and process characterization. Process characterization aims to identify and quantify all significant sources of variation, especially inherent variation in materials and technology as applied to the specific product design. Characterization studies determine how the process performs under worst-case conditions prior to qualification testing. The document then provides two case studies as examples of using design of experiments to characterize processes and identify optimal process settings.


