The Preliminary Project Report
Reporting your Project work
The Format of the Preliminary Project Report
Format of the Project Report
Citing your references
the reference list
Referencing other parts of your report −
cross-referencing
Quoting, summarising, avoiding plagiarism
Faults in reports
What is a Project and Project Management? This presentation helps you to gain more knowledge about how to manage a project and helps in understanding the Project Life Cycle.
In a competitive global economy, project managers can't survive without leaning efficient Project Management. So here’s a presentation giving an insight into the different components of project management. Discover more about Project Management and what benefits it offers, and choose understand its related concepts.
Project management tools and techniquesTata Dinyuy
The different tools and techniques used to plan projects ( both micro and macro projects) including human, material, financial and scheduling techniques (how to draw up Gantt charts, work breakdown schedule, network diagrams and the Program Evaluation and Review Technique)
PMP Lecture 1: Introduction to Project ManagementMohamed Loey
https://mloey.github.io/courses/pmp2017.html
https://www.youtube.com/watch?v=XUoEr6kee6k&list=PLKYmvyjH53q13_6aS4VwgXU0Nb_4sjwuf&index=1&t=2s
We will discuss the following: History of Project Management, Project Management, Program Management, Portfolio Management, Project Management Office, PMBOK, PMI.
Project identification and Project selectionAmandaBvera
This presentation covers the topic of project identification and project selection. It sheds light on the meaning of the project, meaning of project identification, classification of projects, types of opportunities, dimensions of project identification, criteria for project selection and constraints involved in project selection. Enjoy learning!
How to make a project report for schools, colleges, universities, researchers...Payaamvohra1
This ppt gives you an idea about frequently made project report. Do checkout my other ppt based on research proposal, review paper, internship report etc.
TABLE OF CONTENTS1Project Background22Purpose of the Pro.docxssuserf9c51d
TABLE OF CONTENTS
1Project Background2
2Purpose of the Project2
3expected project outcomes3
4Methodology to be Adopted and Project Schedule3
5Ethics Issues Related to the Project4
6REFERENCES5
2 Your Report Title Goes Here (Do not exceed 50 Characters in length)
i
Project Background
This section must provide a discussion of the background of the project being undertaken as part of the Industry Affiliates Program (IAP). It should clearlyoutline the project being undertaken, as well as identify the need on which the project is based. This will include a brief outline of the social, economic, environmental or organisational justification for the development of the project.You should provide a brief background about what is already known about the topic, including some review of relevant literature here.
It is expected that the Project Planning Report will require no more than six (6) ± 10%A4 pages of text, not including the title page, table of contents and risk assessment. The electronic copy of the full submitted document must not exceed 5.0 MB. Files which exceed the size limit will not be marked until they are reduced in size to 5.0 MB. Delays resulting from reduction in the size of the final report will incur standard penalties resulting from late submission of assessment items.
Projects which involve the use of University-provided software must state on the front of all deliverables, including the Project Planning Report, the following statement:
“This project was created using ……………..software provided by the University. Use of, or commercialisation of the product created pursuant to the project is not permitted under the terms of the license agreement governing the university’s use of the aforementioned software. The project and the product created there under is provided only on the basis that any use of or commercialisation of the product is replicated through appropriate commercial software.”
Purpose of the Project
An important part of the project plan relates to the definition of your research question, project focus or issue being investigated. This section of the report should clearly identify the research question, project focus or issue being investigated. It should also clearly identify the scope, aims and objectivesof the project.
It is important that there is a logical and clear link between your research question, project focus or issue, and your aims, objectives and the expected outcomes from your project. Remember that aims are big picture items which are generally not able to be measured against, whilst you should be able to measure whether or not your objectives have been met. Generally the outcomes will allow you to meet your defined objectives, which will satisfy the aims within the scope specified. In turn, these aims should allow you to answer the research question, project focus or issue you have set for the study.
expected project outcomes
This section must provide a description of the expe ...
1
Assessment Brief
Module Name:
Module Code Level Credit Value Module Leader STRM059 7 30
Assessment title:
Research Project Report (7500 words)
Weighting: 100%
Submission dates: 7 Jan 2023
Feedback and
Grades due:
Please see NILE under Assessment Information
Please read this assessment brief in its entirety before starting work on the Assessment Task.
Purpose of Assessment
The purpose of this assignment is to enable learners to develop advanced-level independent
research and critical problem-solving skills within a business context. Learners will develop
knowledge of, proficiency in, and application of a range of management research
methodologies including qualitative and quantitative research methods resulting in proposals/
recommendations.
The Assessment Task
In the current international economic environment, entrepreneurs and managers are
frequently required to undertake business planning, project and consultancy work in addition
to their core responsibilities. Frequently, these projects are focused upon investigating new
business opportunities or potential strategic changes in order to create, retain and extend
competitive position.
The assessment task is to produce a 7500 words (±10%) research project report based on an
independent research, which investigates a business/organisational or management problem,
2
issue or challenge, applies appropriate research techniques and analysis, and consequently
informs the development of a business plan and/ or results in recommendations for change.
Where the submission exceeds the stipulated word limit by more than 10%, the submission will
only be marked up to and including the additional 10%. Anything over this will not be included
in the final grade for the assessment item. Abstracts, bibliographies, reference lists, appendices
and footnotes are excluded from any word limit requirements.
Where a submission is notably under the word limit, the full submission will be marked on the
extent to which the requirements of the assessment brief have been met.
Additional Guidance
Projects should be submitted with the UoN Faculty of Business & Law Ethics Form which has
been signed by your project supervisor. The blank Ethics Form, sample Participant Information
and Consent Forms/ Templates are available at the end of this assignment brief. Please see
NILE for additional guidance about appendices.
Learning Outcomes
On successful completion of this assessment, you will be able to:
Subject-Specific Knowledge, Understanding & Application
a) Critically assess and apply theoretical concepts, constructs and models required to analyse
business-related problems, plans and issues.
b) Evaluate and implement appropriate research methodologies to examine management and
business-related issues.
c) Enact appropriate ethical standards and use suitable tools to collect quantitative and
qualitative data.
d) Demonstrate the ability to link question formulation or research aim and objectives to data
analyses, interpretations.
CS project notes 1 Notes for Final Project Dissertation .docxannettsparrow
CS project notes 1
Notes for Final Project Dissertation
This document contains an overview of the marking scheme for projects with some notes that should be useful
for planning, executing and writing up your final project dissertation. This should be useful for anyone taking a
project module but is aimed in particular towards students in the Computer Science course group (CS, CGT).
1 Marking Criteria
Title – Meaningful, descriptive but not too long (must not promise anything that you do not deliver)
Abstract – brief overview of what you did (last thing to be written)
Introduction (10%)
State the hypothesis and aims, background to subject leading to a definition of the 'problem' or
'application domain' for your work, what you hope to achieve (i.e. what aspect you are addressing with
your work) and how you intend to go about it (more details in the methodology section).
Make sure you have appropriate title and achievable aims
Use of Literature (15%)
Can be in its own section but 'use of literature' applies to whole document. Brief description i.e. (a
single paragraph) of 4 – 10 key texts (but this number rather depends on the work you are doing) where
you say what was useful for your work. Also remember to use citations throughout your work as you
introduce ideas and make claims that need support. Overview of alternative approaches and software
can also go here or in the introduction.
Methodology (20%)
Rational for approach, i.e. why use this way of solving the problem?
Design (often big enough to be its own section) provide specification, description and diagrams.
Marks given for originality and difficulty of task
Implementation and results (15%)
Description of functionality and provision of evidence (testing).
Make sure you are clear about what resources you have used and what is 'your' contribution.
Summary of test output (raw data mostly in appendices)
Can also provide screen capture video clips and snapshots
Usefulness and usability for intended audience.
Discussion – what has your work demonstrated, how has this effected the target problem / application
area.
Discussion (20%)
Interpretation of results
Evaluation of approach
Wider implications of work
Discussion – what has your work demonstrated, how has this effected the target problem / application
area. This will need to link to other work / applications so you may need to reference some of the
literature and/or add to your references with some more research.
Conclusion (10%)
Brief summary of what has been achieved, Critical appraisal of work and future work / improvements
to be made.
Presentation (15%) - discuss with project supervisor, here are some general suggestions.
Layout, use of English, spelling, grammar, academic style, binding, Turnitin report.
Use page numbers, numbered headings and sub-headings, contents list for headings and figures,
running headers with chapter title and appendices.
Code printed out to.
For more classes visit
www.snaptutorial.com
Course Project: Portfolio Management Plan
Your Professor will determine whether the Course Project is an individual or team assignment. If th
For more course tutorials visit
www.tutorialrank.com
Course Project: Portfolio Management Plan
Your Professor will determine whether the Course Project is an individual or team assignment. If the project is completed as a team, your professor will assign teams promptly. (Watch for an announcement.)
Objectives | Project Deliverables | Schedule and Grading Rubric | Paper Guidelines | Best Practices
Objective
The project for this course is a portfolio management plan for a company of your choice. You may use your own employer or a public company you can research to provide necessary details. To get started, you need to know the company's strategic plan and strategic capacity plan.
For more classes visit
www.snaptutorial.com
Course Project: Portfolio Management Plan
Your Professor will determine whether the Course Project is an individual or team assignment. If the project is completed as a team, your professor will assign teams promptly. (Watch for an announcement.)
Course Project: Portfolio Management Plan
Your Professor will determine whether the Course Project is an individual or team assignment. If the project is completed as a team, your professor will assign teams promptly. (Watch for an announcement.)
Objectives | Project Deliverables | Schedule and Grading Rubric | Paper Guidelines | Best Practices
Objective
The project for this course is a portfolio management plan for a company of your choice. You may use your own employer or a public company you can research to provide necessary details. To get started, you need to know the company's strategic plan and strategic capacity
For more classes visit
www.snaptutorial.com
Course Project: Portfolio Management Plan
Your Professor will determine whether the Course Project is an individual or team assignment. If the project is completed as a team, your professor will assign teams promptly. (Watch for an announcement.)
Objectives | Project Deliverables | Schedule and Grading Rubric | Paper Guidelines | Best Practices
Objective
For more classes visit
www.snaptutorial.com
Course Project: Portfolio Management Plan
Your Professor will determine whether the Course Project is an individual or team assignment.
For more classes visit
www.snaptutorial.com
Course Project: Portfolio Management Plan
Your Professor will determine whether the Course Project is an individual or team assignment. If the project is completed as a team, your professor will assign teams promptly. (Watch for an announcement.)
Objectives | Project Deliverables | Schedule and Grading Rubric | Paper Guidelines | Best Practices
Brunel Business SchoolMG3123 Issues and Controversies in M.docxjasoninnes20
Brunel Business School
MG3123 Issues and Controversies in Marketing
Guidelines on preparing the Project Report for 2019/20
Assessment title:
Final Year Project Report
Module leader:
Lynne P Baldwin
Distribution date:
23 September 2019 (day 1 of Term 1)
Submission deadline:
12:00 noon on Wednesday 26 February 2020
Feedback by:
Within 25 working days. That is, by Thursday 2 April 2020
Contribution to overall module assessment:
100%
Indicative student time working on assessment:
350 hours
Word or page Limit (if applicable):
8000 words (not including references)
Assessment type (individual or group):
individual
Main objective of the assessment
To write a report of a piece of research. This involves being able to use the literature in order to identify a suitable research problem/issue or opportunity to explore, to design/implement a study using suitable and appropriately justified research methods, to present the findings and finally to provide conclusions. You will also have demonstrated that the requirements of responsible ethical behaviour in research were taken into account. All of this encourages you towards becoming an ‘independent’ researcher. Being independent means (amongst other things) being capable of: (a) formulating good questions; (b) developing and presenting well-informed and well-supported arguments; and (c) defending your arguments in open discussion. Learning to deal with complex, open-ended problems and limited, often ambiguous, information is an extremely valuable preparation for future challenges.
Description of the assessment
In this, you will have shown how you have “draw[n] on the literature in the field, analyse[d] and interpret[ed] research evidence of a discipline-specific phenomenon in order to identify a suitable research problem/issue or opportunity to explore”, that you have “identified a suitable research problem/issue or opportunity, design[ed] and implement[ed] a research investigation/study, use[d] suitable research methods, appropriately justified, and report[ed] efficiently and effectively on the findings, conclusions and (where appropriate) proposals for appropriate action thereof”. You will also have demonstrated “that the requirements of responsible ethical behaviour in research [were] suitably taken into account”. You need to provide evidence that you have understood and met “the requirements of responsible ethical behaviour in research”. These quotes come from the learning outcomes published in the module block outline.
The Project Report should consist of a carefully-crafted account of your Project. It is important to remember that this Report is the only evidence that the markers are able to use when assessing your work. These guidelines are designed to help you to prepare the best document/Report possible, so that you do full justice to the research you have undertaken. Please read in conjunction with the marking scheme.
Format
· Project reports must contain no more tha ...
Breakeven Analysis- A decision-making aid that enables a manager to determine whether a particular volume of sales will result in losses or profits.
Made up of four basic concepts
Fixed costs- costs that do not change
Variable costs- costs that rise in propitiation to sales
Revenue- the total income received
Profit- the money you have after subtracting fixed and variable cost from revenue
A market can be defined as a group of firms willing and able to sell a similar product or service to the same potential buyers.
Imperfect competition covers all situations where there is neither pure competition nor pure monopoly.
Perfect competition and pure monopoly are very unlikely to be found in the real world.
In the real world, it is the imperfect competition lying between perfect competition and pure monopoly.
The fundamental distinguishing characteristic of imperfect competition is that average revenue curve slopes downwards throughout its length, but it slopes downwards at different rates in different categories of imperfect competition.
Monopoly refers to the market situation where there is a
Single seller selling a product which has no close substitutes.
Monopolies are characterized by a lack of economic competition to produce the good or service, a lack of viable substitute goods, and the existence of a high monopoly price well above the firm's marginal cost that leads to a high monopoly profit
The word “oligopoly” comes from the Greek “oligos” meaning "little or small” and “polein” meaning “to sell.” When “oligos” is used in the plural, it means “few” ,few firms or few sellers.
DEFINATION:
Oligopoly is that form of market where there are few firms and there is natural interdependence among the firms regarding price and output policy.
Isoquant is also called as equal product curve or production indifference curve or constant product curve. Isoquant indicates various combinations of two factors of production which give the same level of output per unit of time.
Just as an indifference curve represents various combinations of two goods which give a consumer equal amount of satisfaction, an iso-product curve shows all possible combinations of two inputs physically capable of producing a given level of output. Since an iso-product curve represents those combinations which will result in the production of an equal quantity of output, the producer would be indifferent between them.
This law was given by Alfred Marshall in his book principle of economics.
It show particular pattern of change in output when some factor remain fixed.
Production depend upon factors of production , if factors of production are good, production may increase and vice-versa.
Production function show functional relationship between production and factors of production.
It refers to manner of change in output cost by the increase in all the input simultaneously and in the same proportion.
Returns refers to “change in physical output”
Scale refers to “quantity of input employed”
Change in scale means that all factors of production are increased or decreased in same proportion.
The cost advantage that arises with increased output of a product.
It arises because of the inverse relationship between the quantity produced and per-unit fixed cost.
Profit refers to the excess of receipts from the sale of goods over the expenditure incurred on producing them.
The amount received from the sale of goods is known as ‘revenue’ and the expenditure on production of such goods is termed as ‘cost’. The difference between revenue and cost is known as ‘profit’.
For example, if a firm sells goods for Rs. 10 crores after incurring an expenditure of Rs. 7 crores, then profit will be Rs. 3 crores.
The law of demand expresses the functional relationship between price and quantity demanded.
Assumption of ‘ Ceteris Paribus’. A hypothetical assumption
If price of a commodity falls, the quantity demanded of it will rise and vice versa.
Inverse relationship between price and quantity
Other factors also play an important role.
Real world variables.
The indifference curve analysis has also been used to explain producer’s equilibrium, the problems of exchange, rationing, taxation, supply of labour, welfare economics and a host of other problems. Some of the important problems are explained below with the help of this technique.
(1) The Problem of Exchange:
With the help of indifference curve technique the problem of exchange between two individuals can be discussed. We take two consumers A and В who possess two goods X and Y in fixed quantities respectively. The problem is how can they exchange the goods possessed by each other. This can be solved by constructing an Edgeworth-Bowley box diagram on the basis of their preference maps and the given supplies of goods.
Application of indifference curve analysisYashika Parekh
The law of demand expresses the functional relationship between price and quantity demanded.
Assumption of ‘ Ceteris Paribus’. A hypothetical assumption
If price of a commodity falls, the quantity demanded of it will rise and vice versa.
Inverse relationship between price and quantity
Other factors also play an important role.
Real world variables.
The indifference curve analysis has also been used to explain producer’s equilibrium, the problems of exchange, rationing, taxation, supply of labour, welfare economics and a host of other problems. Some of the important problems are explained below with the help of this technique.
(1) The Problem of Exchange:
With the help of indifference curve technique the problem of exchange between two individuals can be discussed. We take two consumers A and В who possess two goods X and Y in fixed quantities respectively. The problem is how can they exchange the goods possessed by each other. This can be solved by constructing an Edgeworth-Bowley box diagram on the basis of their preference maps and the given supplies of goods.
It is a stream of social sciences and commerce.
It is a study of production, consumption, distribution and regulation of flow of goods and services in an economy.
It has a direct relation with money.
It studies the economic aspect of goods and services provided in the economy.
It is a wider concept and hence affects the overall conditions of the economy.
It has two major segments: micro and macro. It is derived from Greek word ‘Mikros’.
It creates efficiency and smoothens up the process of final consumption of goods and services.
It tries to understand the problems that occur while producing, distributing and consuming a product.
It deepens our understanding.
Consumption is a broader term and it is the essence of economics. Economists generally consider consumption to be the final purpose of economic activity, hence consumption per person is a central measure of an economy’s productive success.
Consumption in economics means utilization of a product or a commodity and to derive benefits from the same. The utility of a product will help us in satisfying our needs and hence it is consumption.
Consumption can be defined in different ways, but is usually best described as the final purchase of goods and services by individuals. The purchase of a new pair of shoes, a burger at the fast food restaurant, or the service of getting your house cleaned are all examples of consumption.
It is a state of maximum satisfaction from a consumption.
A producer will obtain the stage of equilibrium when he will get maximum profit from his production.
In economics, economic equilibrium is a state where economic forces such as supply and demand are balanced and in the absence of external influences the (equilibrium) values of economic variables will not change.
Equilibrium occurs at the point at which quantity demanded and quantity supplied are equal. Market equilibrium in this case refers to a condition where a market price is established through competition.
This price is often called the competitive price or market clearing price and will tend not to change unless demand or supply changes and the quantity is called "competitive quantity" or market clearing quantity.
The Concept
A stable strategy arises out of a basic perception by the management that the firm should concentrate on using its present resources for developing its competitive strength in particular market areas.
In simple words, stability strategy refers to the company’s policy of continuing the same business and with the same objectives
A firm pursues stability strategy when
1. It continues to serve the public in the same product or service, market, and function sectors as defined in its business definition.
2. Its main strategic decisions focus on incremental improvement of functional performance.
2. Corporate Restructuring is the process of redesigning one or more aspects of a company.
3. The process of reorganizing a company may be implemented due to a number of different factors, such as positioning the company to be more competitive, surviving a currently adverse economic climate, or acting on the self confidence of the corporation to move in an entirely new direction.
Model Attribute Check Company Auto PropertyCeline George
In Odoo, the multi-company feature allows you to manage multiple companies within a single Odoo database instance. Each company can have its own configurations while still sharing common resources such as products, customers, and suppliers.
Instructions for Submissions thorugh G- Classroom.pptxJheel Barad
This presentation provides a briefing on how to upload submissions and documents in Google Classroom. It was prepared as part of an orientation for new Sainik School in-service teacher trainees. As a training officer, my goal is to ensure that you are comfortable and proficient with this essential tool for managing assignments and fostering student engagement.
How to Make a Field invisible in Odoo 17Celine George
It is possible to hide or invisible some fields in odoo. Commonly using “invisible” attribute in the field definition to invisible the fields. This slide will show how to make a field invisible in odoo 17.
Operation “Blue Star” is the only event in the history of Independent India where the state went into war with its own people. Even after about 40 years it is not clear if it was culmination of states anger over people of the region, a political game of power or start of dictatorial chapter in the democratic setup.
The people of Punjab felt alienated from main stream due to denial of their just demands during a long democratic struggle since independence. As it happen all over the word, it led to militant struggle with great loss of lives of military, police and civilian personnel. Killing of Indira Gandhi and massacre of innocent Sikhs in Delhi and other India cities was also associated with this movement.
Palestine last event orientationfvgnh .pptxRaedMohamed3
An EFL lesson about the current events in Palestine. It is intended to be for intermediate students who wish to increase their listening skills through a short lesson in power point.
Unit 8 - Information and Communication Technology (Paper I).pdfThiyagu K
This slides describes the basic concepts of ICT, basics of Email, Emerging Technology and Digital Initiatives in Education. This presentations aligns with the UGC Paper I syllabus.
Introduction to AI for Nonprofits with Tapp NetworkTechSoup
Dive into the world of AI! Experts Jon Hill and Tareq Monaur will guide you through AI's role in enhancing nonprofit websites and basic marketing strategies, making it easy to understand and apply.
Macroeconomics- Movie Location
This will be used as part of your Personal Professional Portfolio once graded.
Objective:
Prepare a presentation or a paper using research, basic comparative analysis, data organization and application of economic information. You will make an informed assessment of an economic climate outside of the United States to accomplish an entertainment industry objective.
1. 320 Project
24
6. Reporting your Project work
For additional advice, see Dawson [1, Chapter 6] for example. However, any spe-
cific directions in this guide, such as on the format of the report, should take prece-
dence over suggestions you may find elsewhere, unless you provide explicit justifi-
cation in terms of the nature of your own Project work.
6.1. The Preliminary Project Report
The Preliminary Project Report (PPR) is required in the session 2010/11 and there-
after.
The number of words in the PPR, excepting the title page and the Appendices,
should be between 2,000 and 4,000. What you write should be clearly linked to the
PDF and refer to it as and when appropriate. The PPR is much shorter than the Pro-
ject Report and its reporting requirements lighter. The PPR is essentially a milestone
for provision of a dated summary of progress and plans.
The PPR serves several purposes, including:
- providing an additional motivation for an early start on the Project, since the PPR
must achieve a pass mark as part of the requirements for passing the Project unit,
and this also means the submission occurs before the deadline for examination en-
tries
- helping set some useful targets for delivery of intermediate results and their
documentation
- forming one of the bases for a mid-session review of progress on the Project; the
specified structure aids coherent and consistent review, especially where done in
conjunction with a supervisor.
6.1.1. The Format of the Preliminary Project Report
The PPR must adhere to the following structure: -
Title page Giving the title, student name, date, supervisor name, address,
University of London student registration number.
Introduction A brief statement of how you chose your Project, whether or not it
is work-related, which units from your degree programme are
relevant to your Project work, and whether or not you have a su-
pervisor.
Terms of ref-
erence
Stating what questions you set out to answer, the deliverables you
were going to submit, and the justification for the work you have
done. These should relate to your PDF.
Progress to date Your findings, analyses, results of calculations and experiments up
to this point.
Planned work Where the problem is now and what should be done next.
Appendices Appendices should be cross-referenced from the main text as rele-
vant. No Appendix should be present unless cross-referenced from
the main text.
The following should be provided as appendices:
• A copy of your Project Description Form, following the struc-
ture specified in this subject guide and of NO MORE THAN two
pages in extent.
• Any permission letters that give provenance for a work-based
Project, or for access to specific organisations or materials.
2. Chapter 6: Reporting your Project work
25
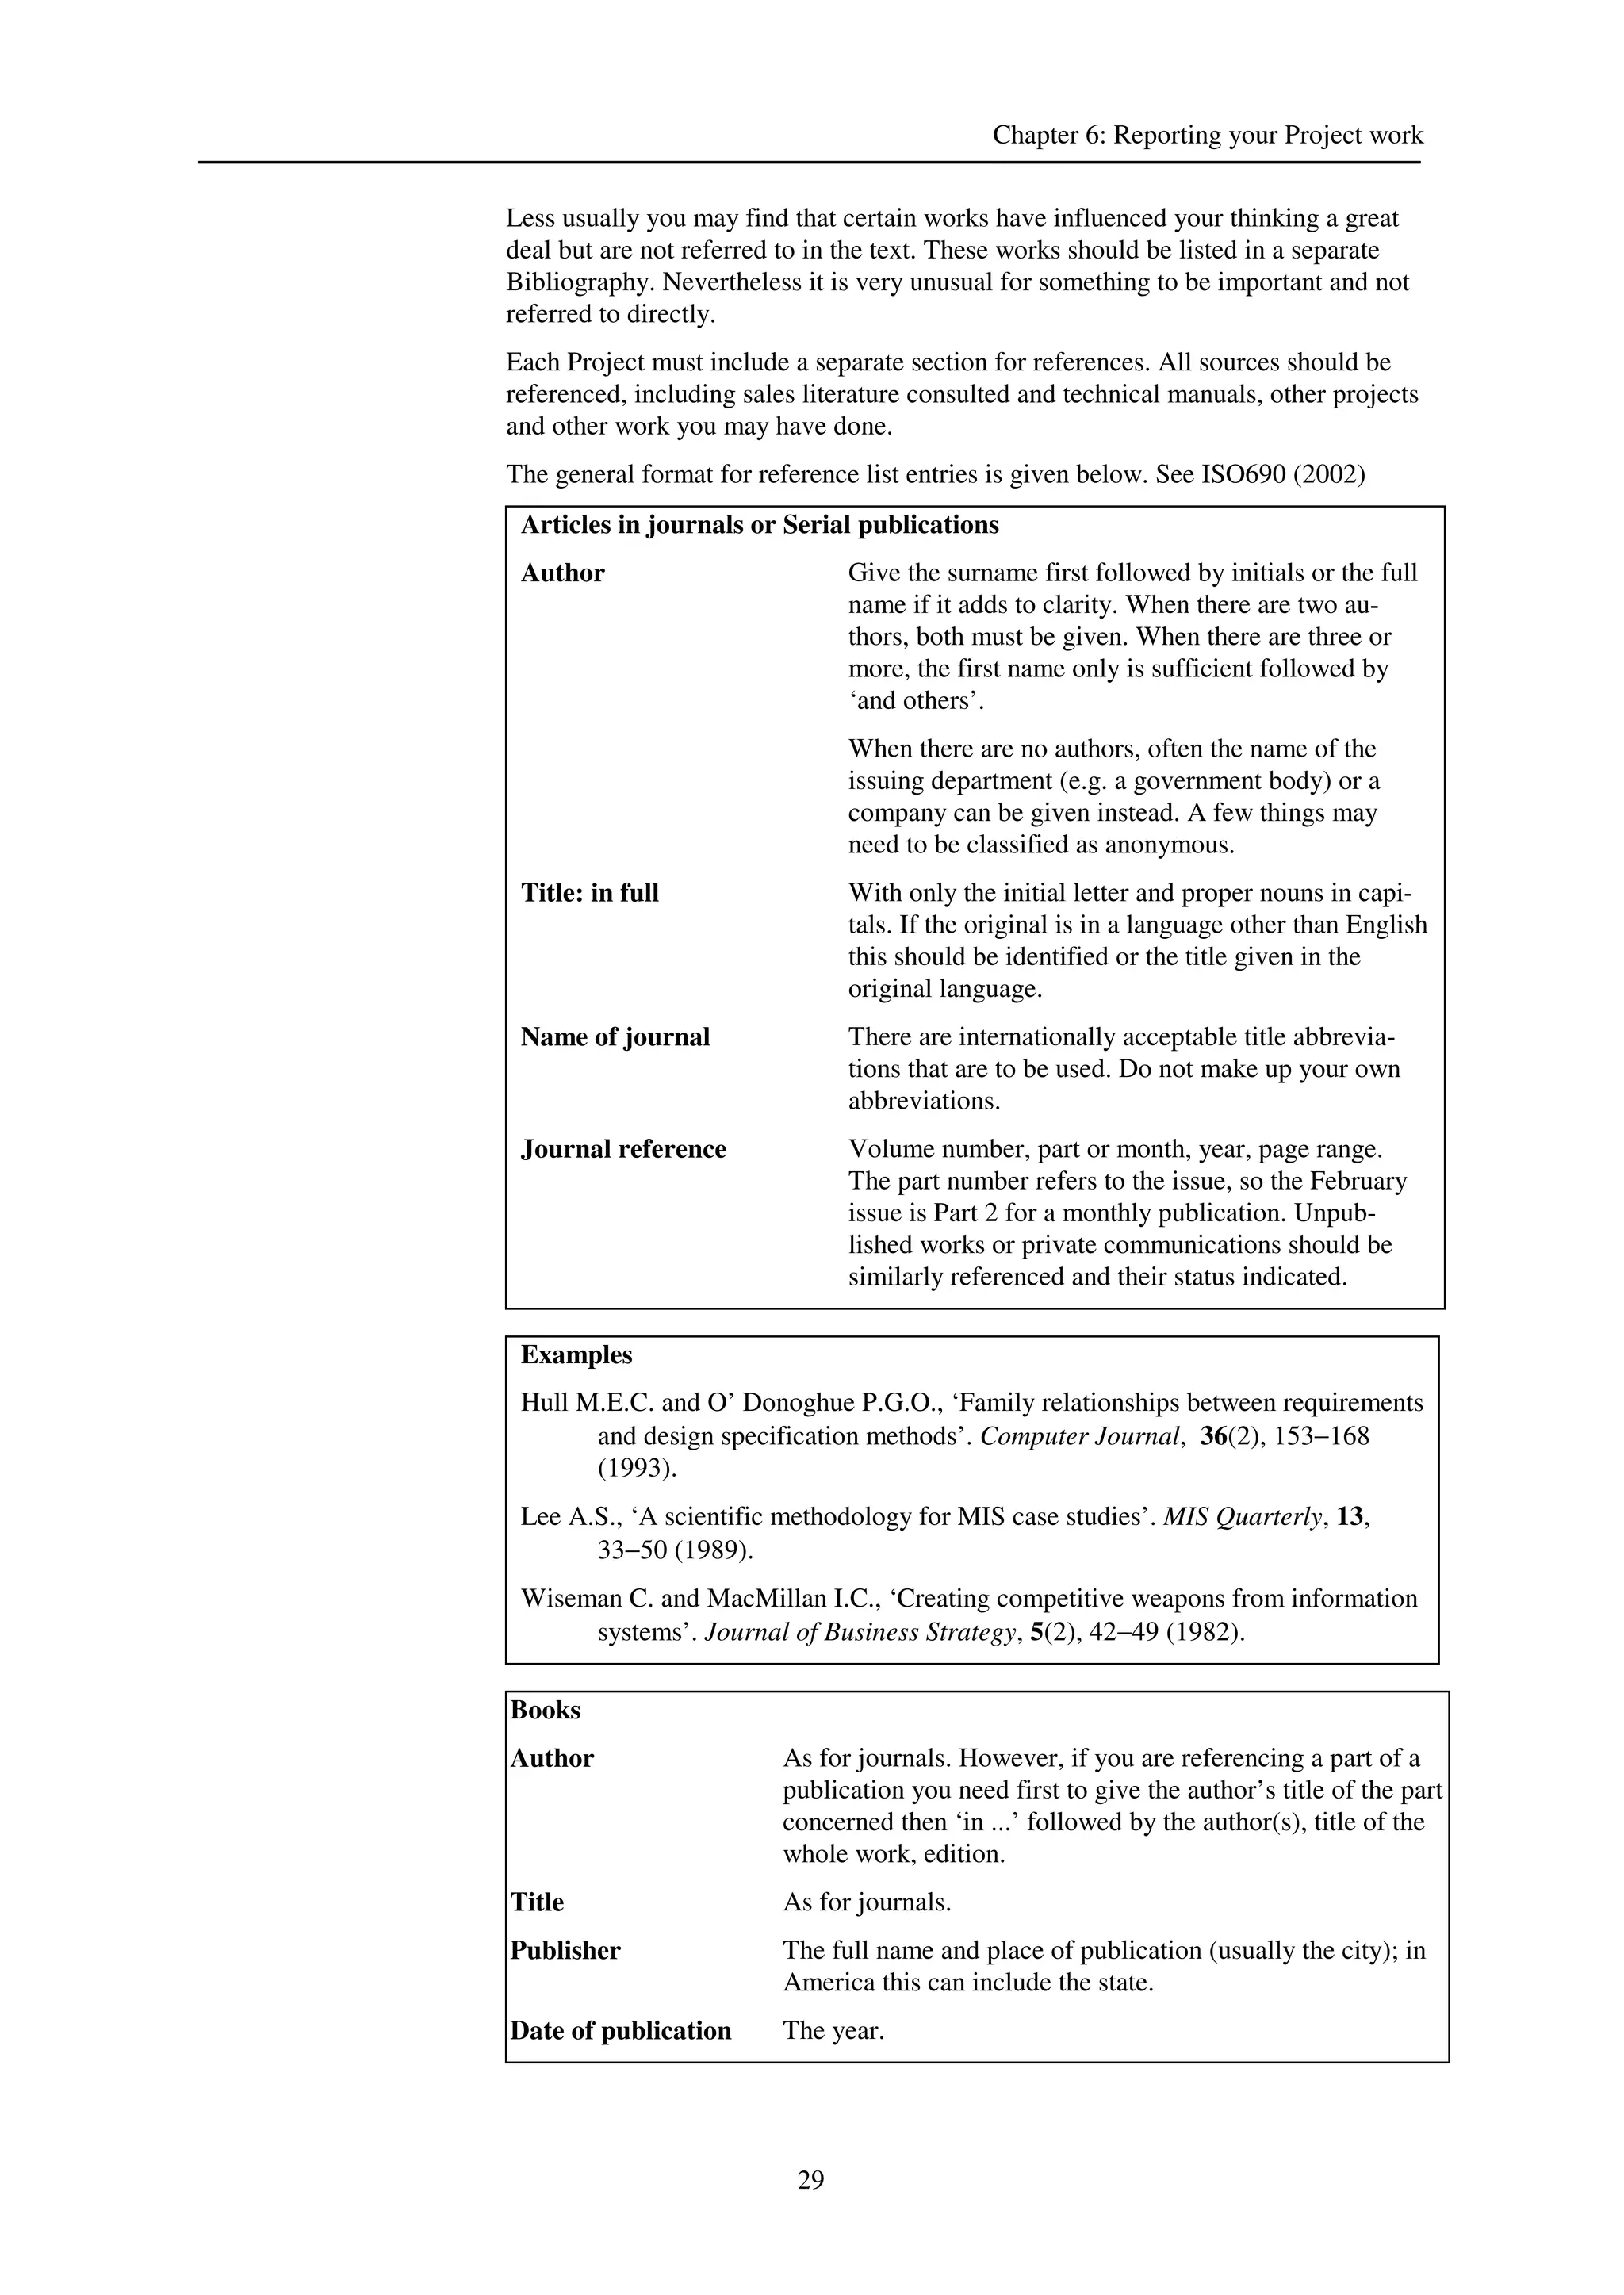
Reference list A numbered list in alphabetical order by author of those items
referred to (by their reference number) in the text. This list will
generally be much shorter than that for the (later and much larger)
Project Report.
6.2. Format of the Project Report
The Project Report is the main deliverable for your Project work. Any other deliver-
ables, such as source software, executables or media results in electronic form (disc,
flash memory, etc) that form part of your submission must be included with the
printed Project report. All Project Reports should adhere to this structure:
Title page Giving the title, student name, date, supervisor name, address,
University of London student registration number.
Contents page Giving the section structure and page numbers.
Summary A one page summary of your work that helps people to decide
whether to read it and gives an outline of important features
for those who do not.
Terms of ref-
erence
Stating what questions you set out to answer, the deliverables
you were going to submit, and the justification for the work
you have done.
Methods The methods chosen, their justification and the outcome.
[How you did it]
Will include some or all of the literature survey and analysis
that informs and justifies the choice of approach to answering
your question or solving your stated problem.
Results Your findings, analyses, results of calculations and experi-
ments. If your Project is of the kind based on analysis of the
literature, and possibly other sources, this analysis will pro-
vide results. However this form of Project is difficult to do
well except with great length and depth of experience.
Discussion What your results mean and how they can be interpreted point-
ing out strengths and weaknesses of the results.
Conclusion Where the problem is now, what you have done and what
should be done next.
Appendices Detailed technical material is often best presented in an Ap-
pendix so the main report can be read without a break. Appen-
dices should be cross-referenced from the main text as rele-
vant. No Appendix should be present unless cross-referenced
from the main text.
• Include a copy of your Project Description Form as an ap-
pendix.
• Include any permission letters that give provenance for a
work-based Project, or for access to specific organisations
or materials.
Bibliography A numbered list in alphabetical order by author of those items
referred to (by their reference number) in the text.
Evaluation A personal statement, not part of the report, about the effec-
tiveness of your work, and its usefulness to yourself and oth-
ers.
3. 320 Project
26
Note the following in more detail:
a. TITLE PAGE. The title page must follow the layout below.
• title
• author
• date
• supervisor (if none, state ‘None’).
And contain the following text:
‘Submitted as part of the requirements for the award of the De-
gree in <your degree name> of the University of London.’
<your degree name> is the programme for which you are registered,
namely one of -
- Computing and Information Systems
- Creative Computing
- Computing with Law
b. CONTENTS. All reports must have a contents page that indexes all
sections and appendices in the report with both their section reference
and physical page number. [So the pages must be numbered through-
out].
c. SUMMARY. This can also be denoted as an ABSTRACT. All re-
ports must have, as the first section, a project summary or abstract.
This is not an introduction. It extracts the key findings from your
work, usually concentrating on the important results you have
achieved. The summary or abstract is the last thing to write. Only
when everything is finished do you know what has to be summarised.
d. OBJECTIVES. All reports must include a precise statement of objec-
tives. Often there is a high level statement of purpose, followed by a
detailed specification of the deliverable(s) you will produce to
achieve the purpose(s).
The original purpose for doing the work needs to be included in the
objectives, as does any deviation from the pre-specified objectives
within the final report.
e. METHODS. All reports must include the methods used, and discus-
sion of how each technique was used, for what purpose and with what
effect. Vague statements such as ‘I went to the library’ or ‘I used on-
line information sources’ are totally inadequate. Everything you do
should be documented so that someone can repeat your work.
Examples
If interviews have been conducted they must be accompanied by in-
terview reports (as Appendices) and you should make clear the pur-
pose of the interview, how it was planned and structured. There
would normally be a document analysing any set of interviews, which
would indicate the issues raised and where or to whom they related.
This analysis would be another Appendix.
Library and on line searches should be documented by defining your
objectives precisely (what you were looking for), the strategy (what
you searched or intended to search), your findings (what you found,
what you did not find, where you searched in vain), and conclusions
about the state of the topic from the results of the search. This is cov-
ered in more detail in Chapter 3.
4. Chapter 6: Reporting your Project work
27
Design and analysis techniques applied to situations where there are
decisions to be made as to the approach taken, or relating the final
outcome, should be reported as such.
In many cases you will want to describe the alternative outcomes,
explaining how they are different and the reasons for choosing one in
preference to the other. In some cases the choices, because they have
to be worked through and evaluated, will be the major work of the
Project.
Where you need to apply specialist techniques you should investigate
the subject in your library as well as seeking expert guidance, ini-
tially, from your supervisor (if you have one).
Examples where unforeseen problems often occur are in the use of
statistics, in benchmarking and other performance tests and in survey
methodology.
f. RESULTS. All Projects produce results. Examples of results include
lists, tables, other reports, and formal experimental results. These
results must be clearly identified and presented as such. All results
obtained should refer clearly to the methods used to obtain them. If
the results are less reliable or useful than you expected, the shortcom-
ings must be clearly stated.
g. DISCUSSION. Discussion of your results and conclusions drawn
from them must be clearly identified in separate sections from the re-
sults.
h. CONCLUSION. In the conclusion you draw together all the points
made earlier, both looking back to the objectives set at the outset and
what has actually been achieved; as well as looking to the future by
specifying the work that could be done next.
i. TECHNICAL DETAIL. As technical material is frequently dry and
extensive it is best moved out of the main body and treated as a refer-
ence source by citing it where necessary in the main body of the re-
port. The main body should read easily from beginning to end.
An outside reader is not always interested in academic aspects such as
the choice of methodology, the difficulties encountered, etc. The Ex-
aminers are interested in such matters and they must be described.
j. APPENDICES. Appendices must be placed after the main body of
the report but before the Bibliography. Appendices need citations as
well as the main body of the report. The report itself must cross-
reference the appendices where necessary. Every Appendix has a
clearly-defined purpose and must be cross-referenced somewhere.
k. DOCUMENTATION STANDARDS. The correct documentation for
any formal analysis and/or design methods used during your Project
must be adhered to in the final report. Consult your supervisor, if you
have one, about documentation and quality standards. For example,
for software read Dawson (2000:137−140).
In many cases you will be using established standards and will cite
the source of these standards in your report. Any variation from the
standards will need to be defined, justified and its implications dis-
cussed. Take special care to ensure that you do this work accurately.
5. 320 Project
28
l. REFERENCES. This section must be a list of references consulted
with full attribution and the text must contain full cross-referencing.
Note: all Appendices require citations where necessary. This refer-
ence list when done well is an important deliverable of the Project. It
should contain only items that are cited in the text and each citation
must have a corresponding entry in the reference list. Citations with-
out a reference list entry and uncited reference list items constitute a
grave defect.
m. EVALUATION. The report must finish with an evaluation. This is
your assessment of the quality of your own work. It is not an opportu-
nity for self-justification or the place to make excuses or to make your
conclusions.
Explain how well your objectives have been achieved, what you
would now do differently, where things worked well and where they
did not, and what you have learned on the way. This section comes
after the Bibliography.
n. COPYRIGHT. Copyrighted material must not be included without
the written permission of the copyright holder.
Do not include sales literature, newspaper articles or downloaded
web documents.
Cite all sources including ephemeral items (such as sales literature) in
the same way as any other.
o. Always remember that you are presenting your own work and your
own ideas. Do not copy work from any other source (whether pub-
lished conventionally or electronically). Paraphrasing is treated as
copying − just changing the words does not make a big difference.
p. Lastly, as general principles:
Try to put yourself in the place of the reader − in this case of an in-
formed reader, who is well-informed in your professional field.
Do not write a textbook. There are plenty of these around already.
Do not waste the reader’s time on general introductory materials.
Give the citations only. The reader does not need an introduction but
may need to refer to sources in the subject.
Do make sure that you carefully define the technical terms used again
giving relevant citations. A fold-out Glossary is sometimes useful.
6.3. Citing your references
The purpose of referencing your work is to enable the reader to trace the sources
that have influenced your ideas and work, both for fuller detail and for more detailed
comparison.
All items referred to in your research must be included in a reference list and no
items in the reference list must be referred to (see 6.1.l above). Dawson
(2000:130−137) has a useful discussion of alternative styles for listing and citation,
and on the avoidance of plagiarism. The essential point here is that you must use a
standard style and use it consistently. One approach is that this list should be in al-
phabetical order of author and numbered. For this reason although reference infor-
mation must be collected from the outset of any Project it is the last thing to finish.
The converse is applicable. Something included in the Bibliography must be refer-
enced from the text.
6. Chapter 6: Reporting your Project work
29
Less usually you may find that certain works have influenced your thinking a great
deal but are not referred to in the text. These works should be listed in a separate
Bibliography. Nevertheless it is very unusual for something to be important and not
referred to directly.
Each Project must include a separate section for references. All sources should be
referenced, including sales literature consulted and technical manuals, other projects
and other work you may have done.
The general format for reference list entries is given below. See ISO690 (2002)
Articles in journals or Serial publications
Author Give the surname first followed by initials or the full
name if it adds to clarity. When there are two au-
thors, both must be given. When there are three or
more, the first name only is sufficient followed by
‘and others’.
When there are no authors, often the name of the
issuing department (e.g. a government body) or a
company can be given instead. A few things may
need to be classified as anonymous.
Title: in full With only the initial letter and proper nouns in capi-
tals. If the original is in a language other than English
this should be identified or the title given in the
original language.
Name of journal There are internationally acceptable title abbrevia-
tions that are to be used. Do not make up your own
abbreviations.
Journal reference Volume number, part or month, year, page range.
The part number refers to the issue, so the February
issue is Part 2 for a monthly publication. Unpub-
lished works or private communications should be
similarly referenced and their status indicated.
Examples
Hull M.E.C. and O’ Donoghue P.G.O., ‘Family relationships between requirements
and design specification methods’. Computer Journal, 36(2), 153−168
(1993).
Lee A.S., ‘A scientific methodology for MIS case studies’. MIS Quarterly, 13,
33−50 (1989).
Wiseman C. and MacMillan I.C., ‘Creating competitive weapons from information
systems’. Journal of Business Strategy, 5(2), 42−49 (1982).
Books
Author As for journals. However, if you are referencing a part of a
publication you need first to give the author’s title of the part
concerned then ‘in ...’ followed by the author(s), title of the
whole work, edition.
Title As for journals.
Publisher The full name and place of publication (usually the city); in
America this can include the state.
Date of publication The year.
7. 320 Project
30
Location The page range: the page or pages that are specifically ref-
erenced.
Note: different references to the same publication will gen-
erally require separate entries in the Bibliography.
Examples
Honeywell: COBOL reference manual, DD25, D8 D9, (Honeywell Information
Systems: New York, 1975).
Microsoft, Excel: Function Reference (AB26298-0392), 464, (Microsoft Corpora-
tion: Washington, 1992).
Naughton M., Wisdom C., Hall N.: Viewdata − The Business Applications, 91−93,
(Communications Educational Services: London, 1986).
Electronic sources
Referencing these is covered by the standard ISO 690-2 (2002). Some examples are
given below but if you have emerging issues check the following web site:
http://www.collectionscanada.gc.ca/electroniccollection/003008-400-e.html
This has examples covering a range of source types.
Author As for journals (normally present).
Title As for journals (if present), as at top of text.
Date of publication The date given in the web page.
URL The full URL (the uniform resource locator − the web ad-
dress).
Date of citation Date when item seen, in square brackets.
Examples
Beckleheimer, Jeff, ‘How do you cite URL’s in a bibliography?’ 26 August 1994
URL:http://www.nrlssc.navy.mil/meta/bibliography/html
[cited 21/12/2004]
Arnzen, Michael A., ‘Cyber citation: documenting internet sources presents some
thorny problems’, Internet world September 1996; 7(9):72−74
URL: http://www.internetworld.com/1996/09/cybercitations.html
[cited 21/12/2004]
6.4. Referencing (citing) the reference list
There are several possible standards for referencing or citing the reference list. The
important point is to be consistent, as if you vary or mix standards it will make iden-
tification of references more difficult for the reader, will adversely affect your pres-
entation (and marks for it) and make it harder for the Examiners to view your report
as a consistent, coherent source.
Two possible standards are Harvard (used here) and Vancouver (see Dawson (2000:
131−134). In Harvard, the author name(s) and publication year are used as identifi-
cation. In Vancouver, when you refer to an item insert the reference number (the se-
rial number of the alphabetical bibliography listing) in brackets, in the main text.
If you need to refer to two sections of the same publication in the same report you
need not repeat all the details in the reference list, just those details that are differ-
ent, usually the page reference but possibly the volume number.
8. Chapter 6: Reporting your Project work
31
Remember you do not repeat previously published information merely to repeat
background material − the citation is sufficient. Short quotations of text are permit-
ted in quotation marks if correctly cited. Do not copy figures, diagrams or tables
without permission.
If you find you are summarising or paraphrasing other work you are heading for
failure. Cut out this material and include the relevant citation only. Where you wish
to make a comparison between alternative views or to make a critical judgement
then you need to explain your sources. The distinction is that in the second case it is
your views you are presenting, not just discussing and justifying those of someone
else.
You will also find helpful the distinction between external references or citations,
which are to previously published work, and internal references (that is, cross-
references, see Section 6.5 below), which are to other parts of your work.
6.5. Referencing other parts of your report −−−−
cross-referencing
The term ‘cross-reference’ is defined as ‘a reference within a text to another part of
the text’ (Collins English Dictionary, 1994). The term was mentioned above in Sec-
tion 6.3. Stating that the term was mentioned in Section 6.4 is a cross-reference to
that section, while the citation of the definition of the term includes a reference (to a
text outside this guide). The statement ‘Collins English Dictionary is listed in the
References section of this guide’ is a cross-reference.
When you produce your report you will find that you are the expert in the detail of
your work. To communicate successfully you often need to reference other parts of
your report. Use the section numbers in the report to direct the reader and to rein-
force connections in your work. Typical uses are:
• to direct the reader to further detail in Appendices
• to connect objectives, methods and results
• to direct the reader in discussion to the source of an issue where the material is in
the results or Appendices
• in addition, to make a report more concise by avoiding repetition of material al-
ready given elsewhere.
Think of these references as signposts. Use them to tell the reader where you are go-
ing, to remind the reader where you have been and to indicate interesting areas of
detail not being fully considered in your text.
Correct use of cross-referencing helps to make a report more cogent and coherent.
Poor cross-referencing contributes to poor readability and poor presentation of ma-
terial and, regrettably, is a common fault in undergraduate Project reports.
6.6. Quoting, summarising, avoiding plagiarism
An area where many students are uncertain is in how to lay out quotations and how
to avoid apparent plagiarism. As a simple example, reference is made to material in
Section 1.2. of this guide.
You might write:
‘There are many ways to think of what a project is for. One is as follows:
The project provides experience in both the standards required for an academic
piece of work and in carrying out original work.
Another notion of its purpose is....’
This is plagiarism as you have not distinguished your own text from the text you
have copied and you have not referenced the copied text.
9. 320 Project
32
On the other hand, you could write:-
‘There are many ways to think of what a project is for. One is given in Brownrigg
(2009: 3).
“The project provides experience in both the standards required
for an academic piece of work and in carrying out original work.”
Another notion of its purpose is ... ’
{and in your references, e.g.}
Brownrigg, D.R.K. ‘Project Guide for Students’,
University of London, 2009.
Now you have identified the exact text you are quoting and its source. This is good
practice.
Another area to be careful of is paraphrasing. If it is really relevant to paraphrase
(rather than quoting or giving a reference) you might write:
‘...
There are many ways to think of what a project is for. Brownrigg (2009) writes
of the provision of experience in work of academic standard and of originality
as being important.
This is only the view of Brownrigg. The issue of depth of background reading is
also significant.
...’
This is sound practice.
One common fault is not to show where the paraphrase ends. For instance, if the sen-
tence: ‘This is only the view of Brownrigg’ is omitted, then the reader has no clue as
to where your ideas start and you may get no credit for them.
Also, a serious issue arises if the example above is replaced by a paraphrase without
attribution, as in:
‘...
There are many ways to think of what a project is for including the provision of
experience in standards needed for an academic work and in executing original
work as both being important.
The issue of depth of background reading is also important.
...’
Now plagiarism becomes an issue as a close paraphrase has been given without ac-
knowledging the source.
For additional advice, see Dawson (2000: 131−134).
10. Chapter 6: Reporting your Project work
33
6.7. Faults in reports
This section records some of the problems often found in reports − the points have
been mentioned before so this is a partial checklist.
Symptom Cure
Deliverables by
magic
On opening a report the
immediate impression is
of a large volume of
code or analysis/design
documentation with no
idea of its source.
Explain the methods by which
the work was produced; ex-
plain design decisions; in-
clude a road map to guide the
reader.
Deliverables of un-
known origin
The work seems to be
of good quality but
seems too extensive to
have been done as a
Project.
If work existed before the
start of the Project define
what existed, its status and
who was responsible for its
production.
Deliverables of un-
known quality
The work appears
sound but there is no
evidence of its validity.
Include test results (summa-
rised), relevant reports of
meetings, walkthroughs, in-
spections and workshops,
with a commentary on their
relevance.
Blind assertions of
fact
The assertion of facts,
often as a list (e.g. the
critical success factors
are…).
Everything in your report has
either an external source or is
a result of your work. Either
way make the source clear.
Only repeat an external
source list if you intend to
discuss every point.
Unsourced complex
diagrams
A diagram is supplied
without a source.
Give the source. If you have
adapted several sources make
clear the contribution of each.