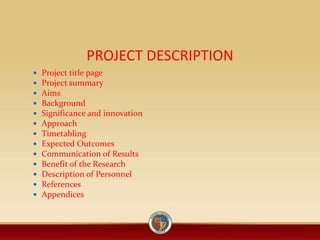
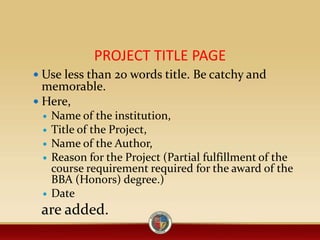
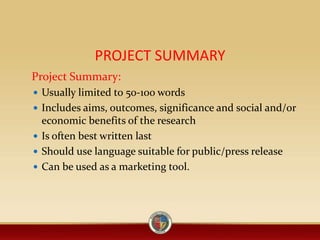
In Pursuit of Quality Education
Prof. Dr. Muhammad Khalid Pervaiz
Dean, Faculty of Management and Social Sciences
Rector,
Hajvery University
PROJECT DESCRIPTION
 Project title page
 Project summary
 Aims
 Background
 Significance and innovation
 Approach
 Timetabling
 Expected Outcomes
 Communication of Results
 Benefit of the Research
 Description of Personnel
 References
 Appendices
PROJECT TITLE PAGE
 Use less than 20 words title. Be catchy and
memorable.
 Here,
 Name of the institution,
 Title of the Project,
 Name of the Author,
 Reason for the Project (Partial fulfillment of the
course requirement required for the award of the
BBA (Honors) degree.)
 Date
are added.
PROJECT SUMMARY
Project Summary:
 Usually limited to 50-100 words
 Includes aims, outcomes, significance and social and/or
economic benefits of the research
 Is often best written last
 Should use language suitable for public/press release
 Can be used as a marketing tool.
AIMS
Consider the following:
 What is the field of study?
 What is the objective of the research?
 Keep aims clear and concise
 Think about the nature of the research – basic, strategic,
applied or experimental
 Ask is it genuinely feasible? Does it replicate work done
elsewhere?
BACKGROUND
 Let the reader know the context of the research issues
 Use subheadings to identify themes and/or other issues
 How do people achieve that objective now?
 Are there any current unresolved issues in your field? Why are they
unresolved or unsatisfactory? How do you think you will overcome
the problem/issue?
 Bring out your knowledge of the field and literature. Let readers
know you have the expertise. You are not only selling the idea, but
also the researcher and/or member of a research team
 Include information about recent international progress in the field
of the research, and the relationship of this proposal to work in the
field generally
 Define your key terms and cite key international and easily
accessible references wherever possible
SIGNIFICANCE AND INNOVATION
Describe and detail the significance of the research and whether
the research addresses an important problem. Ask yourself the
following:
 why undertake the research?
 will I strengthen basic knowledge?
 will I provide the answer to an important practical or significant
problem?
 does my project have particular resonance for the future e.g. global
environmental issues?
 how will the anticipated outcomes advance the knowledge base of
the discipline?
 what is novel and innovative about the approach I am using?
 what new methodologies or technologies will be developed?
APPROACH
 Describe the conceptual framework
 Describe the design and methods to be used
 Explain how these are appropriate and how they
integrate with the aims of the project
 Provide step-by-step detail
 How will you collect your data and what will you do with
it i.e. what framework will perform your analysis?
 Convince the reader you understand/have experience in
undertaking qualitative/quantitative research
TIME TABLING
This is a measure of the project's
feasibility and your chance to let readers
know who is doing what. You should:
 Link phases of the research plan/approach
with the anticipated timeline
 List any milestones – draft reports etc.
 Build in any ethics clearances required.
EXPECTED OUTCOMES
Describe the expected outcomes and likely impact of
the proposed research. You should:
 Link to the aims – what will the anticipated results be of
what you plan to do?
 Be realistic as you will be judged on these outcomes
 Check the University's Intellectual Property Policy.
COMMUNICATION OF RESULTS
Outline plans for communicating the research results by thinking of
both the users and benefits of the this research. Consideration should
be given to each of the following:
 If communication of results will be undertaken formally through
journal / magazine / newspaper articles or conference
presentations, try to be specific and name the journal / magazine /
newspaper and conference.
 If communication of results will be undertaken informally, name
the interest groups, types of reports, websites, etc. you will
use/target
 Media strategies
 The results obtained in the research are presented here. Visual aids
like graphs, charts and the likes should be used as well. The results
should be discussed then compared with results of past authors.
The effects and applications of the results should be detailed as
well.
BENEFITS OF RESEARCH
Describe how the research project might result in
economic and/or social benefits. Consider the
following questions:
 Why are you doing the research?
 What are the expected benefits for the specific industry
and/or industry sector? List separately.
 What are the expected benefits for the community more
broadly
DESCRIPTION OF PERSONNEL
Summarize the role, responsibilities and contributions
of each investigator.
 Who brings what expertise? Which part of the project
are they driving if relevant?
 You should also summarize the roles and levels of
involvement of other participants e.g. technical staff,
students, research assistants and/or research associates.
REFERENCES
 Include a list of all references. Usually these also must be
within the page limit.
 Cite only the key international, substantive and easily
accessible references wherever possible.
 Avoid using a footnote system, use endnotes instead.
 This is a list of all the relevant journals, books and all sources
of information consulted in the research work, either online
or print.
 Plagiarism should be avoided at all costs, all quoted and exact
words of different sources should be properly referenced, in-
text and at the references' list/bibliography. MLA, APA,
Havard and Chicago style are the commonest referencing
styles.
APPENDICES
This is for all extra materials that were not added to
the body of the work. This includes extensive proofs,
official data from case study, etc.
After writing, the researcher should painstakingly
proofread the whole content for grammatical and
spelling errors. This could be very distracting while
reading the material.
The page numbers are easily distorted by changing
font size and type, spacing et al. The final submission
should be very clear, error-free(to a large degree) and
as required by standard.
TEXT
 It includes:
 Introduction
 Background or Literature Review
 Methods, Timeline and Research Design
 Collaboration with Faculty Sponsor
 Report of Previous Research Experience
 References Cited
INTRODUCTION
Provide a statement of the objective(s) and the anticipated
significance of the work to your field of study. What problems
will be investigated? What hypothesis will be tested? We suggest
that the introduction begins with a brief description of the
project in general terms before the more technical aspects of the
project are discussed. Clearly identify what contributions this
project makes to the fields of Business Administration. This
describes the background, scope and purpose of the research.
The rest of the report should be tied to the information supplied.
The researcher should strive to present sufficient details
regarding why the study was carried out. It shouldn't be rushed,
a gradual build-up of the content from bottom to top is ideal. It
should be closed with a linking paragraph that would disclose
the objectives, constraints and limitations.
BACKGROUND OR LITERATURE REVIEW
Provide a brief review of the work that has been done in the
project area together with complete references in appropriate
professional style. This section should also include any personal
information about you that would indicate to the reviewers your
qualifications for successfully completing this project, including
a statement of how the project will contribute to your academic
and career goals. This presents basically, the work done by
others. It is on the ground work done by others that the current
research is to be based, hence the review. It sums up the pros and
cons of all past work but due credit should be given to the
various authors. The use of quotations should be less in use,
more of paraphrasing (reading and making out meaning in your
own words), making comments in the review is great as well, it
just depends on the context.
METHODS , TIMELINE AND RESEARCH
DESIGN
Methods: Provide a detailed description of the research
methods that you will use in the project. This should include a
justification for the specific approach that you will use. For
example, how do the methods answer the questions that have
been posed, test the hypothesis, or lead to the desired goal?
Timeline: Provide dates for the initiation and completion of
each phase of the project. Attempt to lay out a reasonable
schedule taking into consideration all phases of the research and
final deliverables.
Research Design: Here the language used should be in past
tense. It is a sum-up of the research design, procedures, the area
and population of study. The data sampling and data sources are
detailed as well. The method used, from all alternatives, should
also be justified. The materials and equipment used is also
included.
COLLABORATION WITH FACULTY SPONSOR
Provide a description of the way you and your
faculty sponsor will collaborate on the project. The
faculty sponsor should play a significant role in
responding to your ideas, providing advice for new
directions and resources, discussing the
implications of the results, and helping you
prepare for your public presentation. Will there be
regularly scheduled meetings between you and
your sponsor? Explain how the project relates to
the ongoing work of your sponsor, if this is the
case.
REPORT ON PREVIOUS RESEARCH
EXPERIANCE
Report on Previous Research Experience
(please save and upload this as a separate
document): If you have done any previous
research as an undergraduate you must
include a 1-2 page (double-spaced)
summary of your research results or
creative products. Please note-if you have
received funding your proposal will not
be considered unless you complete this
section.
REFERENCES CITED
Include a list of references that you have cited in the
project. Nearly all good projects cite papers report
related results, describe the methods to be used or
provide background information. Please note-the
review panel rarely accept projects without adequate
references.
IMPORTANT CONCEPTS-I
 Business Research
 Applied and Basic Research
 Ethics in Business Research
 Hallmarks of Scientific Research
 Hypothetico-Deductive Method
 Data Sources
 Statement of Hypothesis
 Directional Hypotheses
 Non-Directional Hypotheses
 Scales
 Rating Scales
 Reliability and Validity
 Primary and Secondary Data
IMPORTANT CONCEPTS-II
 Sampling
 Determining the Sample Size
 Probability Sampling
 Non-Probability Sampling
 Efficiency in Sampling
 Measures of Central Tendency and Dispersion
 Statistical Techniques
 Research Areas I,II,III & IV
BUSINESS RESEARCH
Business research can be described as a systematic and organized effort
to investigate a specific problem encountered in the work setting,
which needs a solution. It comprises a series of steps that are designed
and executed with the goal of finding answers to the issues that are of
concern to the manager in the work environment. This means that the
first step in research is to know where the problem areas exist in the
organization, and to identify as clearly and specifically as possible the
problems that need to be studied and resolved. Once a problem that
needs attention is clearly defined, steps can be taken to gather
information, analyze the data, and determine the factors that are
associated with the problem and then solve it by taking the necessary
corrective measures. We can now define business research as an
organized, systematic, data-based, critical, objective, scientific inquiry
or investigation into a specific problem
APPLIED AND BASIC RESEARCH
Research can be undertaken for two different
purposes. One is to solve a current problem faced by
the manager in the work setting, demanding a timely
solution. For example, a particular product may not be
selling well and the manager might want to find the
reasons for this in order to take corrective action. Such
research is called Applied Research. The other is to
generate a body of knowledge by trying to
comprehend how certain problems that occur in
organizations can be solved. This is called Basic
Research
ETHICS IN BUSINESS RESEARCH
Ethics in business research refers to a code of conduct or
expected societal norm of behavior while conducting research.
Ethical conduct applies to the organization and the members
that sponsor the research, the researchers who undertake the
research, and the respondents who provide them with the
necessary data. The observance of ethics begins with the person
instituting the research, who should do so in good faith, pay
attention to what the results indicate, and, surrendering the ego,
pursue organizational rather than self-interests. Ethical conduct
should also be reflected in the behavior of the researchers who
conduct the investigation, the participants who provide the data,
the analysts who provide the results, and the entire research
team that presents the interpretation of the results and suggests
alternative solutions.
HALLMARKS OF SCIENTIFIC RESEARCH
The hallmarks or main distinguishing characteristics
of scientific research may be listed as follows:
Purposiveness
Rigor
Testability
Replicability
Precision and Confidence
Objectivity
Generalizability
Parsimony
HYPOTHETICO-DEDUCTIVE METHOD
The seven-step process in the hypothetico-deductive
method:
 Identify a broad problem area
 Define the problem statement
 Develop hypotheses
 Determine measures
 Data collection
 Data analysis
 Interpretation of data
DATA SOURCES
 Text Books
 Journals
 Theses
 Conference Proceedings
 Unpublished Manuscripts
 Reports
 Newspapers
 Internet
STATEMENT OF HYPOTHESIS
A hypothesis can be defined as a testable statement of
the relationship among variables. A hypothesis can also
test whether there are differences between two groups
(or among several groups) with respect to any variable or
variables. To examine whether or not the conjectured
relationships or differences exist, these hypotheses can
be set either as propositions or in the form of if–then
statements. The two formats can be seen in the following
two examples.
 Employees who are more healthy will take sick leave less
frequently.
 If employees are more healthy, then they will take
sick leave less frequently
DIRECTIONAL HYPOTHESES
If, in stating the relationship between two variables or
comparing two groups, terms such as positive,
negative, more than, less than, and the like are used, then
these are directional hypotheses because
the direction of the relationship between the variables
(positive/negative) is indicated, as in the first
example below, or the nature of the difference between two
groups on a variable (more than/less
than) is postulated, as in the second example.
 The greater the stress experienced in the job, the lower the job
satisfaction of employees.
 Women are more motivated than men.
NON-DIRECTIONAL HYPOTHESES
On the other hand, non-directional hypotheses are those
that do postulate a relationship or difference, but offer no
indication of the direction of these relationships or differences.
In other words, though it may be conjectured that there is a
significant relationship between two variables, we may not be
able to say whether the relationship is positive or negative, as in
the first example below. Likewise, even if we can conjecture that
there will be differences between two groups on a particular
variable, we may not be able to say which group will be more and
which less on that variable, as in the second example.
 There is a relationship between age and job satisfaction.
 There is a difference between the work ethic values of American
and Asian employees.
SCALES
Scale: A scale is a tool or mechanism by which individuals are distinguished as
to how they differ from one another on the variables of interest.
Nominal Scale: A nominal scale is one that allows the researcher to assign
subjects to certain categories or groups.
Ordinal Scale: An ordinal scale not only categorizes the variables in such a way
as to denote differences among the, various categories, An interval scale allows
us to perform certain arithmetical operations on the data collected from the
respondents.
Ratio Scale: The ratio scale overcomes the disadvantage of the arbitrary origin
point of the interval scale, in that it has an absolute (in contrast to an arbitrary)
zero point, which is a meaningful measurement point. Thus, the ratio scale not
only measures the magnitude of the differences between points on the scale
but also taps the proportions in the differences. It is the most powerful of the
scales because it has a unique zero origin (not an arbitrary origin) and
subsumes all the properties of the other three scales.
RATING SCALES
Dichotomous Scale: is used to elicit a Yes or No answer
Category Scale: uses multiple items to elicit a single response
Semantic Differential Scale: bipolar attributes; such as good-bad,
strong-week, hot-cold etc
Numerical Scale: The numerical scale is similar to the semantic
differential scale, with the difference that numbers on a five-point or
seven-point scale are provided A five-point or seven-point scale with
anchors, as needed, is provided for each item and the respondent states
the appropriate number on the side of each item, or circles the relevant
number against each item, as per the examples that follow. The
responses to the items are then summed. This uses an interval scale.
Likert Scale: is designed to examine how strongly subjects agree or
disagree with statements on a five-point scale. The responses over a
number of items tapping a particular concept or variable can be
analyzed item by item, but it is also possible to calculate a total or
summated score for each respondent by summing across items.
RELIABILITY AND VALIDITY
Reliability: is a test of how consistently a measuring
instrument measures whatever concept it is
measuring.
Validity: is a test of how well an instrument that is
developed measures the particular concept it is
intended to measure.
Note: Validity is concerned with whether we measure
the right concept, and reliability with stability and
consistency of measurement. Validity and reliability of
the measure attest to the scientific rigor that has gone
into the research study.
PRIMARY AND SECONDARY DATA
Data can be obtained from primary or secondary
sources.:
Primary Data: refer to information obtained
first-hand by the researcher on the variables of
interest for the specific purpose of the study.
Secondary Data: refer to information gathered
from sources that already exist
DATA COLLECTION METHODS
Interviewing: interview respondents to obtain information on the
issues of interest.
Questionnaire: is a pre-formulated written set of questions to which
respondents record their answers.
Observation: People can be observed in their natural work
environment or in a lab setting, and their activities and behaviors or
other items of interest can be noted and recorded.
SAMPLING
Population: refers to the entire group of people, events, or things of
interest that the researcher wishes to investigate. It is the group of
people, events, or things of interest for which the researcher wants to
make inferences (based on sample statistics).
Element: is a single member of the population.
Sample: is a subset of the population. It comprises some members
selected from it. In other words, some, but not all, elements of the
population form the sample.
Subject: is a single member of the sample, just as an element is a single
member of the population.
Parameters: The characteristics of the population such as μ (the
population mean), σ (the population standard deviation), and σ2 (the
population variance) are referred to as its parameters
DETERMINING THE SAMPLE SIZE
Is a sample size of 40 large enough? Or do you need a sample size of 75,
180, 384, or 500? Is a large sample better than a small sample; that is, is
it more representative? The decision about how large the sample size
should be can be a very difficult one. We can summarize the factors
affecting decisions on sample size as:
 The research objective;
 The extent of precision desired;
 The acceptable risk in predicting that level of precision;
 The amount of variability in the population itself;
 The cost and time constraints;
 In some cases, the size of the population itself.
Thus, how large your sample should be is a function of these six factors.
PROBABOLITY SAMPLING
Simple Random Sampling: every element in the population
has a known and equal chance of being selected as a
subject.
Systematic sampling: involves drawing every nth element
in the population starting with a randomly chosen element
between 1 and n.
Stratified random sampling: as its name implies, involves a
process of stratification or segregation, followed by
random selection of subjects from each stratum.
Cluster Sampling: samples gathered in groups or chunks of
elements that, ideally, are natural aggregates of elements in
the population.
NON-PROBABILITY SAMPLING
Convenience Sampling: refers to the collection of information from
members of the population who are conveniently available to provide
it.
Purposive Sampling: is confined to specific types of people who can
provide the desired information, either because they are the only ones
who have it, or conform to some criteria set by the researcher.
1. Judgment Sampling: involves the choice of subjects who are most
advantageously placed or in the best position to provide the
information required
2. Quota Sampling: ensures that certain groups are adequately
represented in the study through the assignment of a quota.
EFFICIENCY IN SAMPLING
Efficiency in Sampling: is attained when, for a given level of precision
(standard error), the sample size could be reduced, or for a given
sample size (n), the level of precision could be increased.
MEASURES OF CENTRAL TENDENCY AND
DISPERSION
Measures of Central Tendency:
 Mean
 Median
 Mode
Measures of Dispersion:
 Range
 Standard Deviation
 Variance
 Coefficient of Variation
STATISTICAL TECHNIQUES
 Correlation Analysis
 Regression Analysis
 Goodness of Fit Test
 Test of Independence
 Test of Homogeneity
 Hypothesis Test about Population Means and Proportions
 Analysis of Variance
RESEARCH AREAS-I
 Employee behaviors such as performance, absenteeism, and turnover.
 Employee attitudes such as job satisfaction, loyalty, and organizational
commitment.
 Supervisory performance, managerial leadership style, and performance
appraisal systems.
 Employee selection, recruitment, training, and retention.
 Validation of performance appraisal systems.
 Human resource management choices and organizational strategy.
 Evaluation of assessment centers.
 The dynamics of rating and rating errors in the judgment of human
performance.
 Strategy formulation and implementation.
 Just-in-time systems, continuous-improvement strategies, and
production efficiencies.
RESEARCH AREAS-II
 Updating policies and procedures in keeping with latest
government regulations and organizational changes.
 Organizational outcomes such as increased sales, market share,
profits, growth, and effectiveness.
 Consumer decision making.
 Customer relationship management.
 Consumer satisfaction, complaints, customer loyalty, and word-of-
mouth communication.
 Complaint handling.
 Delivering and performing service.
 Product life cycle, and product innovation.
 Impression management, logos, and image building.
 Product positioning, product modification, and new product
development.
RESEARCH AREAS-III
 Cost of capital, valuation of firms, dividend policies, and investment
decisions.
 Risk assessment, exchange rate fluctuations, and foreign
investment.
 Tax implications of reorganization of firms or acquisition of
companies.
 Collection of accounts receivable.
 Development of effective cost accounting procedures.
 Qualified pension plans and cafeteria-type benefits for
employees.
 Deferred compensation plans.
 Installation of effective management information systems.
 Advanced manufacturing technologies and information systems.
 Design of career paths for spouses in dual-career families.
RESEARCH AREAS-IV
 Creative management of a diverse workforce.
 Cultural differences and the dynamics of managing a multinational
firm.
 Alternative work patterns: job sharing, flexi time, flexi place, and
part-time work.
 Downsizing.
 Participative management and performance effectiveness.
 Differences in leadership positions, salaries, and leadership styles.
 Instrument development for assessing “true” gender differences.
 Installation, adaptation, and updating of computer networks and
software suitable for creating effective information systems for
organizations.
 Installation of an effective data warehouse and data mining system
for the organization.
 Keeping ahead of the competition.
THANKS

Guidelines for Writing Project

  • 1.
    In Pursuit ofQuality Education Prof. Dr. Muhammad Khalid Pervaiz Dean, Faculty of Management and Social Sciences Rector, Hajvery University
  • 2.
    PROJECT DESCRIPTION  Projecttitle page  Project summary  Aims  Background  Significance and innovation  Approach  Timetabling  Expected Outcomes  Communication of Results  Benefit of the Research  Description of Personnel  References  Appendices
  • 3.
    PROJECT TITLE PAGE Use less than 20 words title. Be catchy and memorable.  Here,  Name of the institution,  Title of the Project,  Name of the Author,  Reason for the Project (Partial fulfillment of the course requirement required for the award of the BBA (Honors) degree.)  Date are added.
  • 4.
    PROJECT SUMMARY Project Summary: Usually limited to 50-100 words  Includes aims, outcomes, significance and social and/or economic benefits of the research  Is often best written last  Should use language suitable for public/press release  Can be used as a marketing tool.
  • 5.
    AIMS Consider the following: What is the field of study?  What is the objective of the research?  Keep aims clear and concise  Think about the nature of the research – basic, strategic, applied or experimental  Ask is it genuinely feasible? Does it replicate work done elsewhere?
  • 6.
    BACKGROUND  Let thereader know the context of the research issues  Use subheadings to identify themes and/or other issues  How do people achieve that objective now?  Are there any current unresolved issues in your field? Why are they unresolved or unsatisfactory? How do you think you will overcome the problem/issue?  Bring out your knowledge of the field and literature. Let readers know you have the expertise. You are not only selling the idea, but also the researcher and/or member of a research team  Include information about recent international progress in the field of the research, and the relationship of this proposal to work in the field generally  Define your key terms and cite key international and easily accessible references wherever possible
  • 7.
    SIGNIFICANCE AND INNOVATION Describeand detail the significance of the research and whether the research addresses an important problem. Ask yourself the following:  why undertake the research?  will I strengthen basic knowledge?  will I provide the answer to an important practical or significant problem?  does my project have particular resonance for the future e.g. global environmental issues?  how will the anticipated outcomes advance the knowledge base of the discipline?  what is novel and innovative about the approach I am using?  what new methodologies or technologies will be developed?
  • 8.
    APPROACH  Describe theconceptual framework  Describe the design and methods to be used  Explain how these are appropriate and how they integrate with the aims of the project  Provide step-by-step detail  How will you collect your data and what will you do with it i.e. what framework will perform your analysis?  Convince the reader you understand/have experience in undertaking qualitative/quantitative research
  • 9.
    TIME TABLING This isa measure of the project's feasibility and your chance to let readers know who is doing what. You should:  Link phases of the research plan/approach with the anticipated timeline  List any milestones – draft reports etc.  Build in any ethics clearances required.
  • 10.
    EXPECTED OUTCOMES Describe theexpected outcomes and likely impact of the proposed research. You should:  Link to the aims – what will the anticipated results be of what you plan to do?  Be realistic as you will be judged on these outcomes  Check the University's Intellectual Property Policy.
  • 11.
    COMMUNICATION OF RESULTS Outlineplans for communicating the research results by thinking of both the users and benefits of the this research. Consideration should be given to each of the following:  If communication of results will be undertaken formally through journal / magazine / newspaper articles or conference presentations, try to be specific and name the journal / magazine / newspaper and conference.  If communication of results will be undertaken informally, name the interest groups, types of reports, websites, etc. you will use/target  Media strategies  The results obtained in the research are presented here. Visual aids like graphs, charts and the likes should be used as well. The results should be discussed then compared with results of past authors. The effects and applications of the results should be detailed as well.
  • 12.
    BENEFITS OF RESEARCH Describehow the research project might result in economic and/or social benefits. Consider the following questions:  Why are you doing the research?  What are the expected benefits for the specific industry and/or industry sector? List separately.  What are the expected benefits for the community more broadly
  • 13.
    DESCRIPTION OF PERSONNEL Summarizethe role, responsibilities and contributions of each investigator.  Who brings what expertise? Which part of the project are they driving if relevant?  You should also summarize the roles and levels of involvement of other participants e.g. technical staff, students, research assistants and/or research associates.
  • 14.
    REFERENCES  Include alist of all references. Usually these also must be within the page limit.  Cite only the key international, substantive and easily accessible references wherever possible.  Avoid using a footnote system, use endnotes instead.  This is a list of all the relevant journals, books and all sources of information consulted in the research work, either online or print.  Plagiarism should be avoided at all costs, all quoted and exact words of different sources should be properly referenced, in- text and at the references' list/bibliography. MLA, APA, Havard and Chicago style are the commonest referencing styles.
  • 15.
    APPENDICES This is forall extra materials that were not added to the body of the work. This includes extensive proofs, official data from case study, etc. After writing, the researcher should painstakingly proofread the whole content for grammatical and spelling errors. This could be very distracting while reading the material. The page numbers are easily distorted by changing font size and type, spacing et al. The final submission should be very clear, error-free(to a large degree) and as required by standard.
  • 16.
    TEXT  It includes: Introduction  Background or Literature Review  Methods, Timeline and Research Design  Collaboration with Faculty Sponsor  Report of Previous Research Experience  References Cited
  • 17.
    INTRODUCTION Provide a statementof the objective(s) and the anticipated significance of the work to your field of study. What problems will be investigated? What hypothesis will be tested? We suggest that the introduction begins with a brief description of the project in general terms before the more technical aspects of the project are discussed. Clearly identify what contributions this project makes to the fields of Business Administration. This describes the background, scope and purpose of the research. The rest of the report should be tied to the information supplied. The researcher should strive to present sufficient details regarding why the study was carried out. It shouldn't be rushed, a gradual build-up of the content from bottom to top is ideal. It should be closed with a linking paragraph that would disclose the objectives, constraints and limitations.
  • 18.
    BACKGROUND OR LITERATUREREVIEW Provide a brief review of the work that has been done in the project area together with complete references in appropriate professional style. This section should also include any personal information about you that would indicate to the reviewers your qualifications for successfully completing this project, including a statement of how the project will contribute to your academic and career goals. This presents basically, the work done by others. It is on the ground work done by others that the current research is to be based, hence the review. It sums up the pros and cons of all past work but due credit should be given to the various authors. The use of quotations should be less in use, more of paraphrasing (reading and making out meaning in your own words), making comments in the review is great as well, it just depends on the context.
  • 19.
    METHODS , TIMELINEAND RESEARCH DESIGN Methods: Provide a detailed description of the research methods that you will use in the project. This should include a justification for the specific approach that you will use. For example, how do the methods answer the questions that have been posed, test the hypothesis, or lead to the desired goal? Timeline: Provide dates for the initiation and completion of each phase of the project. Attempt to lay out a reasonable schedule taking into consideration all phases of the research and final deliverables. Research Design: Here the language used should be in past tense. It is a sum-up of the research design, procedures, the area and population of study. The data sampling and data sources are detailed as well. The method used, from all alternatives, should also be justified. The materials and equipment used is also included.
  • 20.
    COLLABORATION WITH FACULTYSPONSOR Provide a description of the way you and your faculty sponsor will collaborate on the project. The faculty sponsor should play a significant role in responding to your ideas, providing advice for new directions and resources, discussing the implications of the results, and helping you prepare for your public presentation. Will there be regularly scheduled meetings between you and your sponsor? Explain how the project relates to the ongoing work of your sponsor, if this is the case.
  • 21.
    REPORT ON PREVIOUSRESEARCH EXPERIANCE Report on Previous Research Experience (please save and upload this as a separate document): If you have done any previous research as an undergraduate you must include a 1-2 page (double-spaced) summary of your research results or creative products. Please note-if you have received funding your proposal will not be considered unless you complete this section.
  • 22.
    REFERENCES CITED Include alist of references that you have cited in the project. Nearly all good projects cite papers report related results, describe the methods to be used or provide background information. Please note-the review panel rarely accept projects without adequate references.
  • 23.
    IMPORTANT CONCEPTS-I  BusinessResearch  Applied and Basic Research  Ethics in Business Research  Hallmarks of Scientific Research  Hypothetico-Deductive Method  Data Sources  Statement of Hypothesis  Directional Hypotheses  Non-Directional Hypotheses  Scales  Rating Scales  Reliability and Validity  Primary and Secondary Data
  • 24.
    IMPORTANT CONCEPTS-II  Sampling Determining the Sample Size  Probability Sampling  Non-Probability Sampling  Efficiency in Sampling  Measures of Central Tendency and Dispersion  Statistical Techniques  Research Areas I,II,III & IV
  • 25.
    BUSINESS RESEARCH Business researchcan be described as a systematic and organized effort to investigate a specific problem encountered in the work setting, which needs a solution. It comprises a series of steps that are designed and executed with the goal of finding answers to the issues that are of concern to the manager in the work environment. This means that the first step in research is to know where the problem areas exist in the organization, and to identify as clearly and specifically as possible the problems that need to be studied and resolved. Once a problem that needs attention is clearly defined, steps can be taken to gather information, analyze the data, and determine the factors that are associated with the problem and then solve it by taking the necessary corrective measures. We can now define business research as an organized, systematic, data-based, critical, objective, scientific inquiry or investigation into a specific problem
  • 26.
    APPLIED AND BASICRESEARCH Research can be undertaken for two different purposes. One is to solve a current problem faced by the manager in the work setting, demanding a timely solution. For example, a particular product may not be selling well and the manager might want to find the reasons for this in order to take corrective action. Such research is called Applied Research. The other is to generate a body of knowledge by trying to comprehend how certain problems that occur in organizations can be solved. This is called Basic Research
  • 27.
    ETHICS IN BUSINESSRESEARCH Ethics in business research refers to a code of conduct or expected societal norm of behavior while conducting research. Ethical conduct applies to the organization and the members that sponsor the research, the researchers who undertake the research, and the respondents who provide them with the necessary data. The observance of ethics begins with the person instituting the research, who should do so in good faith, pay attention to what the results indicate, and, surrendering the ego, pursue organizational rather than self-interests. Ethical conduct should also be reflected in the behavior of the researchers who conduct the investigation, the participants who provide the data, the analysts who provide the results, and the entire research team that presents the interpretation of the results and suggests alternative solutions.
  • 28.
    HALLMARKS OF SCIENTIFICRESEARCH The hallmarks or main distinguishing characteristics of scientific research may be listed as follows: Purposiveness Rigor Testability Replicability Precision and Confidence Objectivity Generalizability Parsimony
  • 29.
    HYPOTHETICO-DEDUCTIVE METHOD The seven-stepprocess in the hypothetico-deductive method:  Identify a broad problem area  Define the problem statement  Develop hypotheses  Determine measures  Data collection  Data analysis  Interpretation of data
  • 30.
    DATA SOURCES  TextBooks  Journals  Theses  Conference Proceedings  Unpublished Manuscripts  Reports  Newspapers  Internet
  • 31.
    STATEMENT OF HYPOTHESIS Ahypothesis can be defined as a testable statement of the relationship among variables. A hypothesis can also test whether there are differences between two groups (or among several groups) with respect to any variable or variables. To examine whether or not the conjectured relationships or differences exist, these hypotheses can be set either as propositions or in the form of if–then statements. The two formats can be seen in the following two examples.  Employees who are more healthy will take sick leave less frequently.  If employees are more healthy, then they will take sick leave less frequently
  • 32.
    DIRECTIONAL HYPOTHESES If, instating the relationship between two variables or comparing two groups, terms such as positive, negative, more than, less than, and the like are used, then these are directional hypotheses because the direction of the relationship between the variables (positive/negative) is indicated, as in the first example below, or the nature of the difference between two groups on a variable (more than/less than) is postulated, as in the second example.  The greater the stress experienced in the job, the lower the job satisfaction of employees.  Women are more motivated than men.
  • 33.
    NON-DIRECTIONAL HYPOTHESES On theother hand, non-directional hypotheses are those that do postulate a relationship or difference, but offer no indication of the direction of these relationships or differences. In other words, though it may be conjectured that there is a significant relationship between two variables, we may not be able to say whether the relationship is positive or negative, as in the first example below. Likewise, even if we can conjecture that there will be differences between two groups on a particular variable, we may not be able to say which group will be more and which less on that variable, as in the second example.  There is a relationship between age and job satisfaction.  There is a difference between the work ethic values of American and Asian employees.
  • 34.
    SCALES Scale: A scaleis a tool or mechanism by which individuals are distinguished as to how they differ from one another on the variables of interest. Nominal Scale: A nominal scale is one that allows the researcher to assign subjects to certain categories or groups. Ordinal Scale: An ordinal scale not only categorizes the variables in such a way as to denote differences among the, various categories, An interval scale allows us to perform certain arithmetical operations on the data collected from the respondents. Ratio Scale: The ratio scale overcomes the disadvantage of the arbitrary origin point of the interval scale, in that it has an absolute (in contrast to an arbitrary) zero point, which is a meaningful measurement point. Thus, the ratio scale not only measures the magnitude of the differences between points on the scale but also taps the proportions in the differences. It is the most powerful of the scales because it has a unique zero origin (not an arbitrary origin) and subsumes all the properties of the other three scales.
  • 35.
    RATING SCALES Dichotomous Scale:is used to elicit a Yes or No answer Category Scale: uses multiple items to elicit a single response Semantic Differential Scale: bipolar attributes; such as good-bad, strong-week, hot-cold etc Numerical Scale: The numerical scale is similar to the semantic differential scale, with the difference that numbers on a five-point or seven-point scale are provided A five-point or seven-point scale with anchors, as needed, is provided for each item and the respondent states the appropriate number on the side of each item, or circles the relevant number against each item, as per the examples that follow. The responses to the items are then summed. This uses an interval scale. Likert Scale: is designed to examine how strongly subjects agree or disagree with statements on a five-point scale. The responses over a number of items tapping a particular concept or variable can be analyzed item by item, but it is also possible to calculate a total or summated score for each respondent by summing across items.
  • 36.
    RELIABILITY AND VALIDITY Reliability:is a test of how consistently a measuring instrument measures whatever concept it is measuring. Validity: is a test of how well an instrument that is developed measures the particular concept it is intended to measure. Note: Validity is concerned with whether we measure the right concept, and reliability with stability and consistency of measurement. Validity and reliability of the measure attest to the scientific rigor that has gone into the research study.
  • 37.
    PRIMARY AND SECONDARYDATA Data can be obtained from primary or secondary sources.: Primary Data: refer to information obtained first-hand by the researcher on the variables of interest for the specific purpose of the study. Secondary Data: refer to information gathered from sources that already exist
  • 38.
    DATA COLLECTION METHODS Interviewing:interview respondents to obtain information on the issues of interest. Questionnaire: is a pre-formulated written set of questions to which respondents record their answers. Observation: People can be observed in their natural work environment or in a lab setting, and their activities and behaviors or other items of interest can be noted and recorded.
  • 39.
    SAMPLING Population: refers tothe entire group of people, events, or things of interest that the researcher wishes to investigate. It is the group of people, events, or things of interest for which the researcher wants to make inferences (based on sample statistics). Element: is a single member of the population. Sample: is a subset of the population. It comprises some members selected from it. In other words, some, but not all, elements of the population form the sample. Subject: is a single member of the sample, just as an element is a single member of the population. Parameters: The characteristics of the population such as μ (the population mean), σ (the population standard deviation), and σ2 (the population variance) are referred to as its parameters
  • 40.
    DETERMINING THE SAMPLESIZE Is a sample size of 40 large enough? Or do you need a sample size of 75, 180, 384, or 500? Is a large sample better than a small sample; that is, is it more representative? The decision about how large the sample size should be can be a very difficult one. We can summarize the factors affecting decisions on sample size as:  The research objective;  The extent of precision desired;  The acceptable risk in predicting that level of precision;  The amount of variability in the population itself;  The cost and time constraints;  In some cases, the size of the population itself. Thus, how large your sample should be is a function of these six factors.
  • 41.
    PROBABOLITY SAMPLING Simple RandomSampling: every element in the population has a known and equal chance of being selected as a subject. Systematic sampling: involves drawing every nth element in the population starting with a randomly chosen element between 1 and n. Stratified random sampling: as its name implies, involves a process of stratification or segregation, followed by random selection of subjects from each stratum. Cluster Sampling: samples gathered in groups or chunks of elements that, ideally, are natural aggregates of elements in the population.
  • 42.
    NON-PROBABILITY SAMPLING Convenience Sampling:refers to the collection of information from members of the population who are conveniently available to provide it. Purposive Sampling: is confined to specific types of people who can provide the desired information, either because they are the only ones who have it, or conform to some criteria set by the researcher. 1. Judgment Sampling: involves the choice of subjects who are most advantageously placed or in the best position to provide the information required 2. Quota Sampling: ensures that certain groups are adequately represented in the study through the assignment of a quota.
  • 43.
    EFFICIENCY IN SAMPLING Efficiencyin Sampling: is attained when, for a given level of precision (standard error), the sample size could be reduced, or for a given sample size (n), the level of precision could be increased.
  • 44.
    MEASURES OF CENTRALTENDENCY AND DISPERSION Measures of Central Tendency:  Mean  Median  Mode Measures of Dispersion:  Range  Standard Deviation  Variance  Coefficient of Variation
  • 45.
    STATISTICAL TECHNIQUES  CorrelationAnalysis  Regression Analysis  Goodness of Fit Test  Test of Independence  Test of Homogeneity  Hypothesis Test about Population Means and Proportions  Analysis of Variance
  • 46.
    RESEARCH AREAS-I  Employeebehaviors such as performance, absenteeism, and turnover.  Employee attitudes such as job satisfaction, loyalty, and organizational commitment.  Supervisory performance, managerial leadership style, and performance appraisal systems.  Employee selection, recruitment, training, and retention.  Validation of performance appraisal systems.  Human resource management choices and organizational strategy.  Evaluation of assessment centers.  The dynamics of rating and rating errors in the judgment of human performance.  Strategy formulation and implementation.  Just-in-time systems, continuous-improvement strategies, and production efficiencies.
  • 47.
    RESEARCH AREAS-II  Updatingpolicies and procedures in keeping with latest government regulations and organizational changes.  Organizational outcomes such as increased sales, market share, profits, growth, and effectiveness.  Consumer decision making.  Customer relationship management.  Consumer satisfaction, complaints, customer loyalty, and word-of- mouth communication.  Complaint handling.  Delivering and performing service.  Product life cycle, and product innovation.  Impression management, logos, and image building.  Product positioning, product modification, and new product development.
  • 48.
    RESEARCH AREAS-III  Costof capital, valuation of firms, dividend policies, and investment decisions.  Risk assessment, exchange rate fluctuations, and foreign investment.  Tax implications of reorganization of firms or acquisition of companies.  Collection of accounts receivable.  Development of effective cost accounting procedures.  Qualified pension plans and cafeteria-type benefits for employees.  Deferred compensation plans.  Installation of effective management information systems.  Advanced manufacturing technologies and information systems.  Design of career paths for spouses in dual-career families.
  • 49.
    RESEARCH AREAS-IV  Creativemanagement of a diverse workforce.  Cultural differences and the dynamics of managing a multinational firm.  Alternative work patterns: job sharing, flexi time, flexi place, and part-time work.  Downsizing.  Participative management and performance effectiveness.  Differences in leadership positions, salaries, and leadership styles.  Instrument development for assessing “true” gender differences.  Installation, adaptation, and updating of computer networks and software suitable for creating effective information systems for organizations.  Installation of an effective data warehouse and data mining system for the organization.  Keeping ahead of the competition.
  • 50.