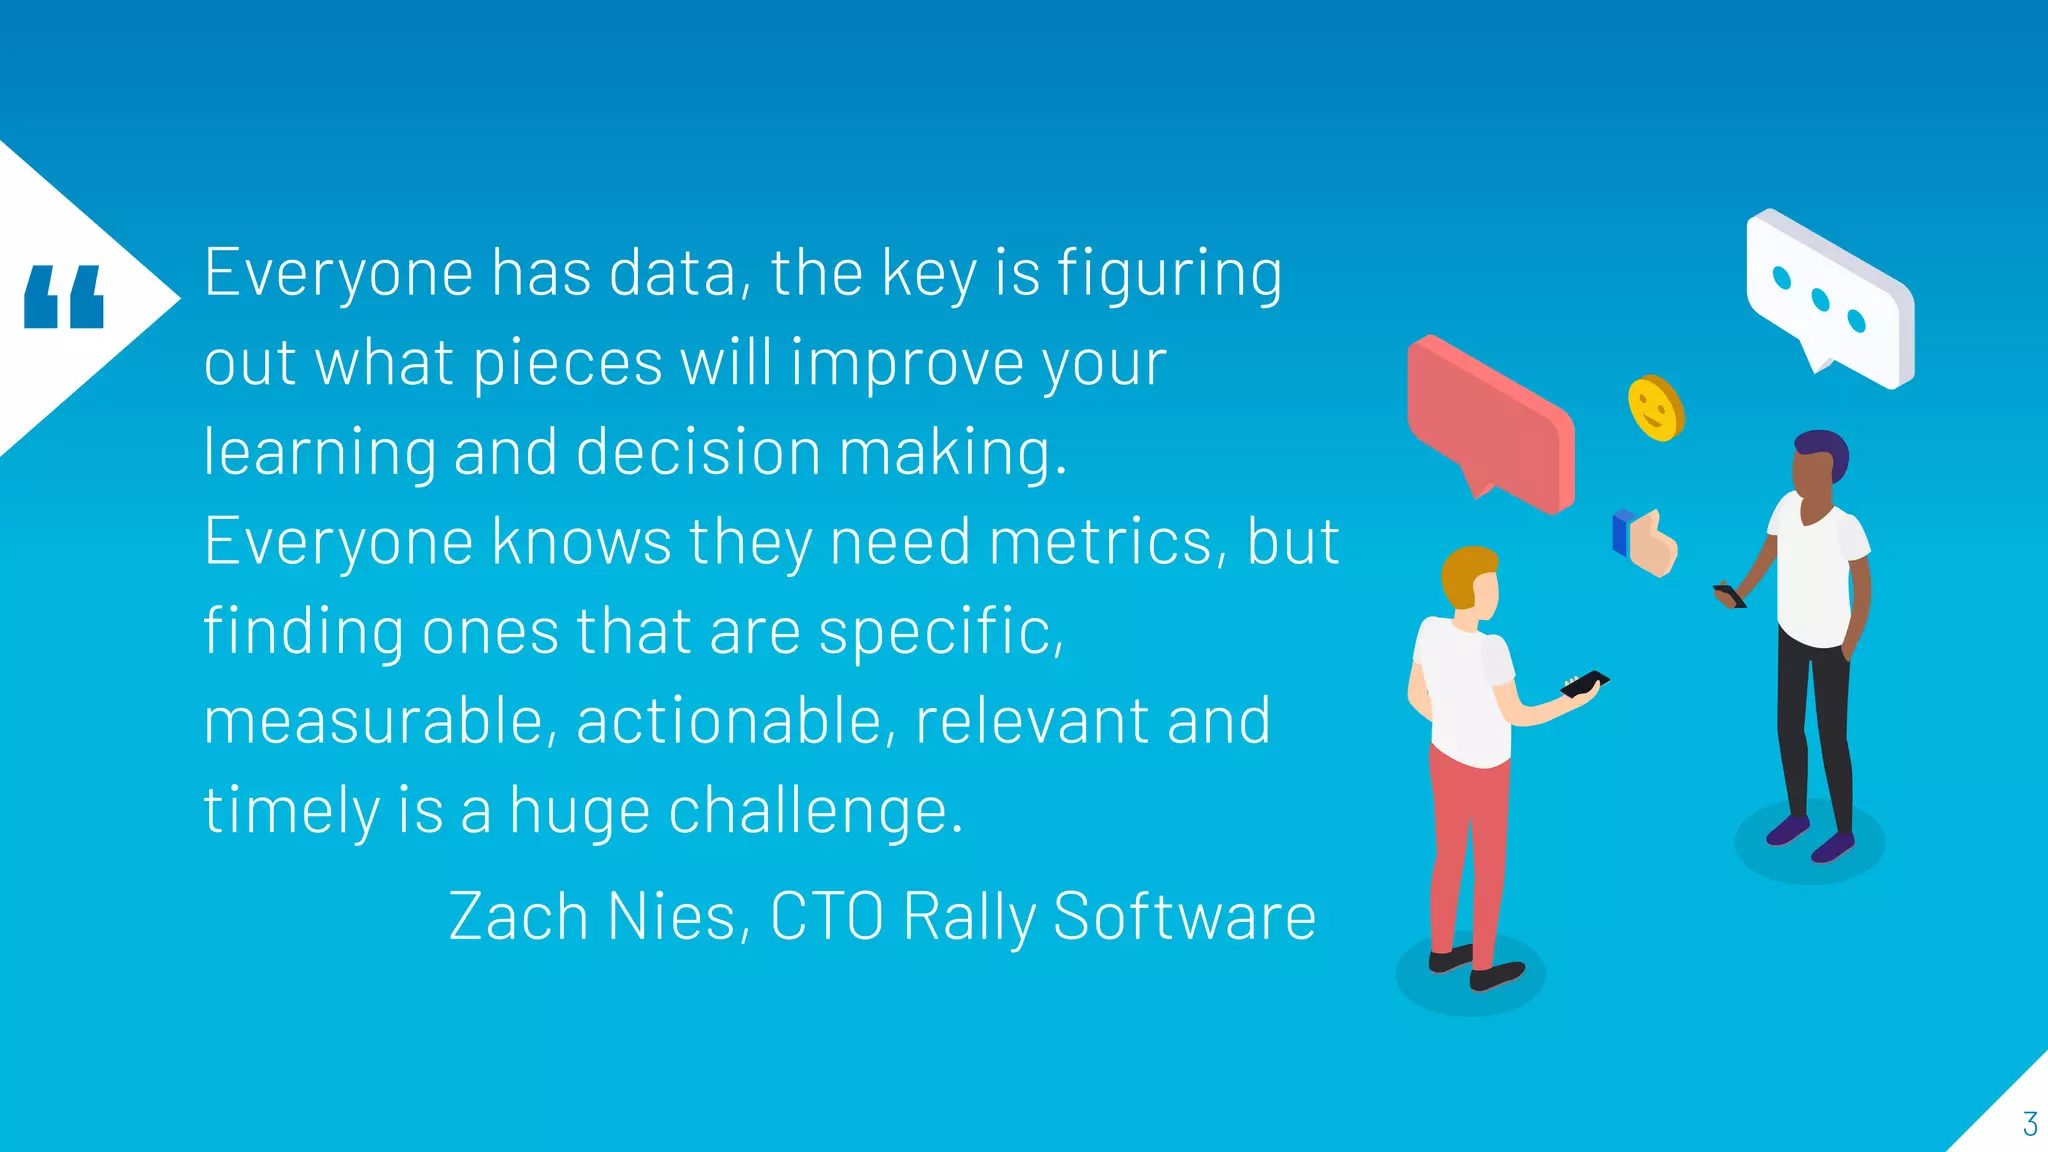
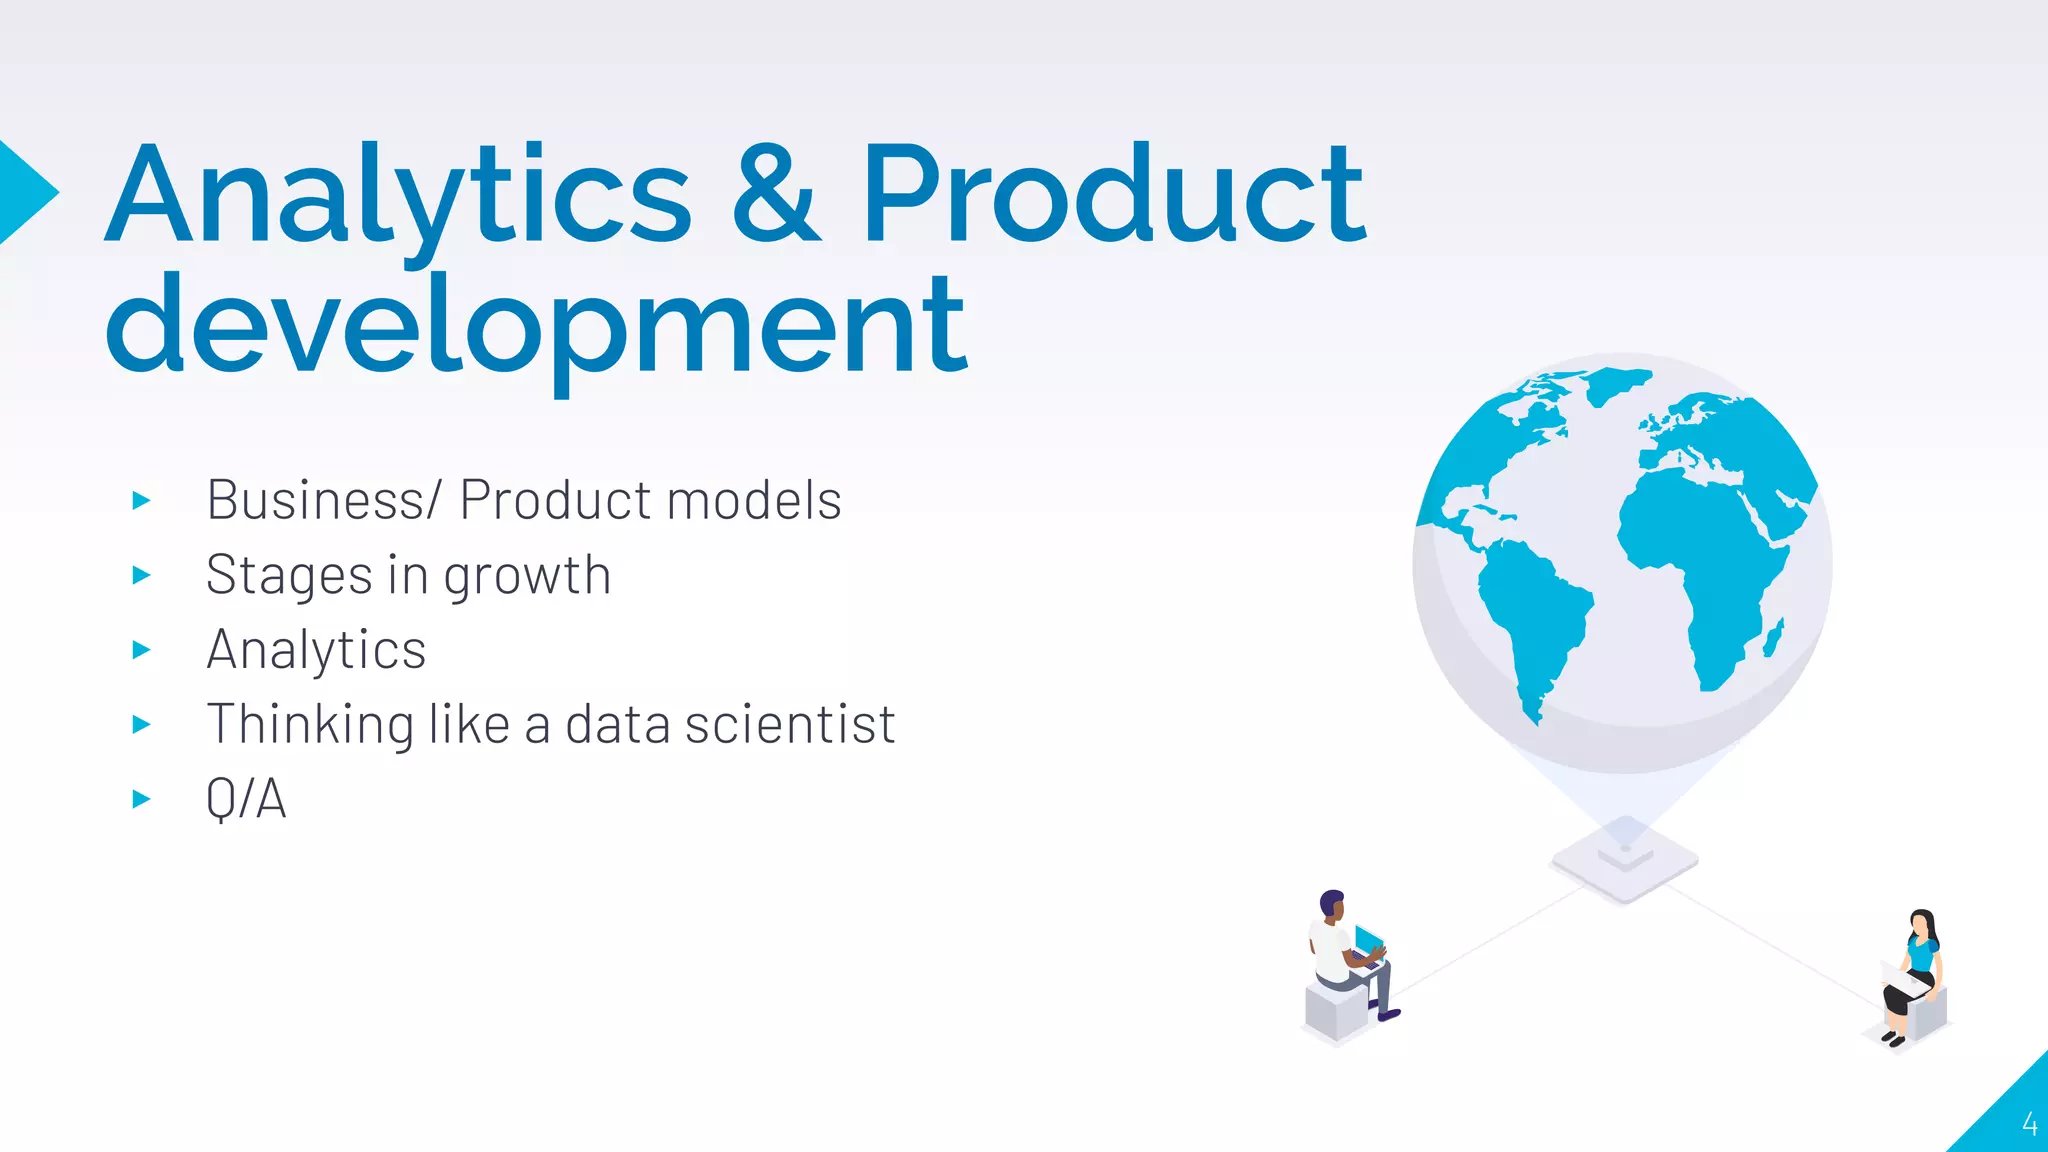
This document discusses using analytics in the product development lifecycle. It covers:
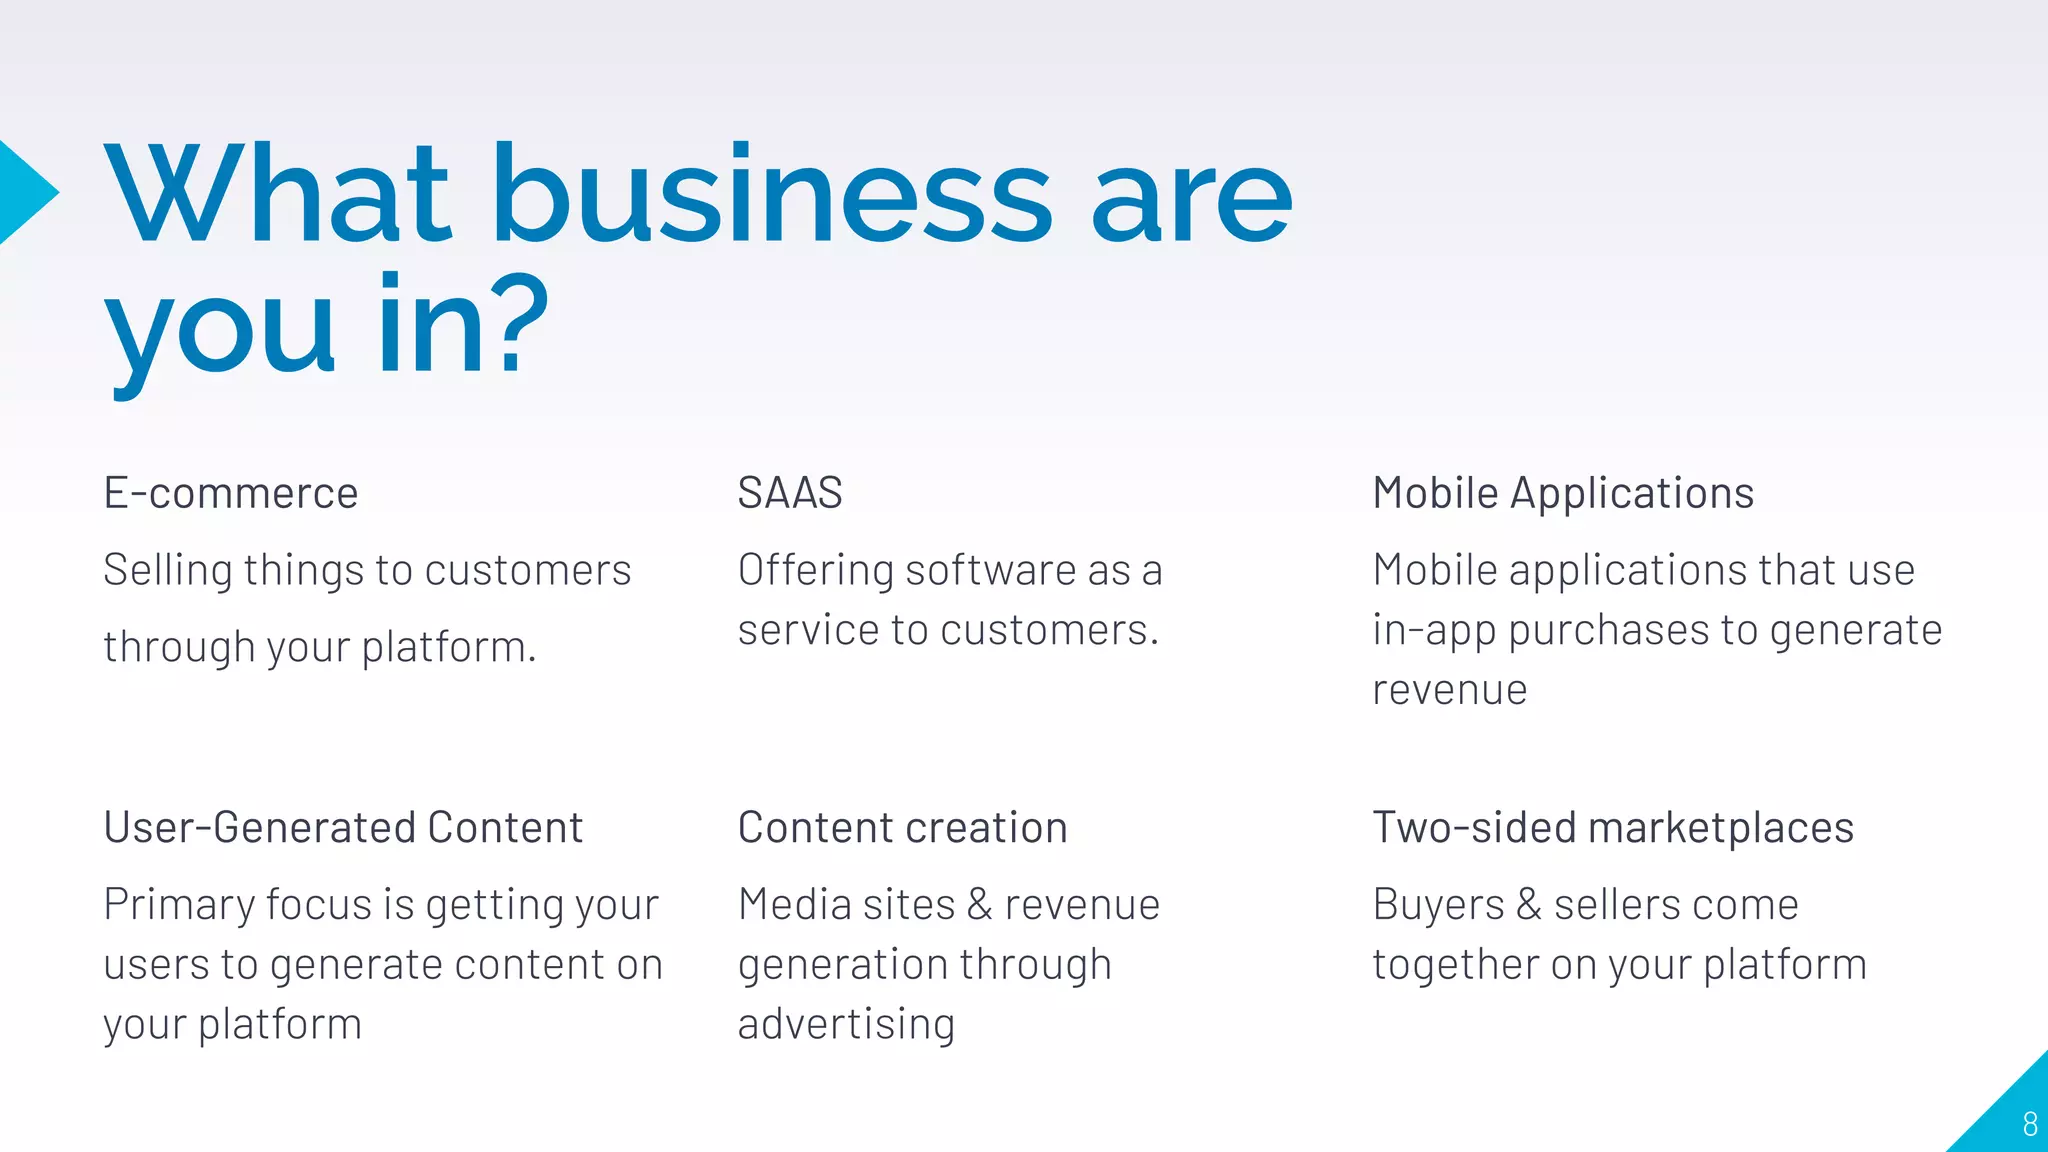
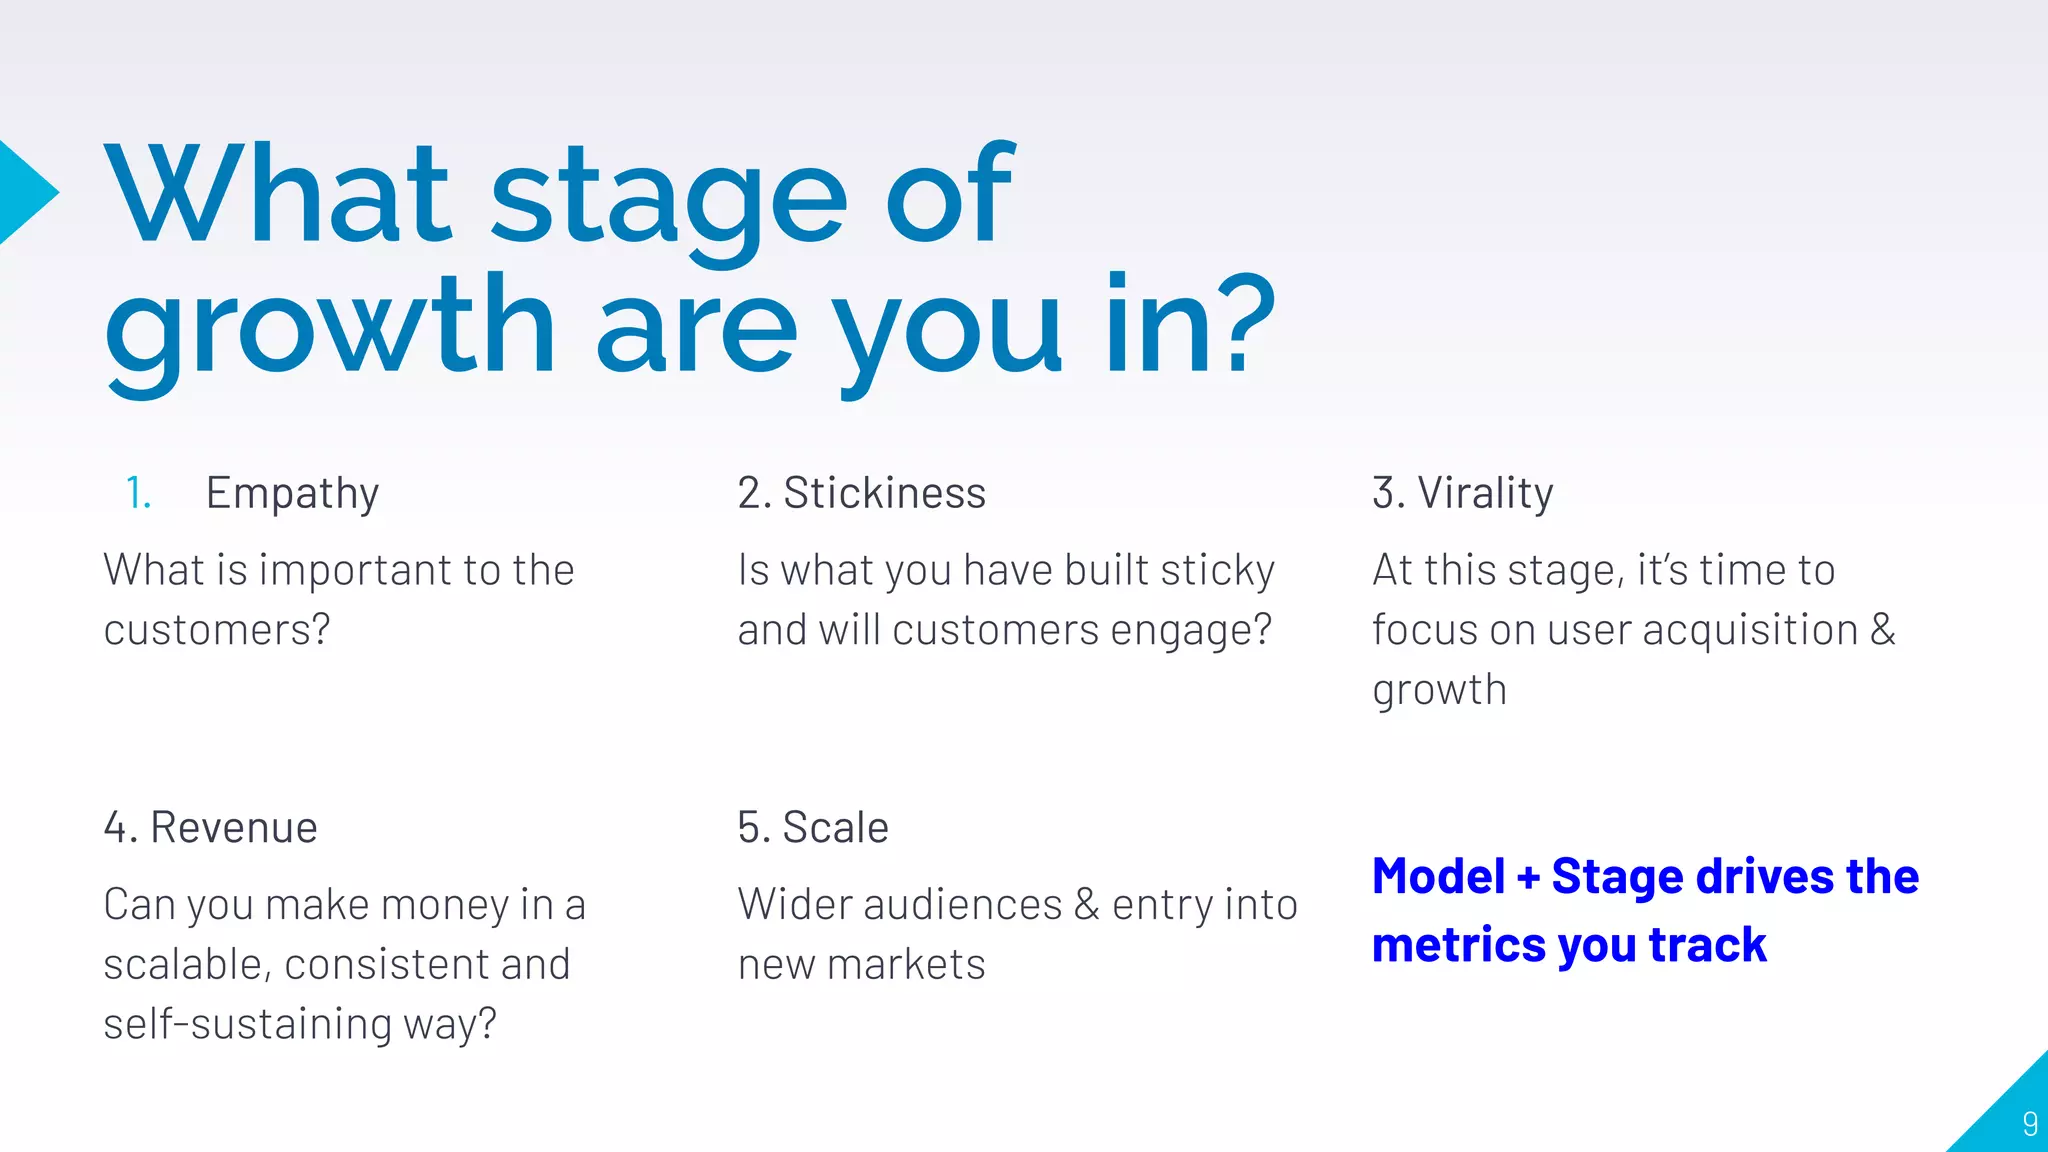
1. Different business models and stages of growth that determine the appropriate metrics to track, such as empathy, stickiness, virality, revenue, and scale.
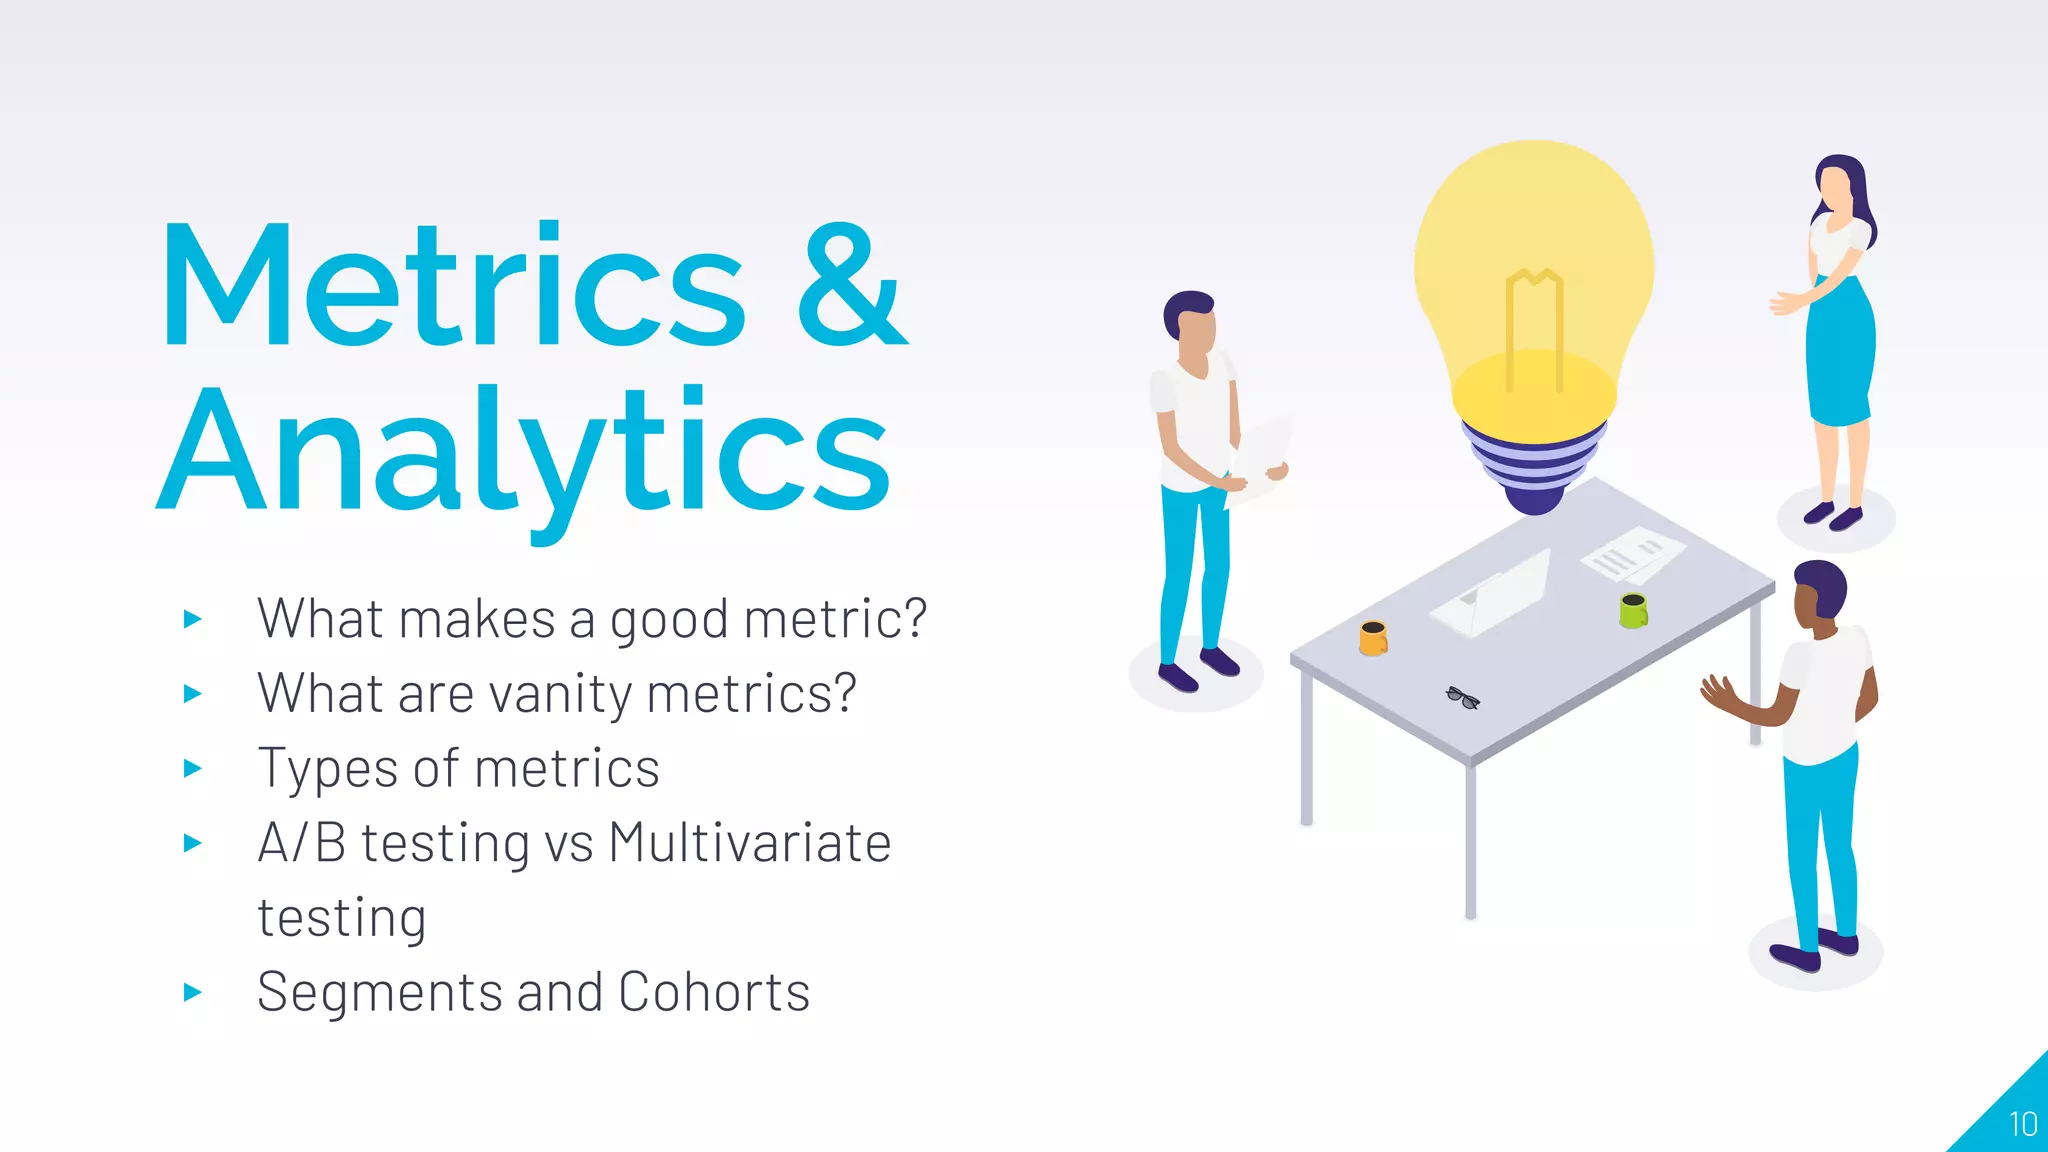
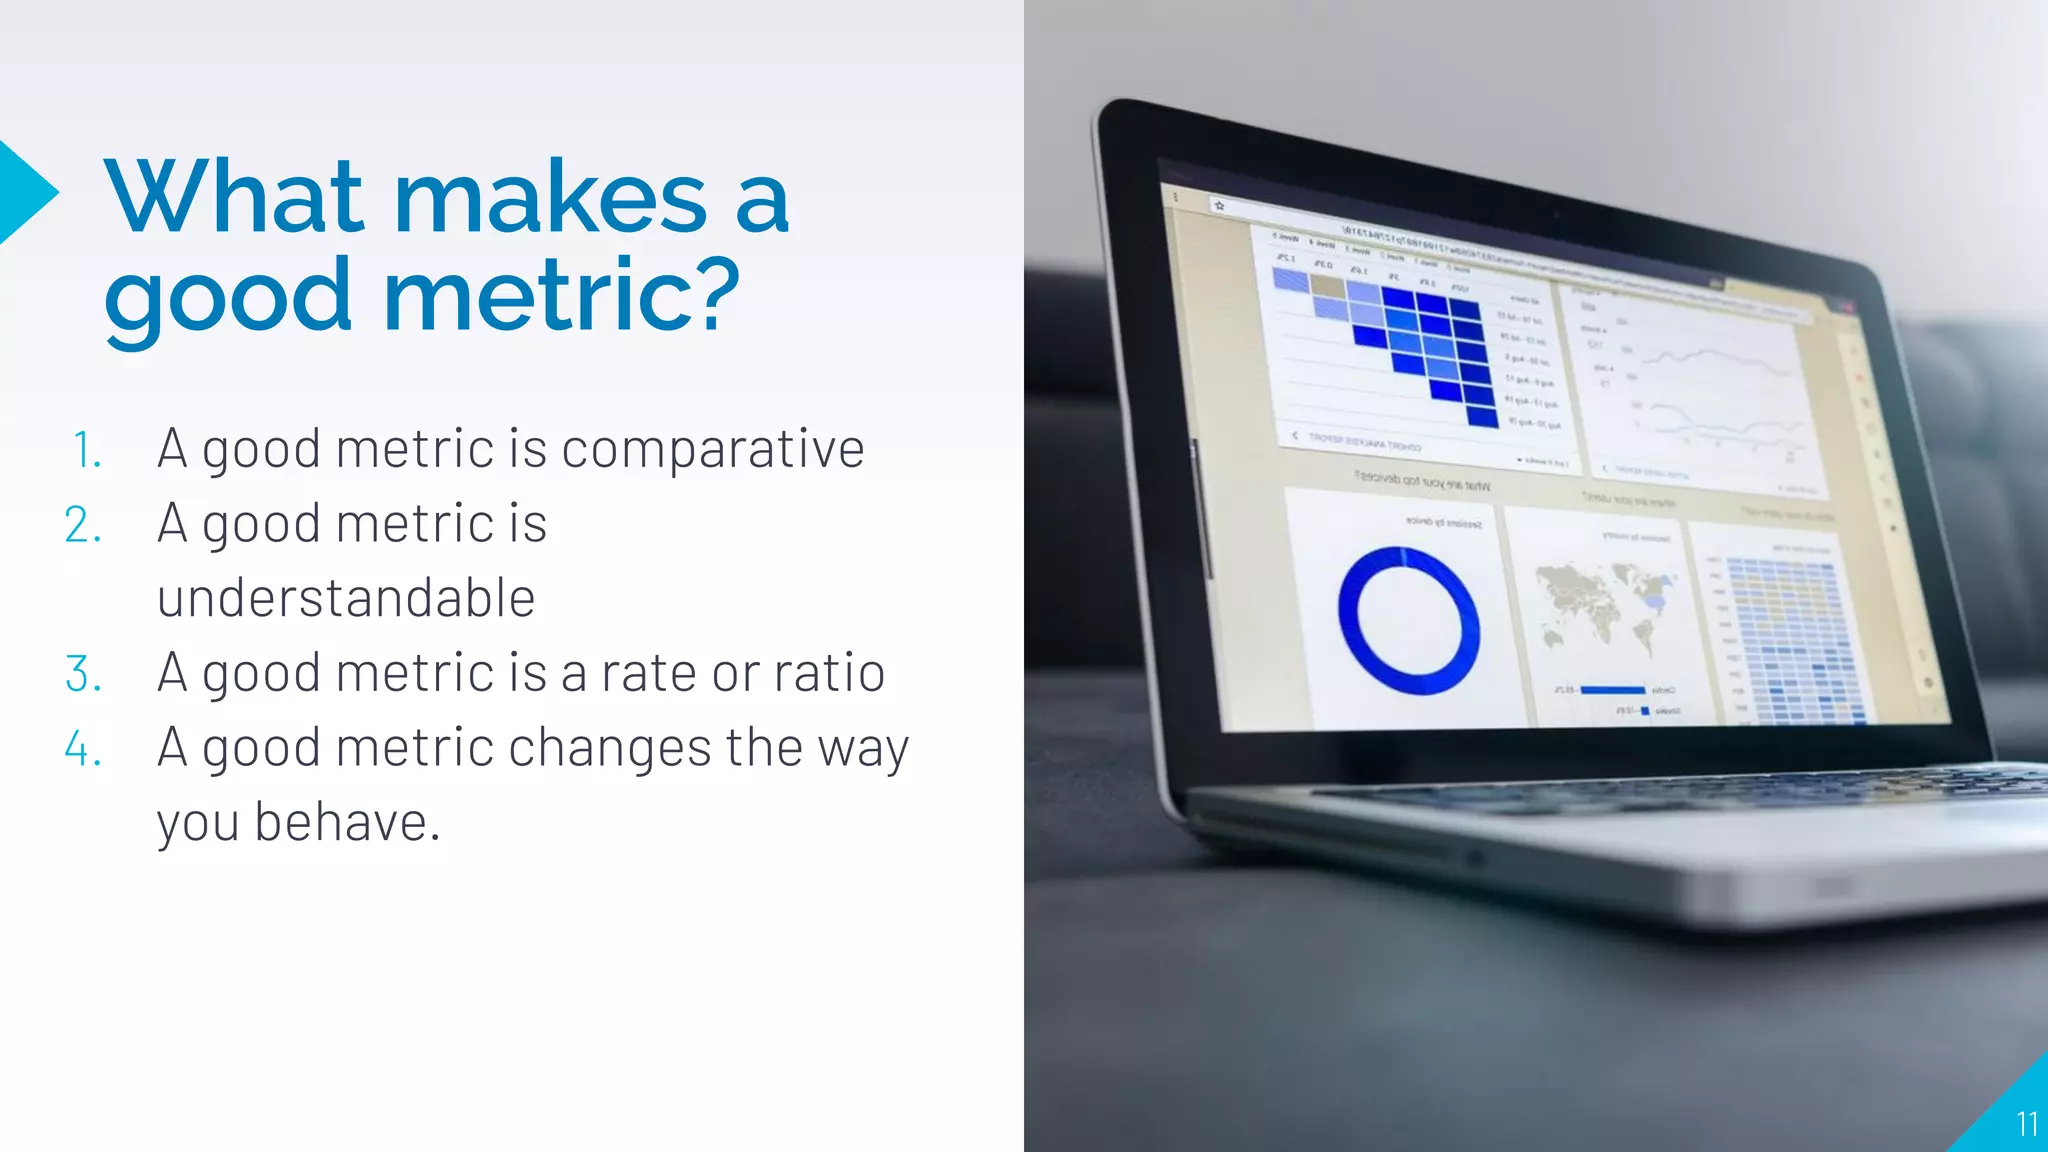
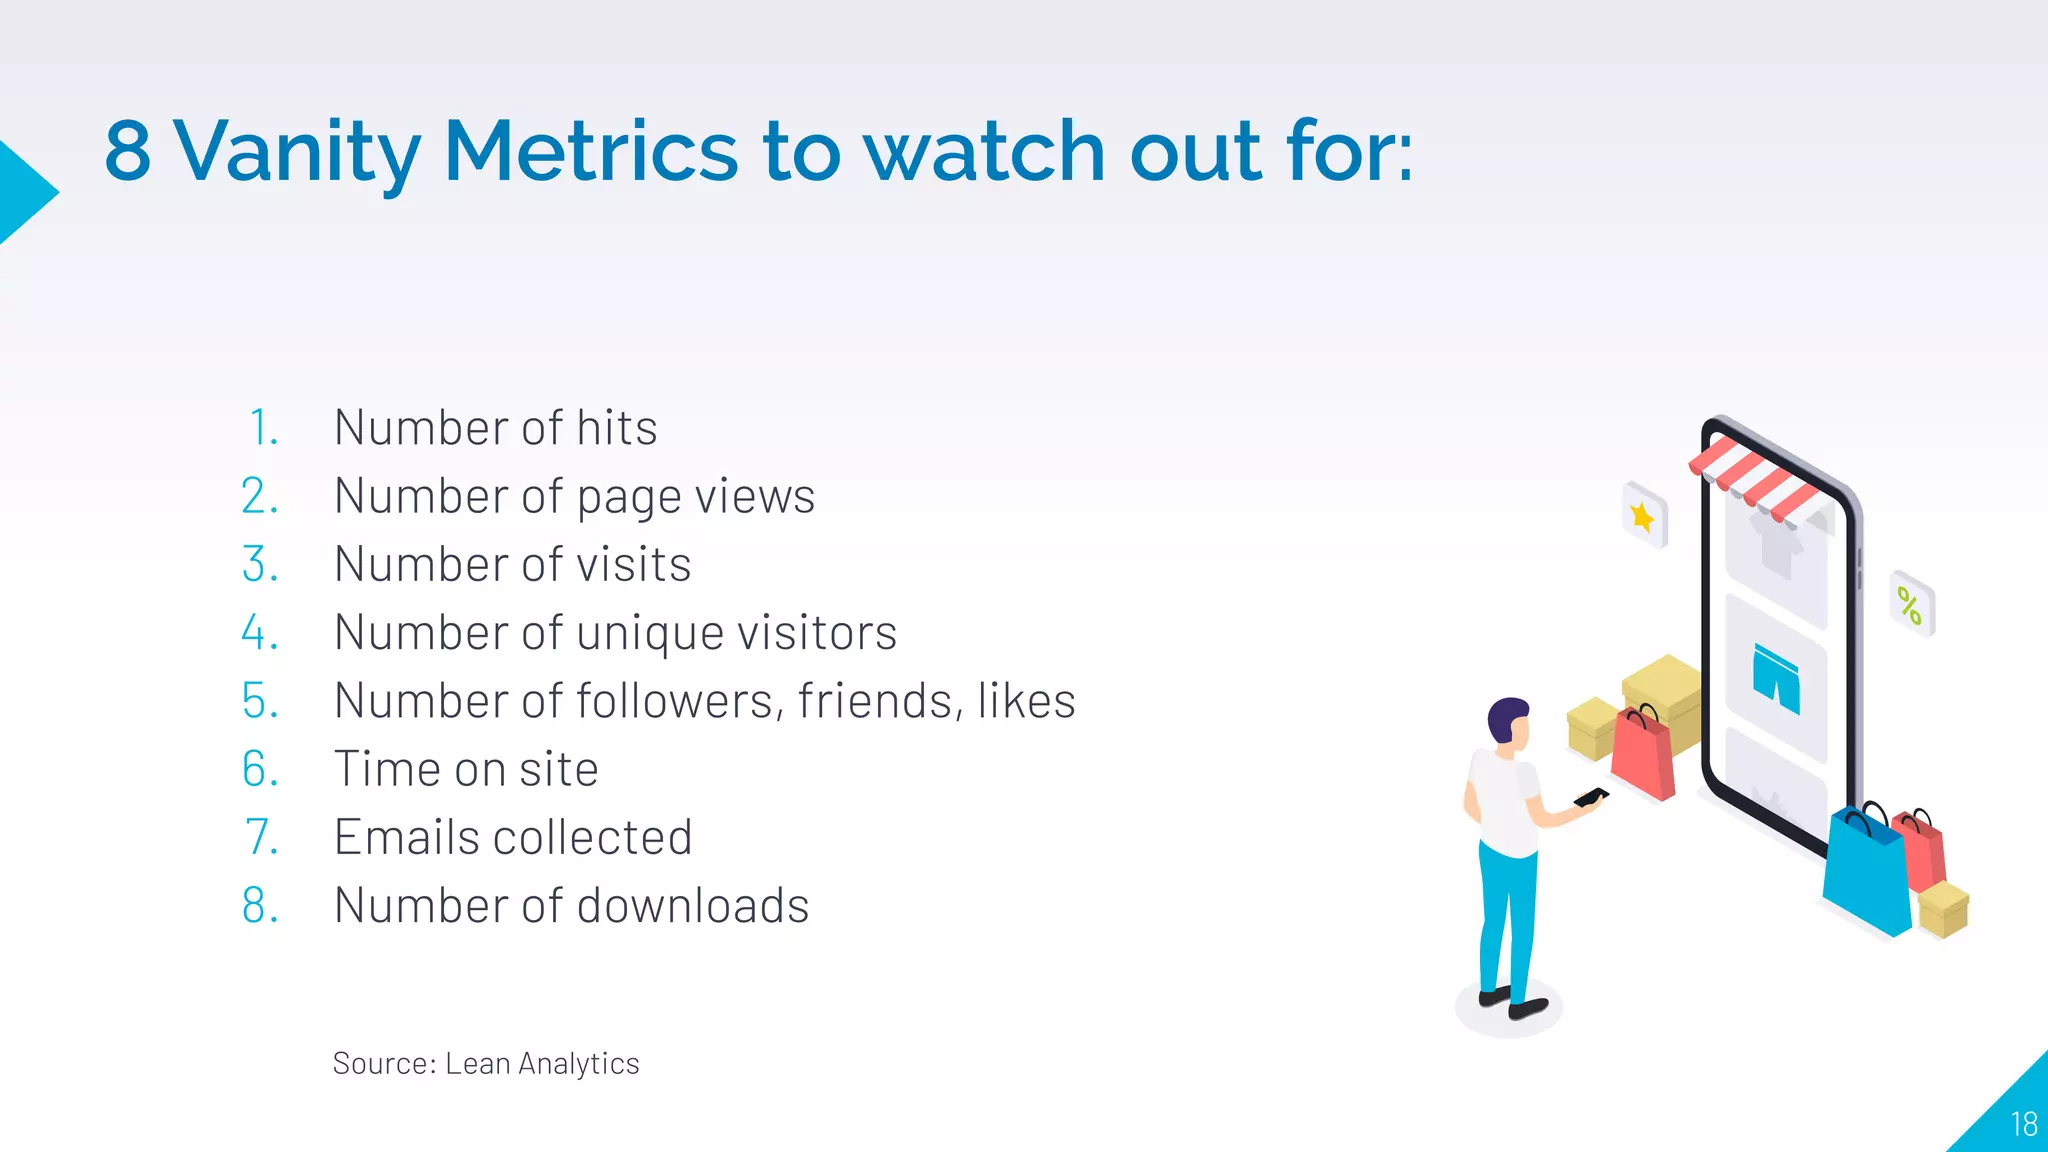
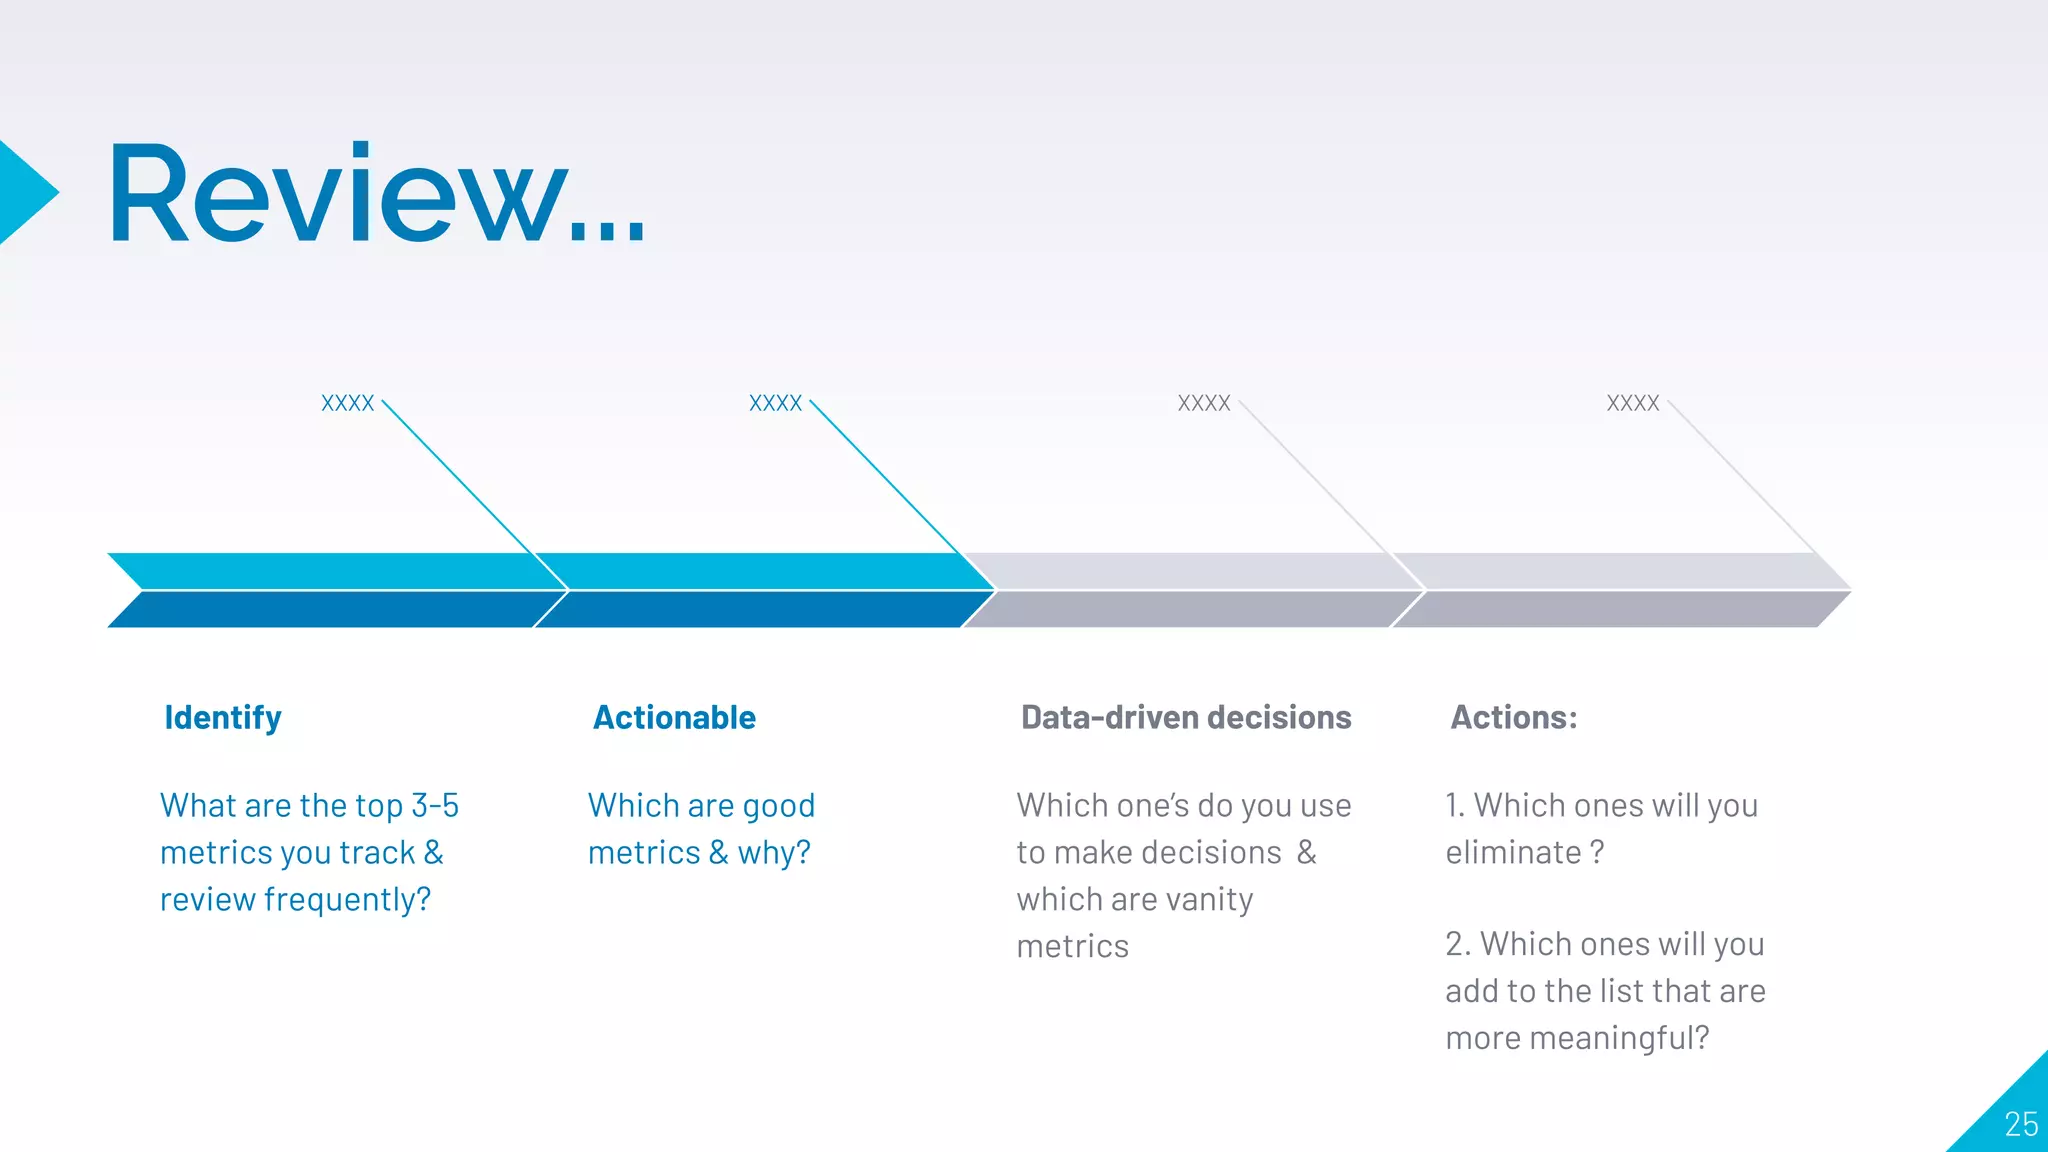
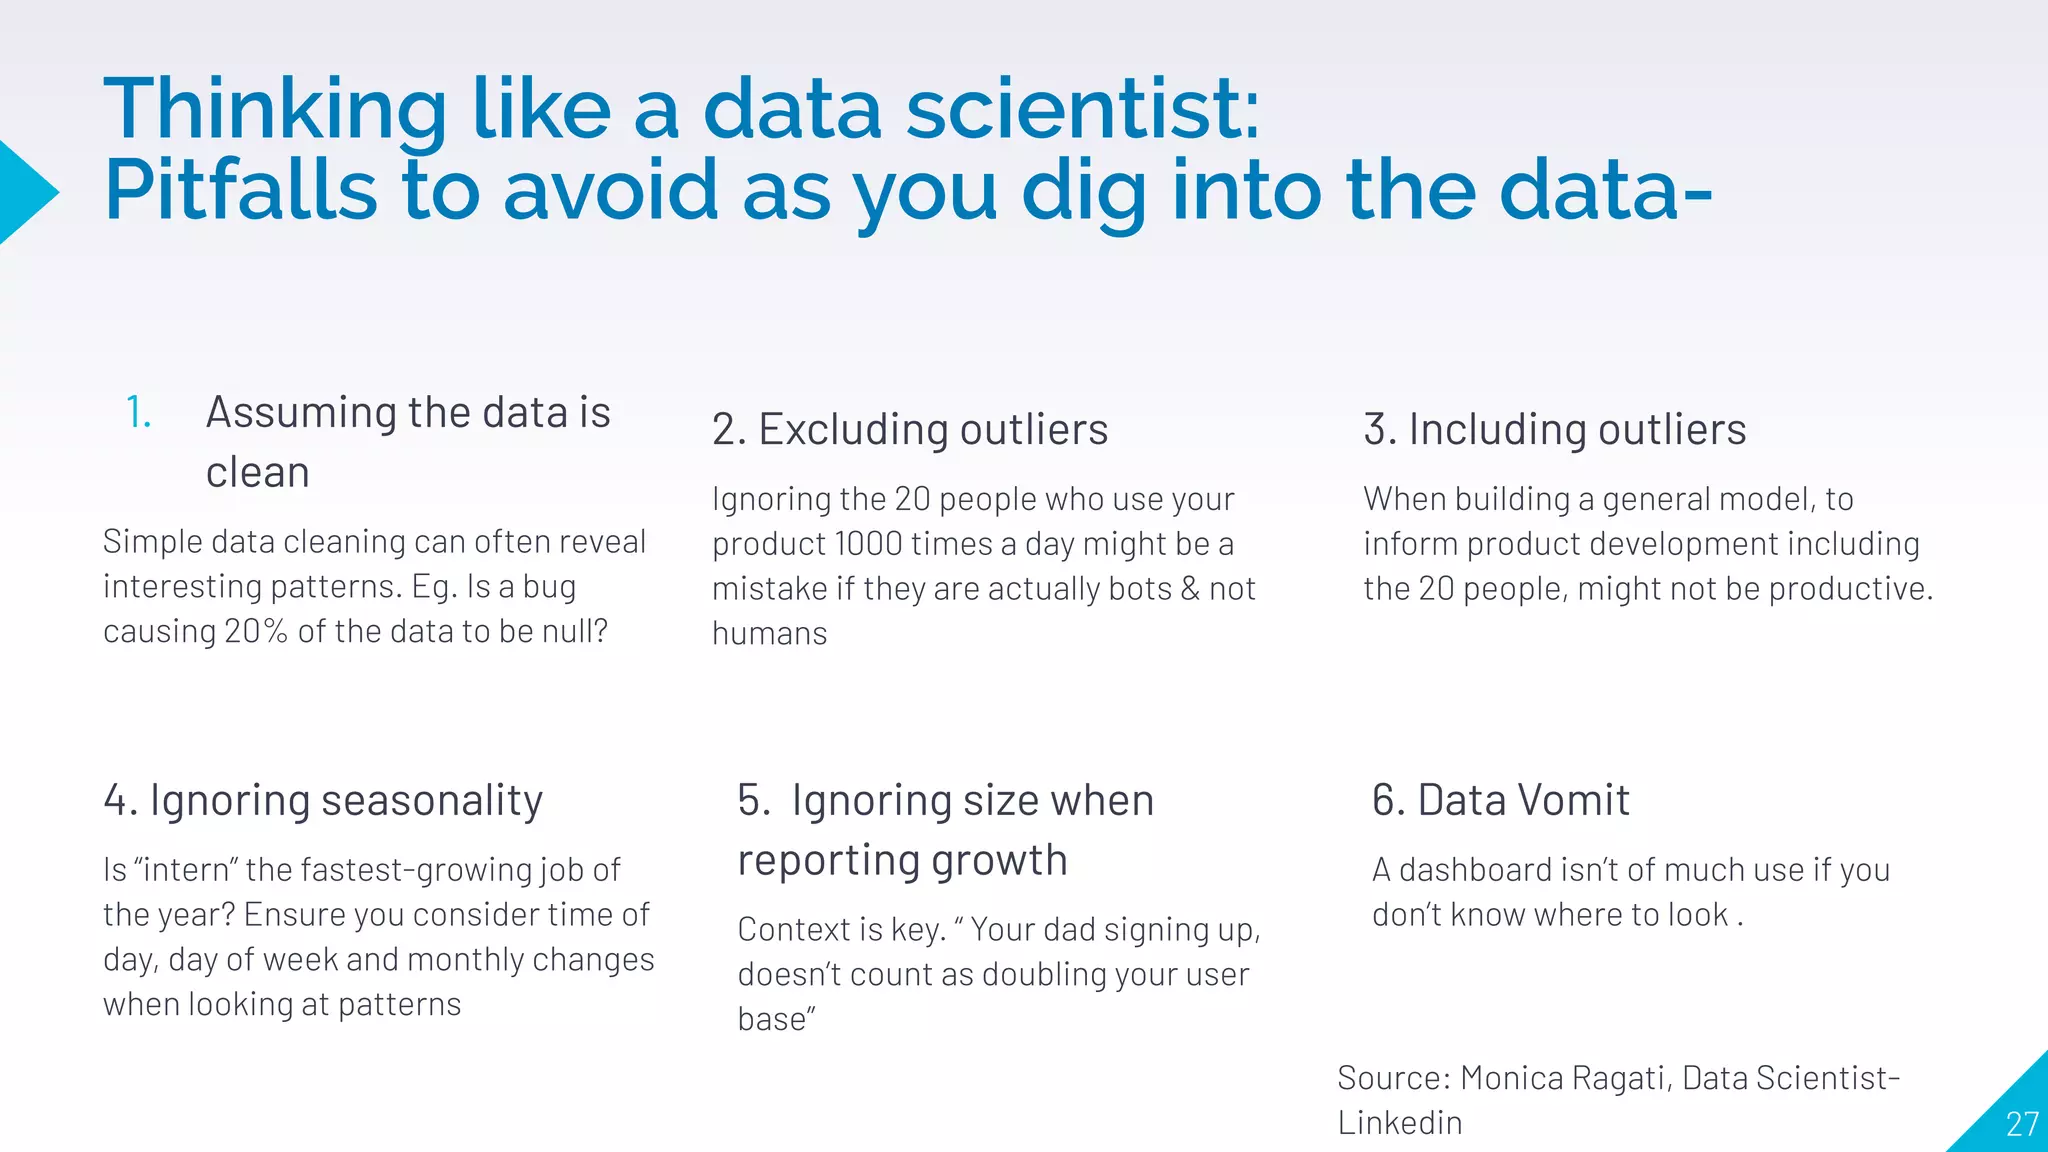
2. What makes a good metric, including being comparative, understandable, a rate or ratio, and changing user behavior. It warns against "vanity metrics" like page views or followers.
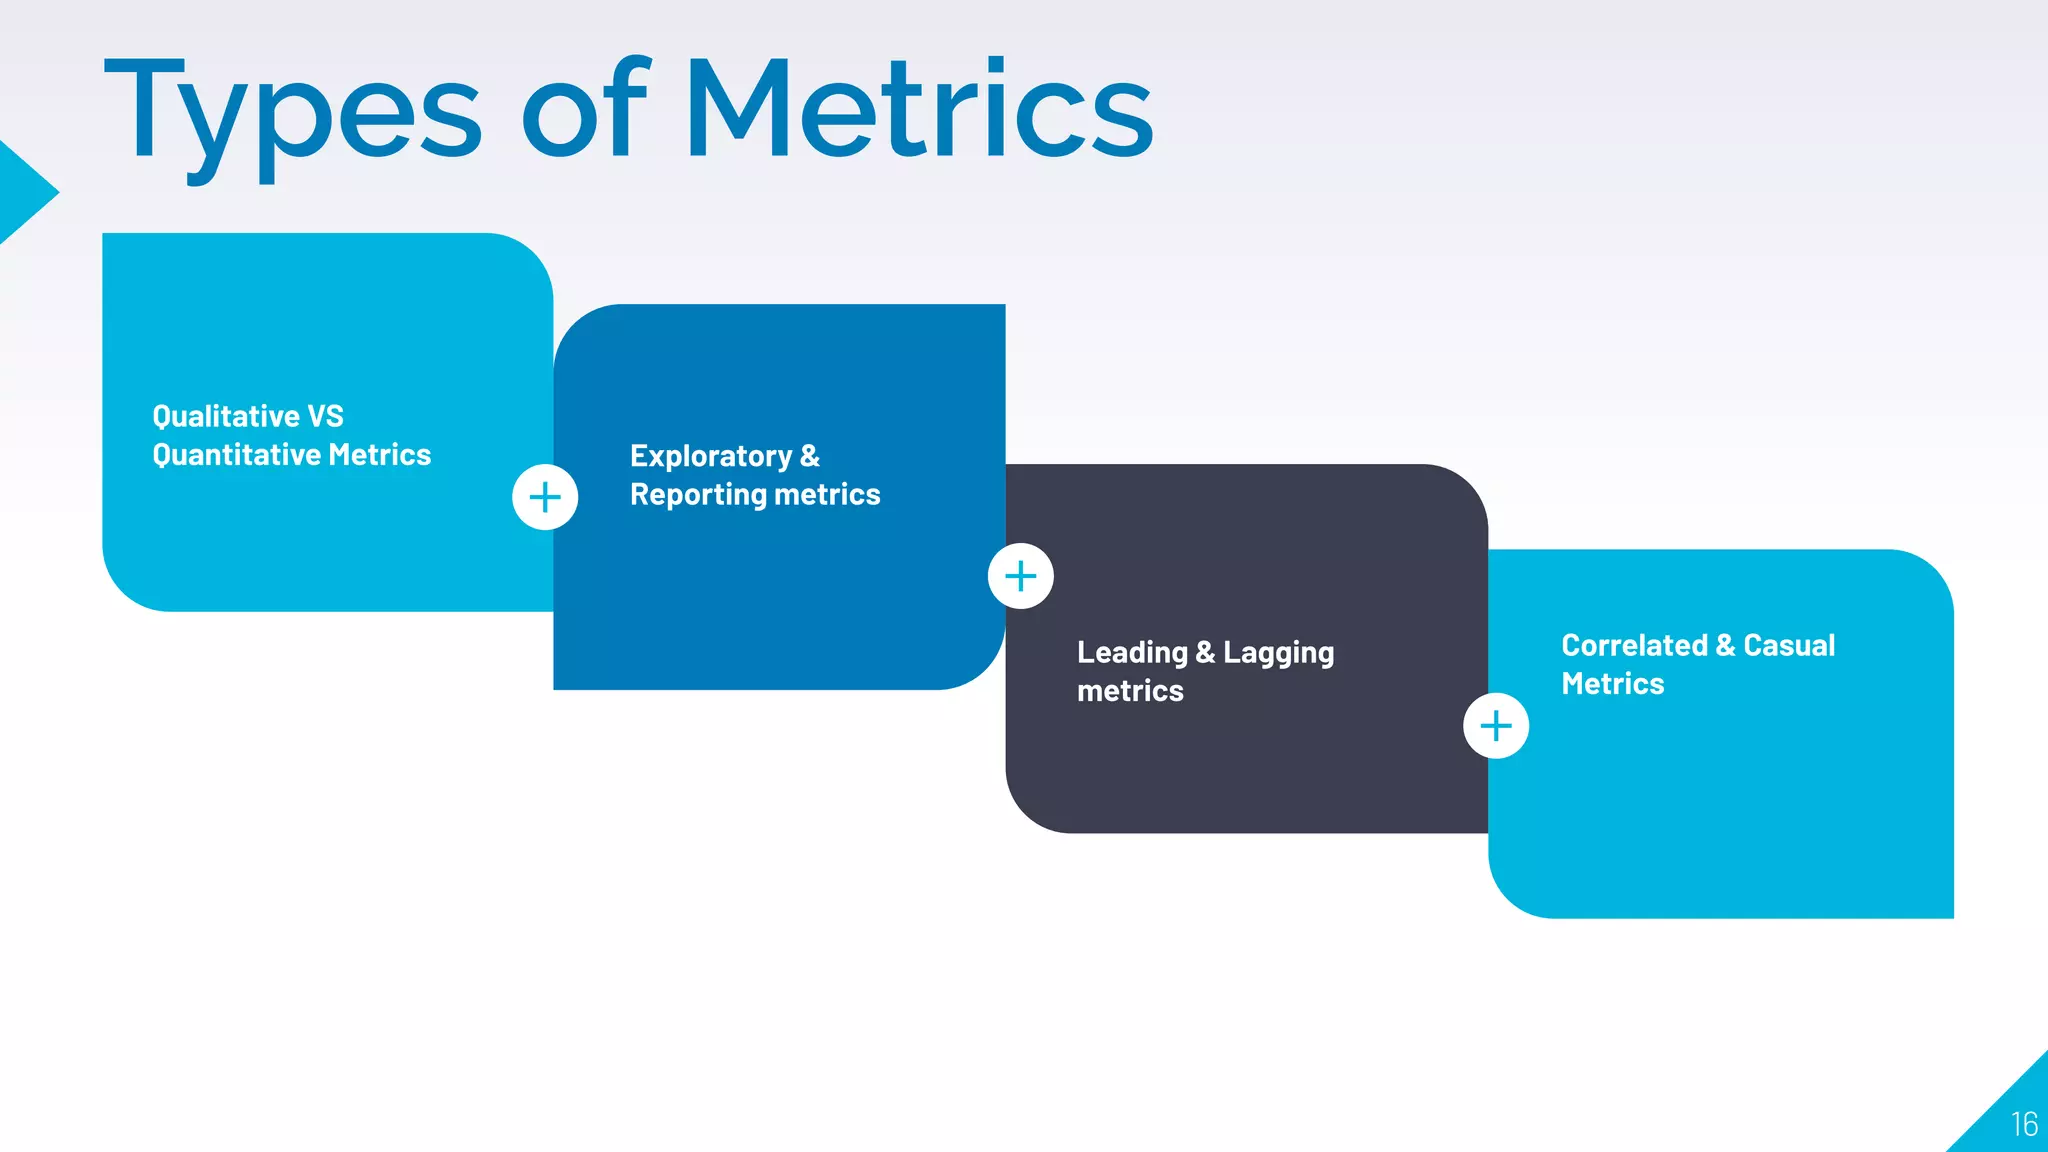
3. Different types of metrics including exploratory, qualitative vs. quantitative, leading vs. lagging, and correlated vs. causal.
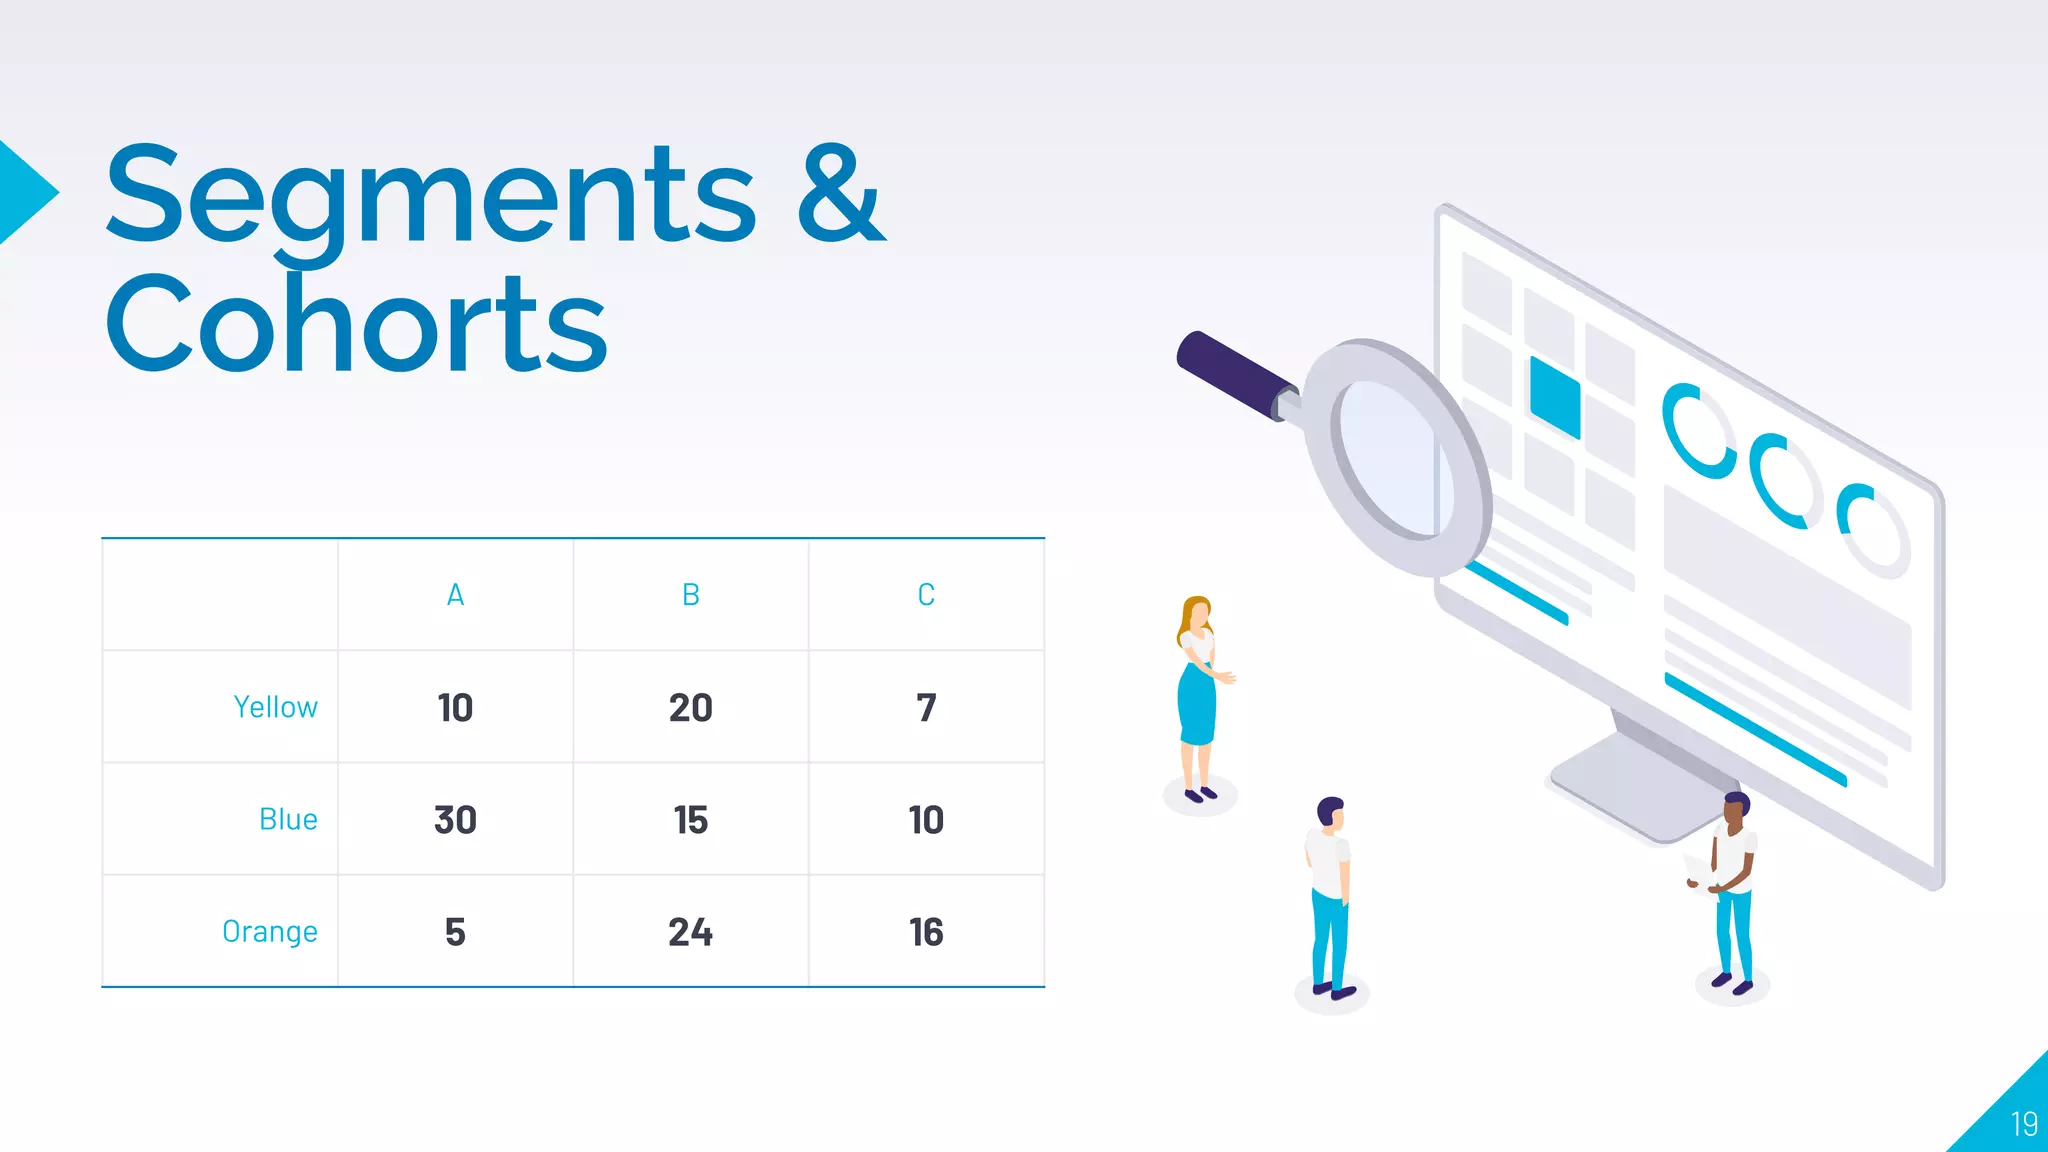
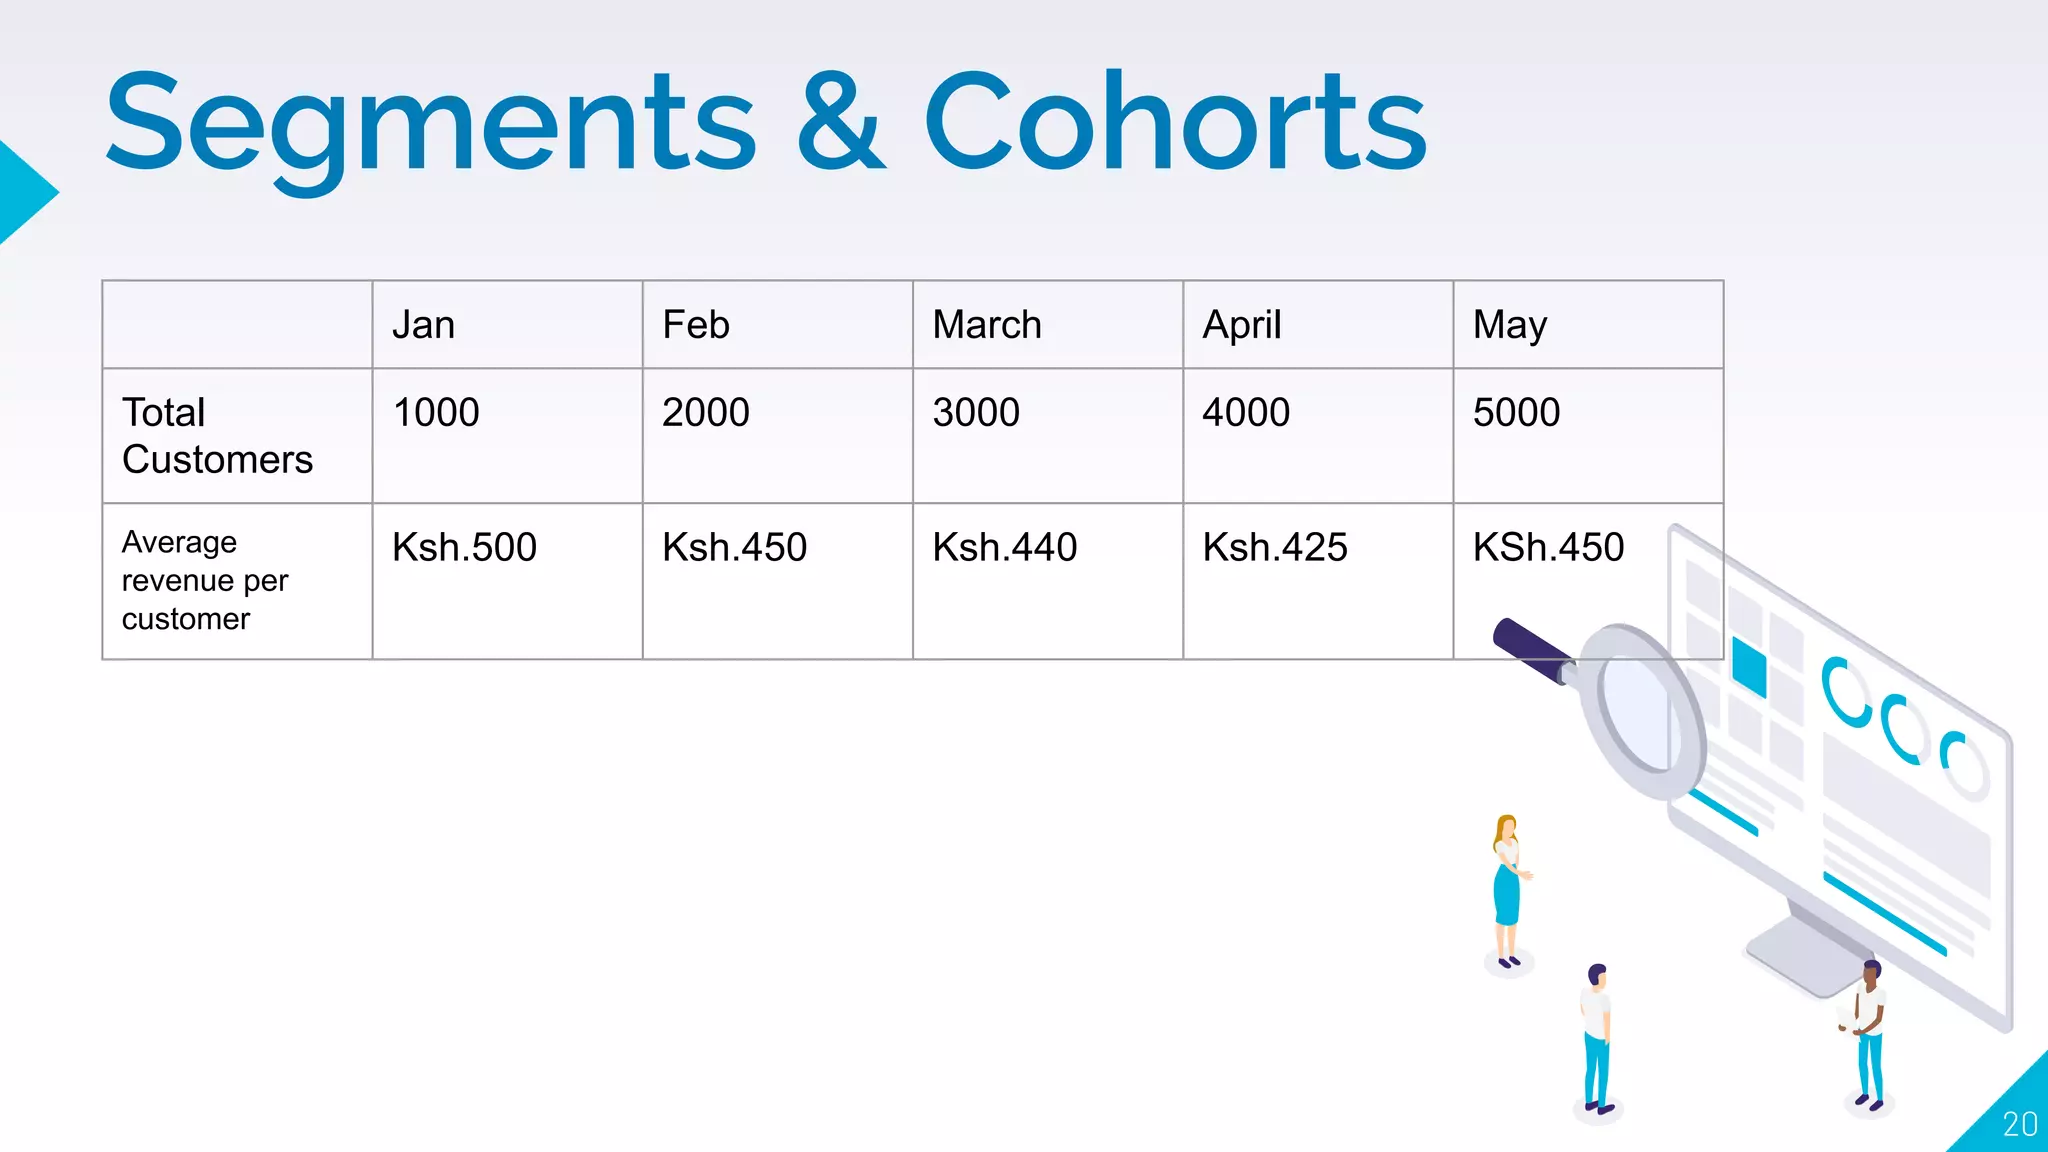
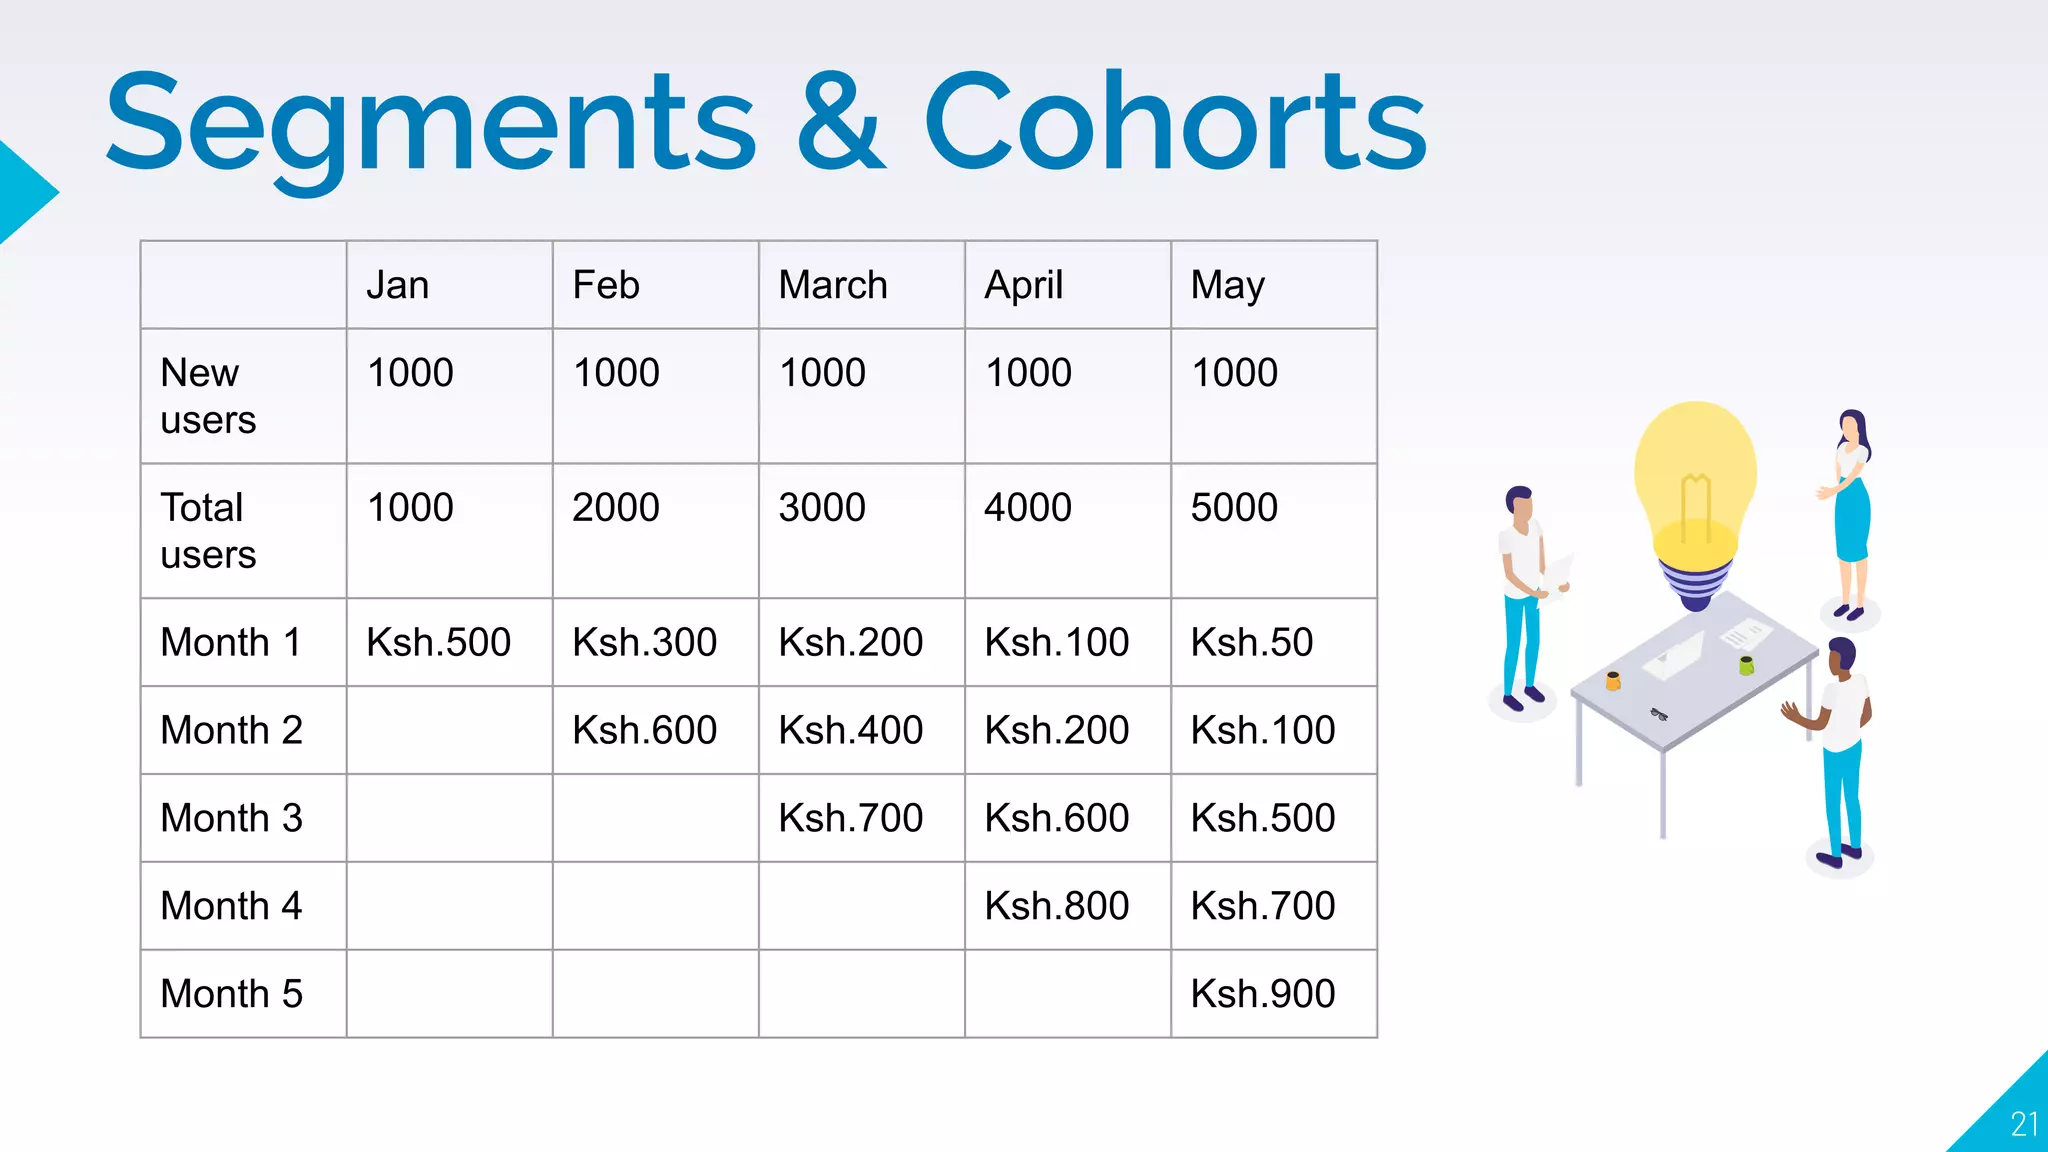
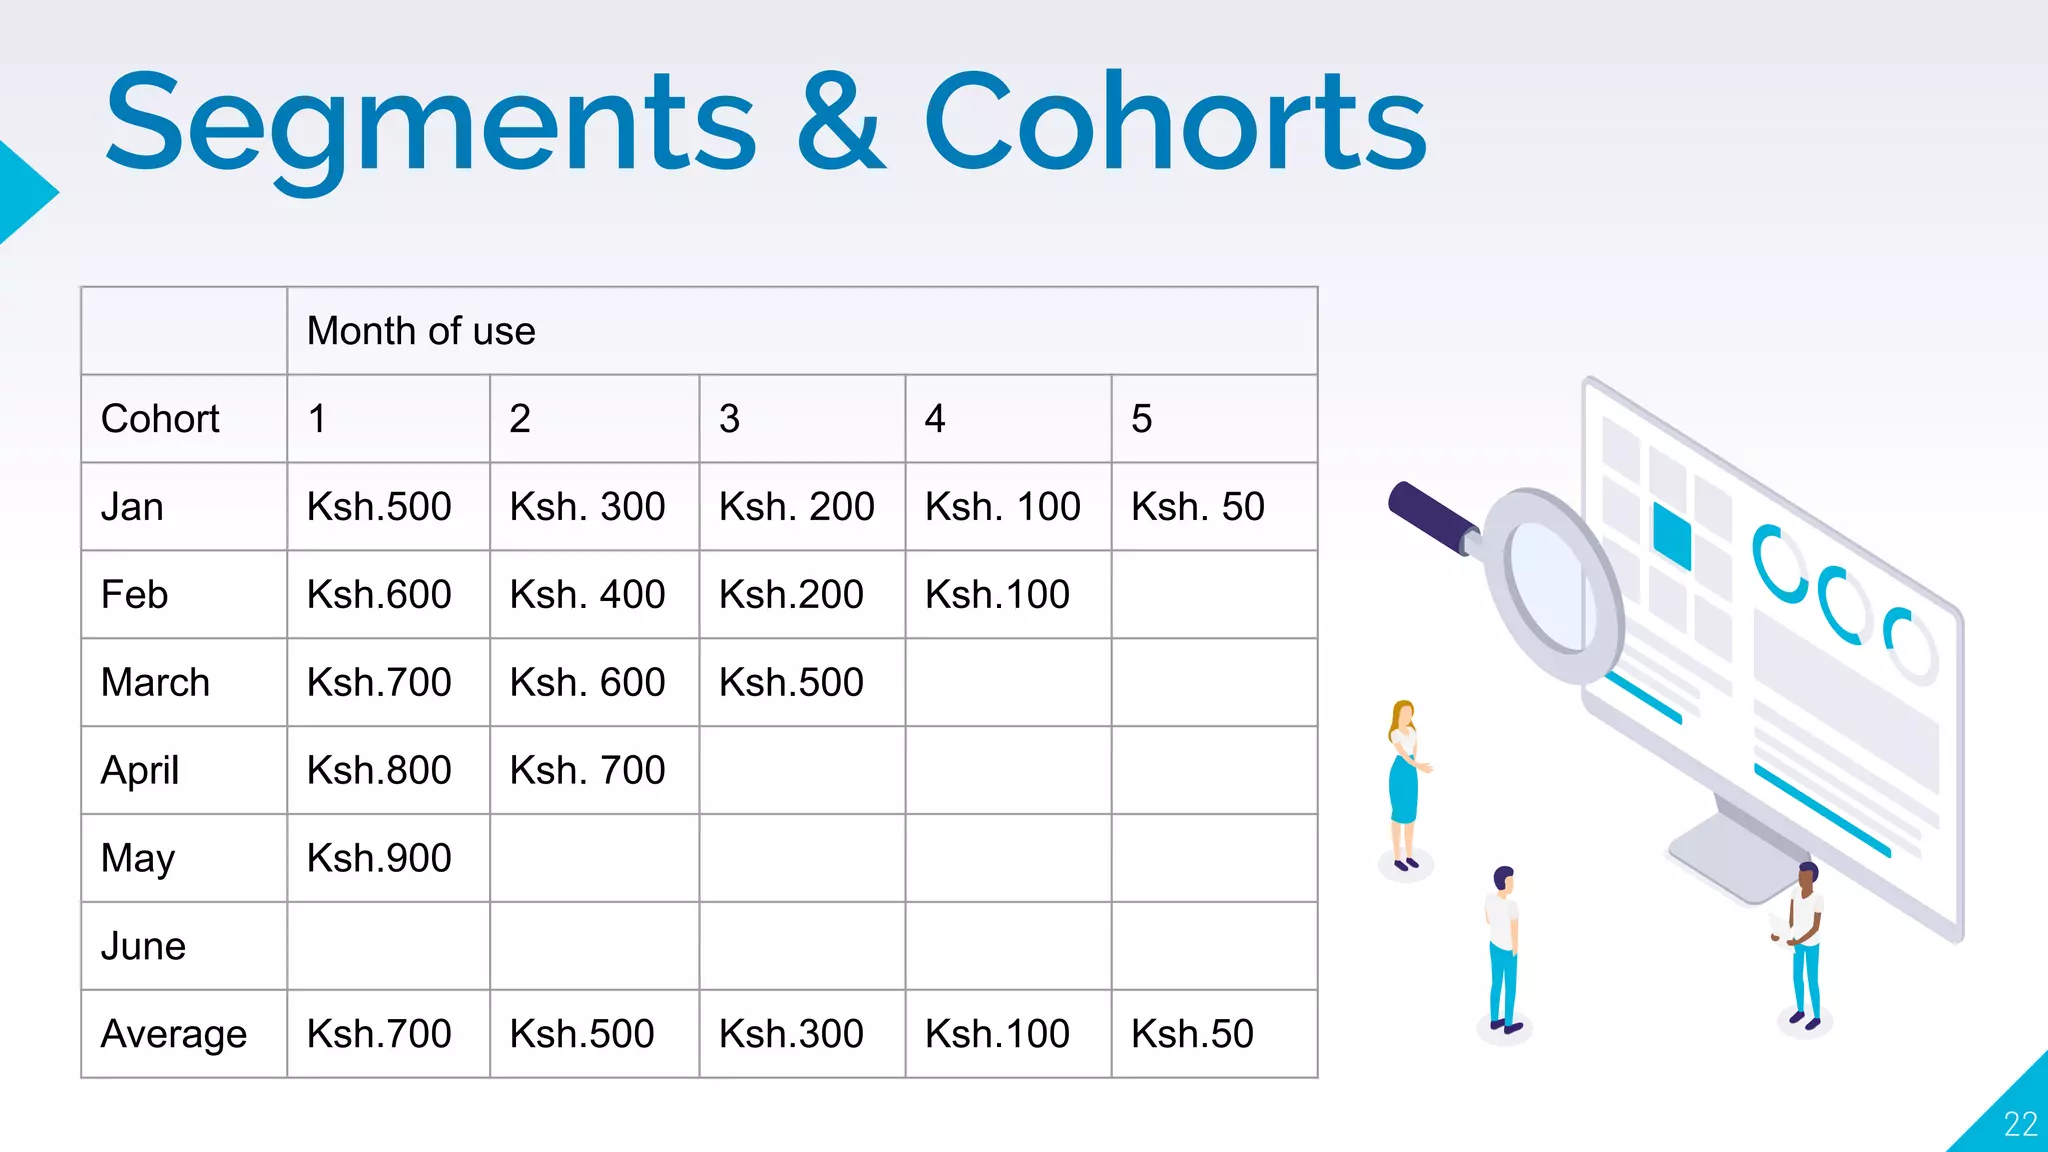
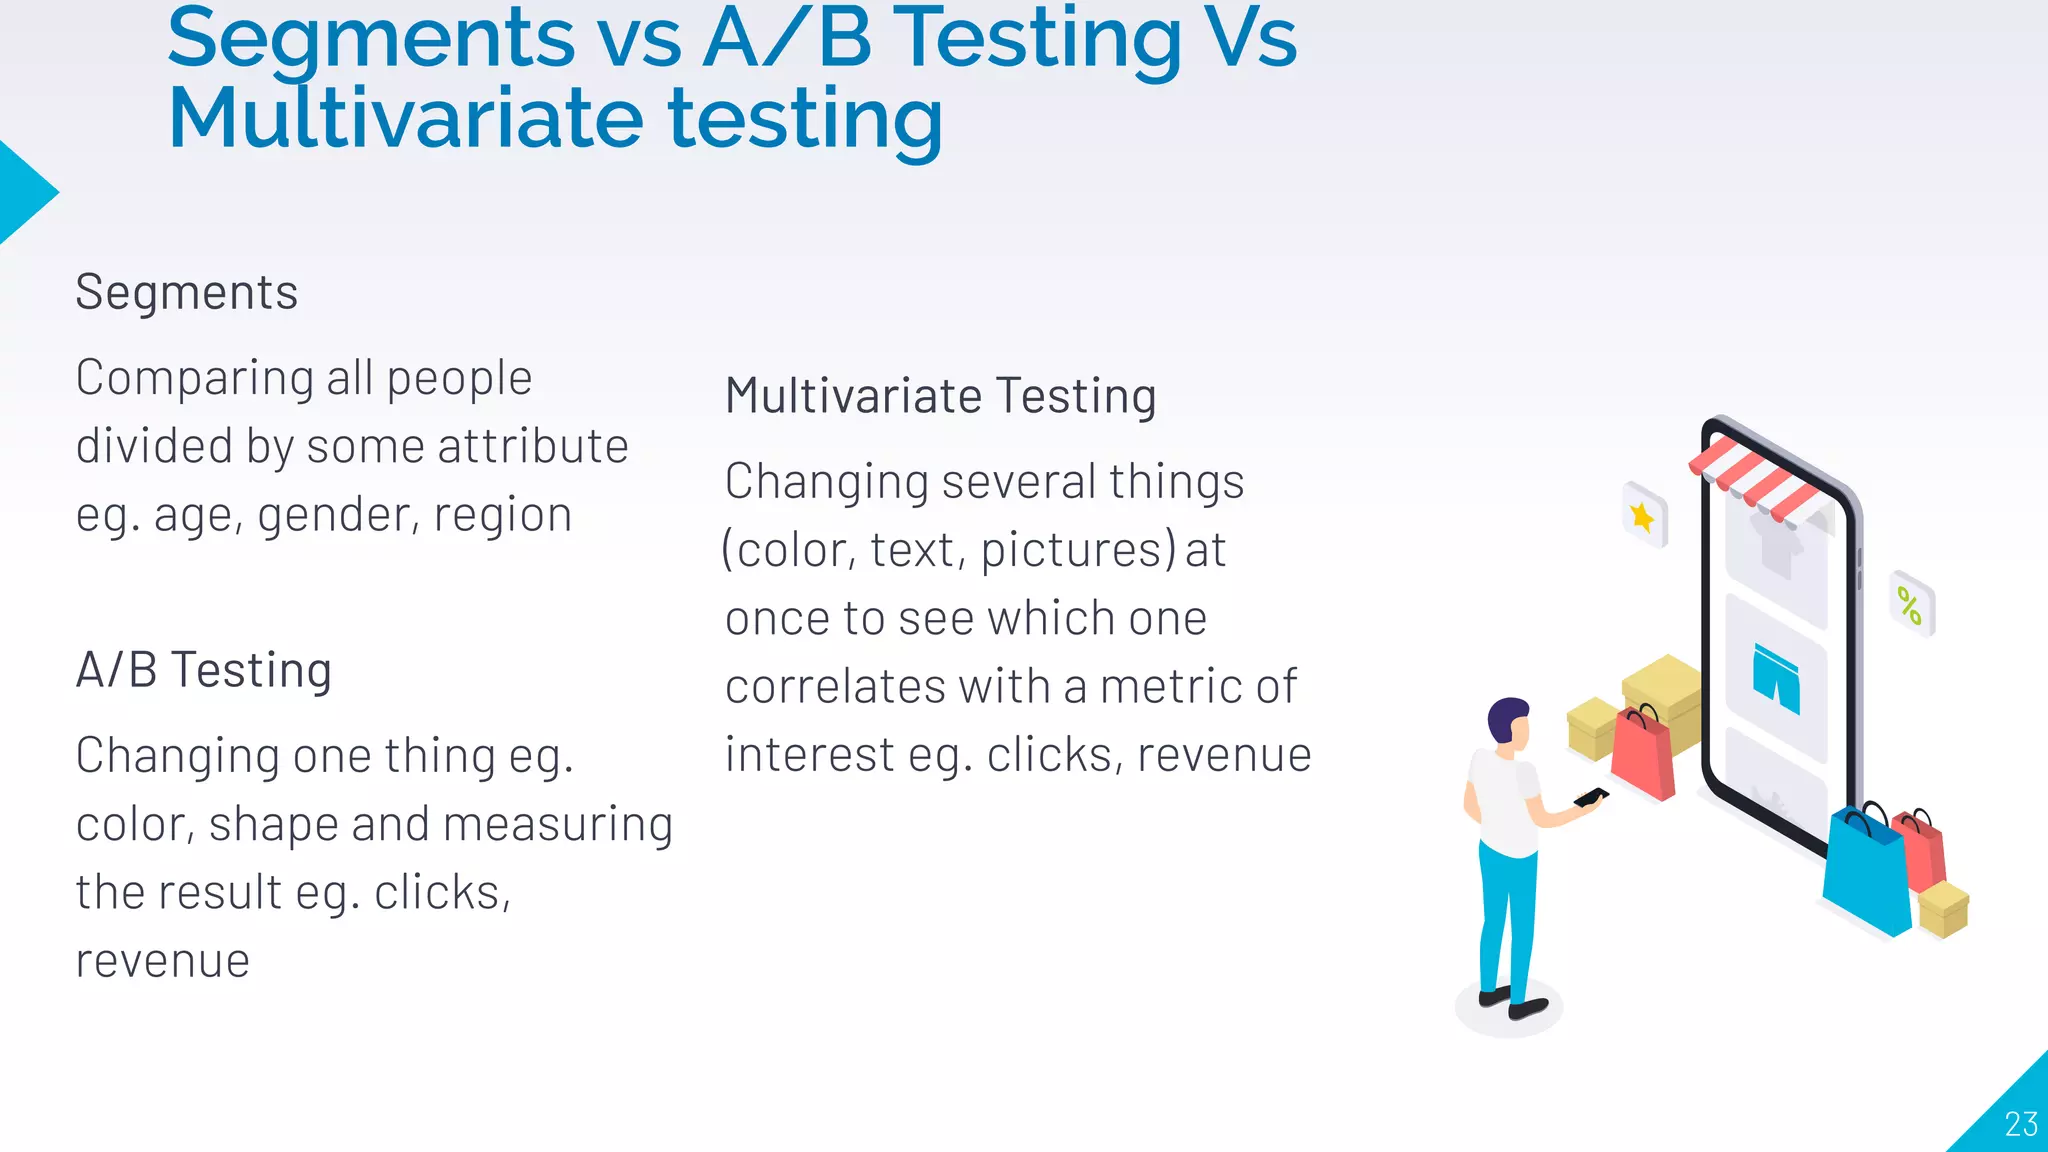
4. How to use segments, cohorts, A/B testing, and multivariate testing to test changes and see what correlates with desired