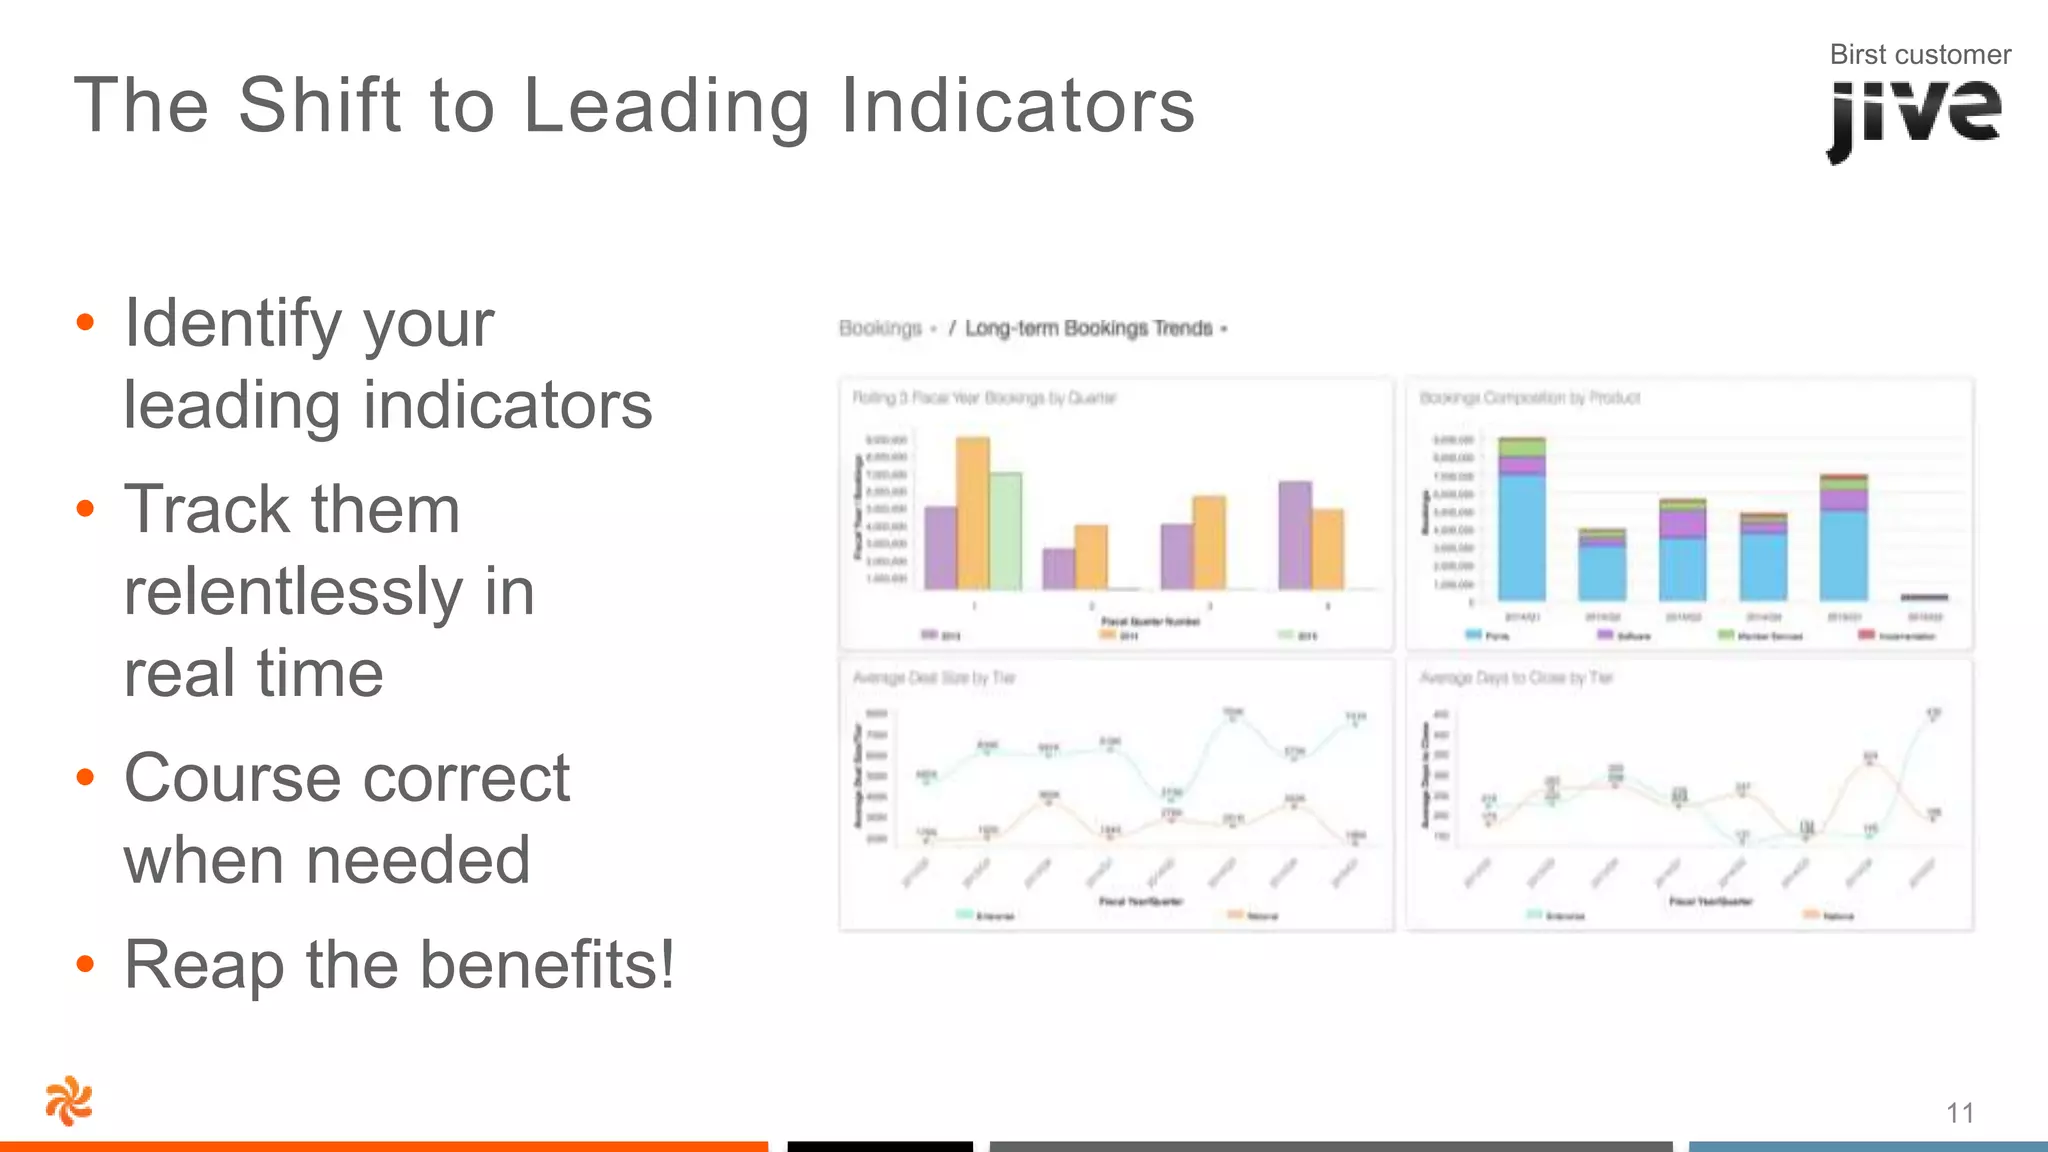
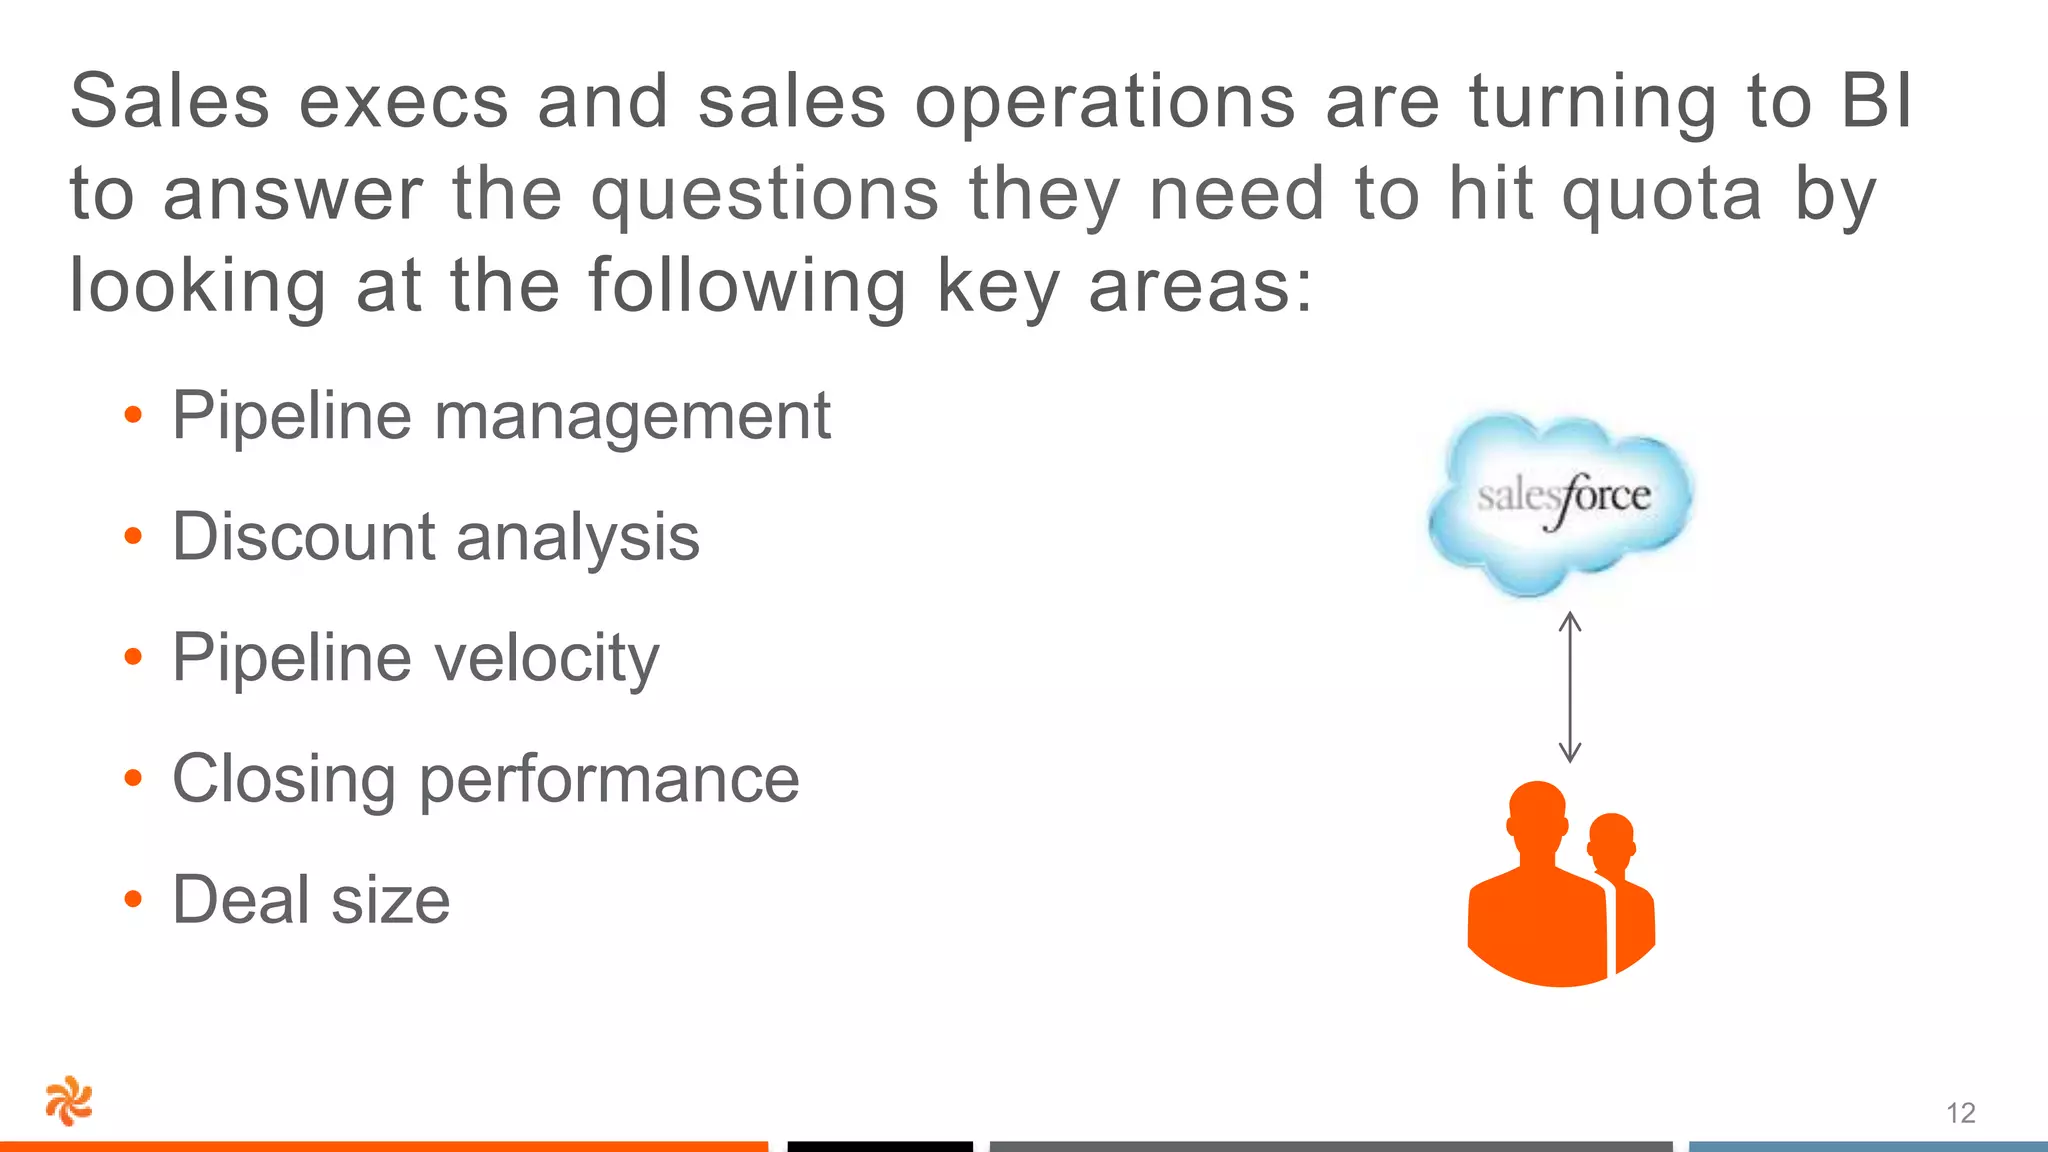
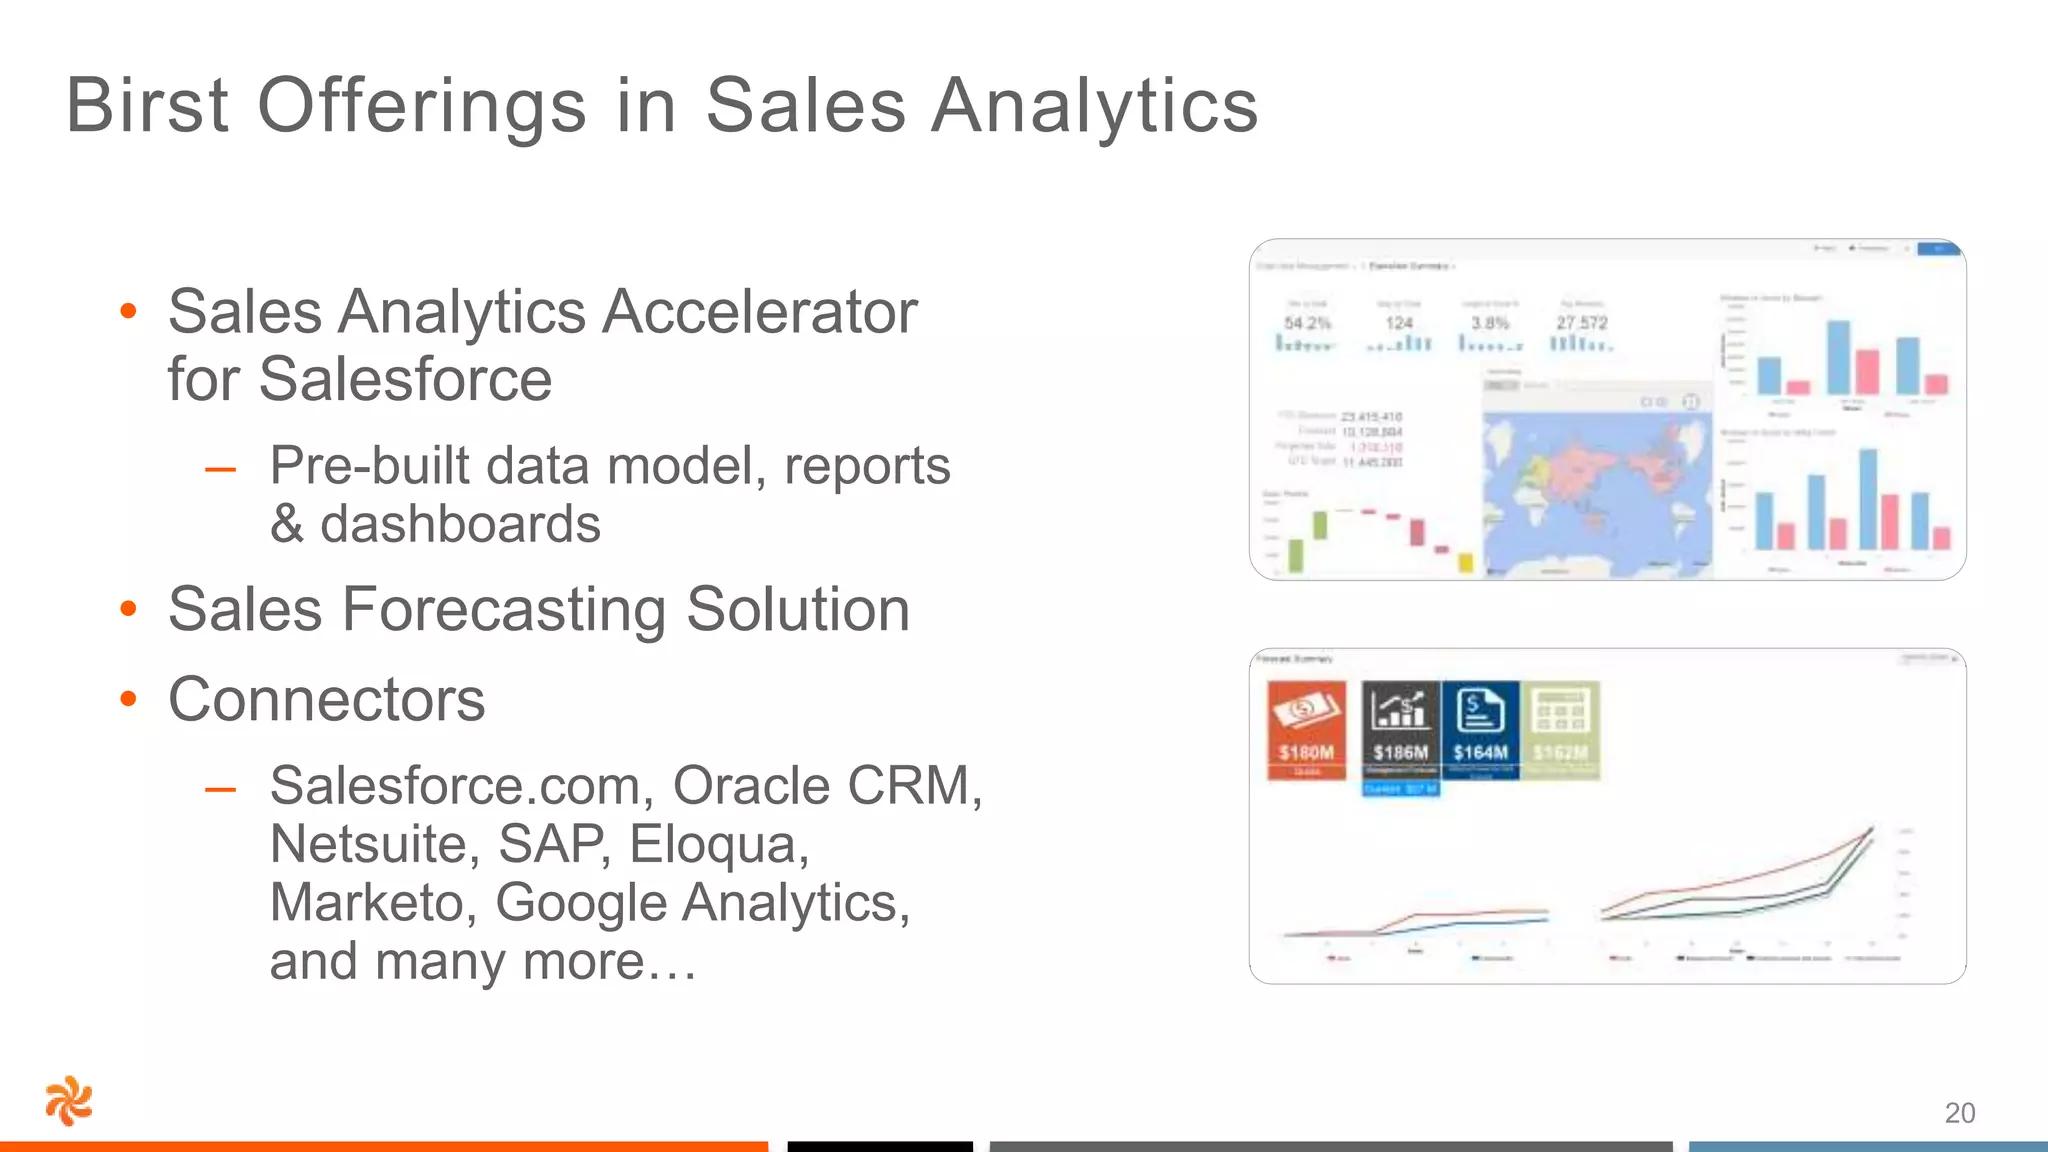
Insider Secrets on How You Can Meet Your
Revenue Goals with 95% Accuracy…. and
100% Confidence
2
Please send questions using
the online interface
Attendees muted upon entry
Webinar Notes
3
Agenda
How Jive uses Birst for Sales Operations
How Birst uses Birst in Sales Operations
Demo
Best practices / tips
4
Featured Speakers
Alex Saleh
VP of Business Operations
Adam Sold
VP of WW Sales Operations
(Birst Customer)
5
AVOIDING THE
SALES FORECAST
“HALL OF SHAME”
Birst customer
6
Remember 1st Generation iPhone?
Birst customer
7
The Shift to Leading Indicators
Birst customer
8
Ignoring Leading Indicators
Birst customer
9
Relentless Focus on Leading Indicators
Birst customer
10
The Results
Your Product Here
Birst customer
11
The Shift to Leading Indicators
• Identify your
leading indicators
• Track them
relentlessly in
real time
• Course correct
when needed
• Reap the benefits!
Birst customer
12
Sales execs and sales operations are turning to BI
to answer the questions they need to hit quota by
looking at the following key areas:
• Pipeline management
• Discount analysis
• Pipeline velocity
• Closing performance
• Deal size
13
Sales execs and sales operations are turning to BI
to answer the questions they need to hit quota by
looking at the following key areas:
• Pipeline management
• Discount analysis
• Pipeline velocity
• Closing performance
• Deal size
But it’s not that simple…
14
Improving Sales Performance requires analysis
across multiple data sources and action by many
people
Productivity
Hiring, training, ramp
time, etc.
Bookings
By rep, manager, lead
source, deal size, etc.
Rep Performance
By hiring cohort, territory,
ramped status, tenure, etc.
Upsells
By customer satisfaction levels,
product, sales channel, etc.
Loss Analysis
By employee training status,
manager, competitor, etc.
15
Improving Sales Performance requires analysis across
multiple data sources and action by many people
VP Sales
Sales Managers
Sales Reps
CFO
VP Marketing
VP HR
Data Scientists
Analysts
16
SALES ANALYTICS
AT BIRST
17
Where we focus today
Territory coverage &
hiring decisions
• What is the current coverage
• Where are the reps located
compared to their accounts
Forecast stress test
• Historical
• Deal scoring
Management
• Sales quota vs. close
• Pipeline coverage
• Composition of the pipeline
Pipeline diagnostics
• Pipeline movement
• Current and next Q pipe
• Pipeline aging
18
DEMO
19
Best Practices
Set expectations with
management and
stakeholders
Value-based Design -
focus on the metrics
that matter
Don’t just copy your
existing reports – beware
of paving the cow paths
Iterate – always
start small
Get executive
interest and
sponsorship
20
Birst Offerings in Sales Analytics
• Sales Analytics Accelerator
for Salesforce
– Pre-built data model, reports
& dashboards
• Sales Forecasting Solution
• Connectors
– Salesforce.com, Oracle CRM,
Netsuite, SAP, Eloqua,
Marketo, Google Analytics,
and many more…
21
Learn more
• Learn more about Birst
– www.birst.com
– Live Demo: www.birst.com/livedemo
 Every Tue/Thu at 11 AM PT
22
Thanks

Sales analytics webinar

  • 1.
    Insider Secrets onHow You Can Meet Your Revenue Goals with 95% Accuracy…. and 100% Confidence
  • 2.
    2 Please send questionsusing the online interface Attendees muted upon entry Webinar Notes
  • 3.
    3 Agenda How Jive usesBirst for Sales Operations How Birst uses Birst in Sales Operations Demo Best practices / tips
  • 4.
    4 Featured Speakers Alex Saleh VPof Business Operations Adam Sold VP of WW Sales Operations (Birst Customer)
  • 5.
    5 AVOIDING THE SALES FORECAST “HALLOF SHAME” Birst customer
  • 6.
    6 Remember 1st GenerationiPhone? Birst customer
  • 7.
    7 The Shift toLeading Indicators Birst customer
  • 8.
  • 9.
    9 Relentless Focus onLeading Indicators Birst customer
  • 10.
    10 The Results Your ProductHere Birst customer
  • 11.
    11 The Shift toLeading Indicators • Identify your leading indicators • Track them relentlessly in real time • Course correct when needed • Reap the benefits! Birst customer
  • 12.
    12 Sales execs andsales operations are turning to BI to answer the questions they need to hit quota by looking at the following key areas: • Pipeline management • Discount analysis • Pipeline velocity • Closing performance • Deal size
  • 13.
    13 Sales execs andsales operations are turning to BI to answer the questions they need to hit quota by looking at the following key areas: • Pipeline management • Discount analysis • Pipeline velocity • Closing performance • Deal size But it’s not that simple…
  • 14.
    14 Improving Sales Performancerequires analysis across multiple data sources and action by many people Productivity Hiring, training, ramp time, etc. Bookings By rep, manager, lead source, deal size, etc. Rep Performance By hiring cohort, territory, ramped status, tenure, etc. Upsells By customer satisfaction levels, product, sales channel, etc. Loss Analysis By employee training status, manager, competitor, etc.
  • 15.
    15 Improving Sales Performancerequires analysis across multiple data sources and action by many people VP Sales Sales Managers Sales Reps CFO VP Marketing VP HR Data Scientists Analysts
  • 16.
  • 17.
    17 Where we focustoday Territory coverage & hiring decisions • What is the current coverage • Where are the reps located compared to their accounts Forecast stress test • Historical • Deal scoring Management • Sales quota vs. close • Pipeline coverage • Composition of the pipeline Pipeline diagnostics • Pipeline movement • Current and next Q pipe • Pipeline aging
  • 18.
  • 19.
    19 Best Practices Set expectationswith management and stakeholders Value-based Design - focus on the metrics that matter Don’t just copy your existing reports – beware of paving the cow paths Iterate – always start small Get executive interest and sponsorship
  • 20.
    20 Birst Offerings inSales Analytics • Sales Analytics Accelerator for Salesforce – Pre-built data model, reports & dashboards • Sales Forecasting Solution • Connectors – Salesforce.com, Oracle CRM, Netsuite, SAP, Eloqua, Marketo, Google Analytics, and many more…
  • 21.
    21 Learn more • Learnmore about Birst – www.birst.com – Live Demo: www.birst.com/livedemo  Every Tue/Thu at 11 AM PT
  • 22.

Editor's Notes

  • #7 ATT Pre launch sell through data. Causing supply shortage at the ATT stores. Two weeks before quarter end, Head of Sales calls a $23M booking number. The number hinges on a bunch of small deals and a handful of multi million $ deals. 1am Eastern on the last day of the quarter, with 2 Gallons of coffee consumed, two of the deals push out to the following quarter. Legal process gets the blame. The quarter closes at $19.7M. 15% miss. What just happened? The team had little understanding of the Pipeline construct and deal profile, They had little visibility to the leading indicators that would have helped predict the bookings outcome. Thanks: Birst CS and Product Management for their support on the transition to the new Birst Dashboards 2.0 and for organizing the webinar. Thanks to the audience for taking precious time and joining in.
  • #8 The core differentiator is the move from focus on desired outcome, to focus on leading indicators. Getting comfortable with transition from Deal, Rep and Territory/Vertical profile focus, to lead conversion rates and pipeline stage progression, and use BI tools to support the process.
  • #9 The core differentiator is the move from focus on desired outcome, to focus on leading indicators. Getting comfortable with Deal, Rep and Territory/Vertical profile to lead to a desired outcome and use BI tools to support the process.
  • #10 4DX – The Four Disciplines of Execution : From inventory predictive analytics and NEC through Quality Control root cause analytics at Apple to Reveue, Booking and Billing BI At Achievers. Over the past couple of quarters at Achievers, we got to a 5%-10%forecast accuracy through deep but simplified understanding of the sales and account management leading indicators using Birst and a handful of transactional feeder systems (SFDC, Marketo, Netsuite...)
  • #11 Formula for success: Identify the three leading indicators, gain consistent and frequent visibility and publish them regularly. Get your team comfortable looking at them and understanding / addressing them as you go. Examples: Leads created, Days in stage, Rep Coverage, Average Deal size, etc. The forecast accuracy achieved at Achievers was a result of relentless pursue of the impact of leading indicators on sales results. We changed our business model and updated our forecast numbers as result. The future will tell the success of the methodology but insight well ahed of time has been achieved.
  • #13 There is a lot of buzz around sales analytics. Sales leaders and sales operations are using analytics to hit their quota. But it is not that simple.
  • #14 There is a lot of buzz around sales analytics. Sales leaders and sales operations are using analytics to hit their quota. But it is not that simple.
  • #15 For example, just analyzing “close rate” can be incredibly complex. There are a number of metrics to look at, and each of these metrics can be sliced and diced across various qualitative values. This requires pulling data from several different sources. And it also impacts a number of different people within the company.