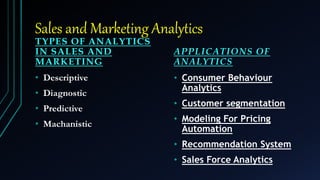
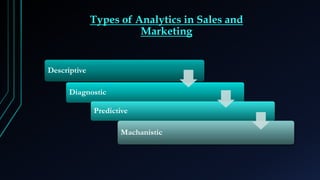
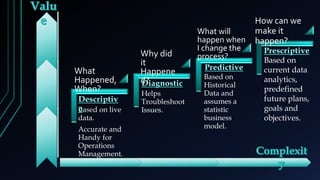
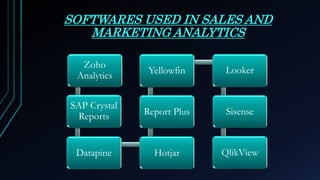
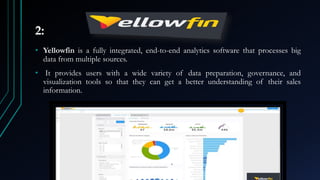
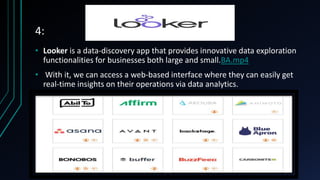
Sales and Marketing Analytics
TYPES OF ANALYTICS
IN SALES AND
MARKETING
• Descriptive
• Diagnostic
• Predictive
• Machanistic
APPLICATIONS OF
ANALYTICS
• Consumer Behaviour
Analytics
• Customer segmentation
• Modeling For Pricing
Automation
• Recommendation System
• Sales Force Analytics
Analyzing sales process and
team will help us diagnose
the barriers to sales force
performance. It will enable
us bring more efficiency in
sales force by providing us
insights on issues like
optimum sales territory size,
optimum product bag size,
the quality of leads and
monthly target forecasts.
Sales Force
Analytics
Marketing Mix Analytics
SOFTWARES USED IN
SALES AND MARKETING
ANALYTICS
Marketing
Mix
Product
Price
Place
Promotion
Zoho
Analytics
SAP Crystal
Reports
Datapine Hotjar
Report Plus
Yellowfin Looker
Sisense
QlikView
• Sales include “operations and activities involved in promoting and selling goods
or services.”
• Marketing includes “the process or technique of promoting, selling, and
distributing a product or service.”
• Every business would have silos of business data in its marketing/sales
department. This data has hidden treasures. It contains information that can help
target right audience more effectively, bring in more efficiency in the sales process
and also forecast the future of business. To generate these insights from the large
unorganized databases we use business analytics.
Introduction
Types of Analytics in Sales and
Marketing
Descriptive
Diagnostic
Predictive
Machanistic
Based on live
data.
Accurate and
Handy for
Operations
Management.
Helps
Troubleshoot
Issues.
Based on
Historical
Data and
assumes a
statistic
business
model.
What
Happened,
When?
Why did
it
Happene
d?
What will
happen when
I change the
process?
How can we
make it
happen?
Based on
current data
analytics,
predefined
future plans,
goals and
objectives.
Applications of Analytics
• Consumer
Behaviour
Analytics
Analyzing consumer behavior would
help us understand when, why, how, and
where people do or do not buy a
product. By understanding this we can
bring in changes to our product and
marketing strategy helping us attract
more consumers.
• Customer
segmentation
This kind of segmentation can be built upon
the product groups that come out of a
Market basket analysis. Product groups are
groups of products that are bought together.
This approach basically groups together
people on their buying behaviour. People
who exhibit similar buying behaviour are
grouped together and targeted using segment
level strategies.
Modeling For Pricing
Automation
Deeper machine learning application
may fall in areas such as price elasticity
modeling, channel affinity modeling,
influence group link modelling, and
consumer life event modelling.
Recommendation
System
Recommendation systems are those systems
that are widely used in online systems to
suggest items that users might find
interesting.
These recommendations are generated using
in particular two techniques: content-based
and collaborative filtering. This paper aims to
define a new system, namely Marketing
Recommender System, a system that serves
marketing and uses techniques and methods
of the digital economy.
Marketing Mix Analytics
Analyzing returns on marketing
expenditure across various channels
would help us evaluate the effectiveness
of each of the marketing activities. These
insights will help us to reallocate
resources from a less effective to a more
effective channel.
Marketing
Mix
Product
Price
Place
Promotion
• Analytics on
Communication
Content
Analyzing consumer behavior on the
communication content helps us
observe how consumers react to our
marketing material. This gives us
insights on how to draw consumer’s
attention towards our products and
will enable us convey our message
clearly.
• Web Analytics
Web analytics helps us understand user
behavior on the web and consequently
generate more leads and sales. It will
provide insights to enhance the look
and layout of your website and make it
more user-friendly. With these insights
we can also asses and strategize the
effectiveness of marketing campaigns
in order to get more valuable
customers.
Sales Analytics Metrics
 Sales metrics helps increase your performance, optimize sales
activities, and improve accountability.
 A well-defined sales analytics strategy provides your team with focus
and clarity so they can concentrate on doing what they do best.
 Sales analysis revolves around your ability to grow revenue.
SALES GROWTH SALES TARGET
Product Performance SALES-TO-DATE TARGET
SELL-THROUGH RATE
CANNIBALIZATION
RATE
SALES PER REP
SALES BY REGION
Even global businesses will
find they have regional
differences in sales and
revenue. Tracking this
metric will give visibility
into the territories in which
you are competitive and
profitable.
SOFTWARES USED IN SALES AND
MARKETING ANALYTICS
Zoho
Analytics
SAP Crystal
Reports
Datapine Hotjar
Report Plus
Yellowfin Looker
Sisense
QlikView
1:
• Zoho Analytics allow you to monitor and analyze your key sales metrics however
you prefer. This tool comes with a wide variety of customizable data visualization
options and dashboard layouts so you can compile the sales data you need as
effortlessly as possible.
• India U. K U.S Australia are the countries which uses ZOHO Analytics
• Amazon, e records, Facebook, Suzuki, L’oreal, Discovery Channel are the
preference customers.
2:
• Yellowfin is a fully integrated, end-to-end analytics software that processes big
data from multiple sources.
• It provides users with a wide variety of data preparation, governance, and
visualization tools so that they can get a better understanding of their sales
information.
3: Microsoft Excel
• Description
• Microsoft Excel is a spreadsheet developed by Microsoft for
Windows, macOS, Android and iOS.
• It features calculation, graphing tools, pivot tables, and a macro
programming language called Visual Basic for Applications.sales
data (1).xlsx
4:
• Looker is a data-discovery app that provides innovative data exploration
functionalities for businesses both large and small.BA.mp4
• With it, we can access a web-based interface where they can easily get
real-time insights on their operations via data analytics.
Presented By-
Nikhil Sajnani A-10
Arpita N. Shilpkar A-52
Devanshi Soni A-29
Mahavir Vaya A-30
Arpita , 30
Devanshi , 27
Nikhil , 21
Mahavir , 22
CONTRIBUTION(%)
Arpita Devanshi Nikhil Mahavir

Sales and Marketing Analytics

  • 1.
  • 2.
    Sales and MarketingAnalytics TYPES OF ANALYTICS IN SALES AND MARKETING • Descriptive • Diagnostic • Predictive • Machanistic APPLICATIONS OF ANALYTICS • Consumer Behaviour Analytics • Customer segmentation • Modeling For Pricing Automation • Recommendation System • Sales Force Analytics
  • 3.
    Analyzing sales processand team will help us diagnose the barriers to sales force performance. It will enable us bring more efficiency in sales force by providing us insights on issues like optimum sales territory size, optimum product bag size, the quality of leads and monthly target forecasts. Sales Force Analytics
  • 4.
    Marketing Mix Analytics SOFTWARESUSED IN SALES AND MARKETING ANALYTICS Marketing Mix Product Price Place Promotion Zoho Analytics SAP Crystal Reports Datapine Hotjar Report Plus Yellowfin Looker Sisense QlikView
  • 5.
    • Sales include“operations and activities involved in promoting and selling goods or services.” • Marketing includes “the process or technique of promoting, selling, and distributing a product or service.” • Every business would have silos of business data in its marketing/sales department. This data has hidden treasures. It contains information that can help target right audience more effectively, bring in more efficiency in the sales process and also forecast the future of business. To generate these insights from the large unorganized databases we use business analytics. Introduction
  • 6.
    Types of Analyticsin Sales and Marketing Descriptive Diagnostic Predictive Machanistic
  • 7.
    Based on live data. Accurateand Handy for Operations Management. Helps Troubleshoot Issues. Based on Historical Data and assumes a statistic business model. What Happened, When? Why did it Happene d? What will happen when I change the process? How can we make it happen? Based on current data analytics, predefined future plans, goals and objectives.
  • 8.
    Applications of Analytics •Consumer Behaviour Analytics Analyzing consumer behavior would help us understand when, why, how, and where people do or do not buy a product. By understanding this we can bring in changes to our product and marketing strategy helping us attract more consumers. • Customer segmentation This kind of segmentation can be built upon the product groups that come out of a Market basket analysis. Product groups are groups of products that are bought together. This approach basically groups together people on their buying behaviour. People who exhibit similar buying behaviour are grouped together and targeted using segment level strategies.
  • 9.
    Modeling For Pricing Automation Deepermachine learning application may fall in areas such as price elasticity modeling, channel affinity modeling, influence group link modelling, and consumer life event modelling. Recommendation System Recommendation systems are those systems that are widely used in online systems to suggest items that users might find interesting. These recommendations are generated using in particular two techniques: content-based and collaborative filtering. This paper aims to define a new system, namely Marketing Recommender System, a system that serves marketing and uses techniques and methods of the digital economy.
  • 10.
    Marketing Mix Analytics Analyzingreturns on marketing expenditure across various channels would help us evaluate the effectiveness of each of the marketing activities. These insights will help us to reallocate resources from a less effective to a more effective channel. Marketing Mix Product Price Place Promotion
  • 11.
    • Analytics on Communication Content Analyzingconsumer behavior on the communication content helps us observe how consumers react to our marketing material. This gives us insights on how to draw consumer’s attention towards our products and will enable us convey our message clearly. • Web Analytics Web analytics helps us understand user behavior on the web and consequently generate more leads and sales. It will provide insights to enhance the look and layout of your website and make it more user-friendly. With these insights we can also asses and strategize the effectiveness of marketing campaigns in order to get more valuable customers.
  • 12.
    Sales Analytics Metrics Sales metrics helps increase your performance, optimize sales activities, and improve accountability.  A well-defined sales analytics strategy provides your team with focus and clarity so they can concentrate on doing what they do best.  Sales analysis revolves around your ability to grow revenue.
  • 13.
  • 14.
  • 15.
  • 16.
  • 17.
    SALES BY REGION Evenglobal businesses will find they have regional differences in sales and revenue. Tracking this metric will give visibility into the territories in which you are competitive and profitable.
  • 18.
    SOFTWARES USED INSALES AND MARKETING ANALYTICS Zoho Analytics SAP Crystal Reports Datapine Hotjar Report Plus Yellowfin Looker Sisense QlikView
  • 19.
    1: • Zoho Analyticsallow you to monitor and analyze your key sales metrics however you prefer. This tool comes with a wide variety of customizable data visualization options and dashboard layouts so you can compile the sales data you need as effortlessly as possible. • India U. K U.S Australia are the countries which uses ZOHO Analytics • Amazon, e records, Facebook, Suzuki, L’oreal, Discovery Channel are the preference customers.
  • 21.
    2: • Yellowfin isa fully integrated, end-to-end analytics software that processes big data from multiple sources. • It provides users with a wide variety of data preparation, governance, and visualization tools so that they can get a better understanding of their sales information.
  • 23.
    3: Microsoft Excel •Description • Microsoft Excel is a spreadsheet developed by Microsoft for Windows, macOS, Android and iOS. • It features calculation, graphing tools, pivot tables, and a macro programming language called Visual Basic for Applications.sales data (1).xlsx
  • 24.
    4: • Looker isa data-discovery app that provides innovative data exploration functionalities for businesses both large and small.BA.mp4 • With it, we can access a web-based interface where they can easily get real-time insights on their operations via data analytics.
  • 26.
    Presented By- Nikhil SajnaniA-10 Arpita N. Shilpkar A-52 Devanshi Soni A-29 Mahavir Vaya A-30
  • 27.
    Arpita , 30 Devanshi, 27 Nikhil , 21 Mahavir , 22 CONTRIBUTION(%) Arpita Devanshi Nikhil Mahavir