Download as PDF, PPTX


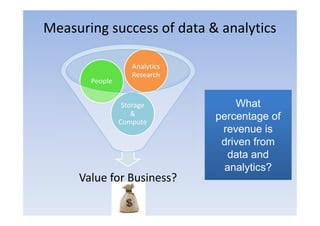
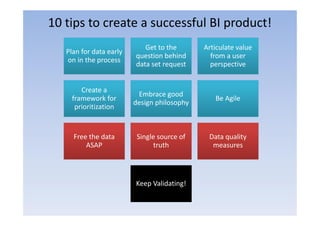


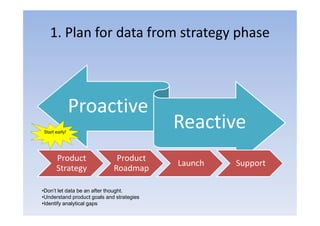


The document presents an overview of product management for business intelligence (BI) platforms aimed at various roles including developers, analysts, and product managers. It highlights the importance of actionable data, the challenges faced in analytics, and offers ten tips for creating successful BI products, emphasizing a user-centric approach. Additionally, it provides insights into measuring success and the importance of design and data quality.


